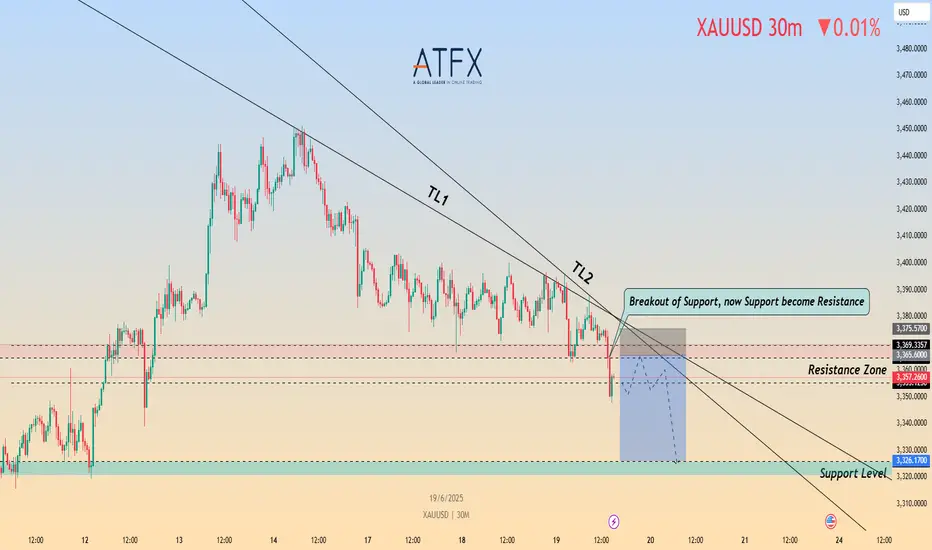
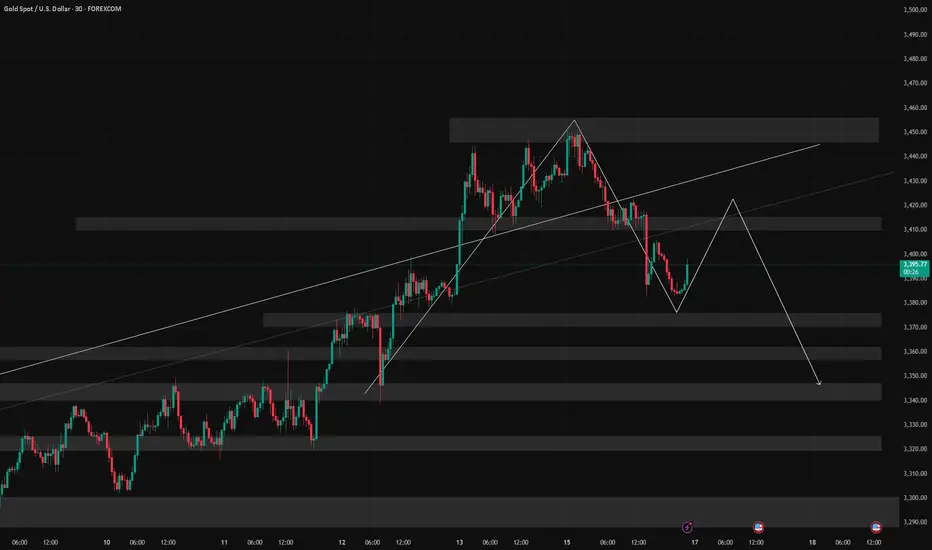
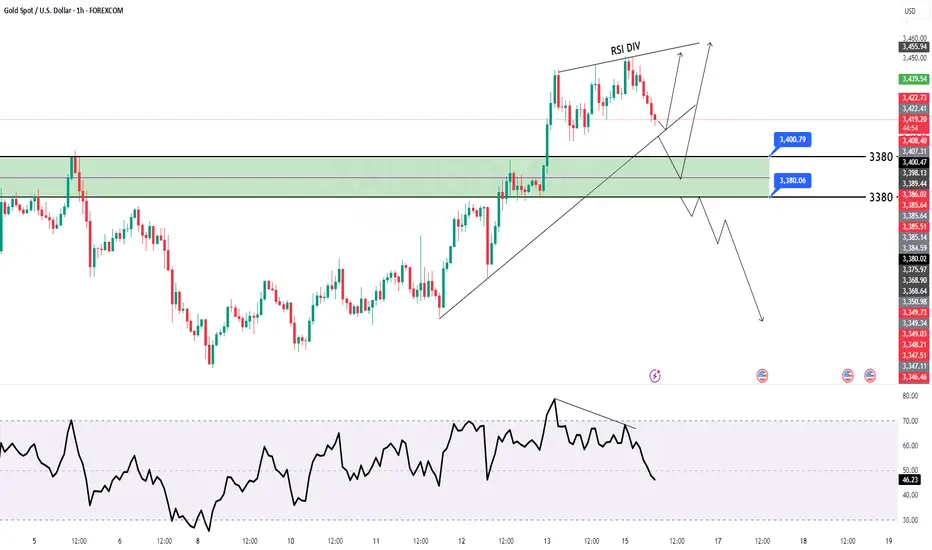
Gold Slips Below Key Support – Is $3,326 Next?OANDA:XAUUSD TVC:GOLD Gold has broken beneath the $3,365–$3,369 support zone, which now aligns with descending trendlines TL1 and TL2 acting as resistance. The 30-minute chart confirms a clean bearish breakout and retest, signalling potential continuation toward lower support near $3,326.
🎯 Short Setup
Entry: $3,365 (retest of broken support / trendline confluence)
Stop: $3,375 (above TL2 and intraday highs)
Target 1: $3,330
Target 2: $3,326
R:R: ~1:3.95
📊 Technical Context
• Price is capped below the $3,365–$3,369 supply zone
• Trendline resistance (TL1, TL2) remains intact from mid-June
• Structure favours continuation lower as long as price stays beneath the retest zone
🌐 Fundamental Backdrop
• Fed held rates steady, but Powell’s tone remained hawkish, warning of “elevated inflation” — supporting USD strength
• Rising Middle East tensions (Israel-Iran conflict) offer safe-haven bids, but not enough to break resistance
• Trump’s tariff threats and criticism of Fed policy add macro uncertainty — mildly supportive of gold in the longer run
📘 Trade Bias
As long as gold holds below $3,365, the bearish thesis remains intact. A sustained push above $3,375 would invalidate the setup and signal a potential reversal or breakout retest.
⚠️ Disclaimer
This analysis is for educational purposes only. Always do your own research and consult a licensed advisor before making financial decisions.
Xauusdsetup
Gold Spot Price Analysis (4-Hour Chart)4-hour candlestick chart for the Gold Spot price in U.S. Dollars (XAUUSD). The chart shows a recent downward trend with a notable dip, followed by an upward correction. A technical analysis pattern is highlighted within a green rectangle, indicating a potential bullish reversal. The current price is $3,374.76, with a decrease of $13.40 (-0.40%). The chart provides insights into short-term price movements and potential trading opportunities.

6/19 Gold Analysis and Trading SignalsGood morning!
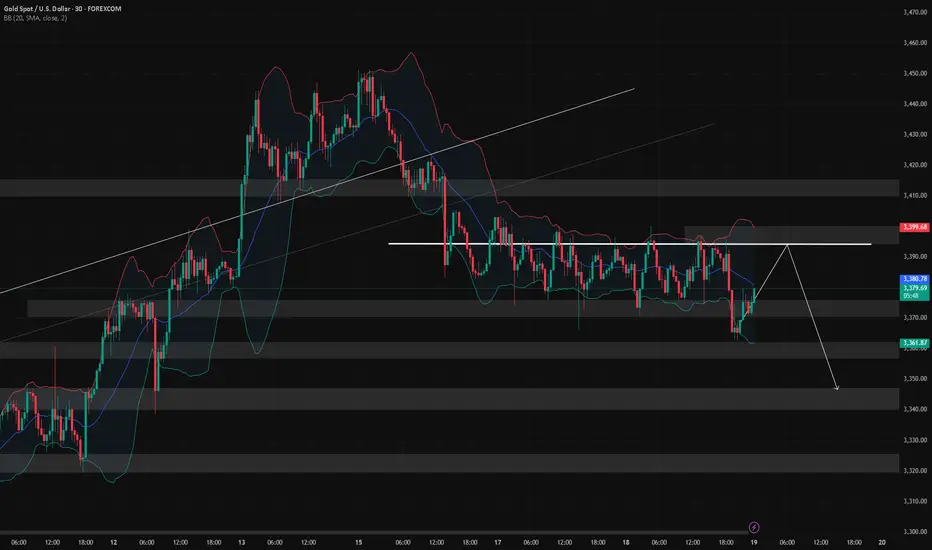
Yesterday, the Federal Reserve's interest rate decision aligned with market expectations, bringing no major surprises. The market had already priced in bearish sentiment in advance, which led gold to trade within the Bollinger Bands' upper, middle, and lower bounds, with all three bands trending sideways, indicating limited intraday volatility.
🔍 Technical Overview:
On the 30-minute chart, the Bollinger Bands began to tilt downward near the close, with price currently pressured by the middle band;
However, MACD structure suggests the middle band may be broken, with potential for price to challenge the upper band resistance near 3392–3400;
More importantly, on the 1D chart, the MACD is showing signs of a bearish crossover (death cross). If confirmed, it may break the bullish structure, weakening support from the weekly MA5;
If gold sustains below the weekly MA10 at 3317, it could open the door for a broader correction, with a drop toward 3200 becoming increasingly likely.
📊 Fundamental Factors:
Today’s U.S. market holiday means fewer economic data releases. As such, gold will likely be driven by technical structure and geopolitical headlines, especially those related to the Middle East. If no new developments emerge, selling on rallies remains the preferred strategy.
📌 Trading Plan (VIP-Focused):
✅ Sell Zone: 3392–3409
✅ Buy Zone: 3338–3321
✅ Scalp/Flexible Zones: 3387 / 3373 / 3364 / 3356 / 3345
GOLD Made Inverted H&S Pattern , Long Scalping Ready !Here is my 15 mins chart on gold and we have a reversal pattern , ( inverted head & shoulders ) and we have a clear closure above our neckline so we can buy it to get the target and then wait for the news tonight and then decide the new direction after news effect .

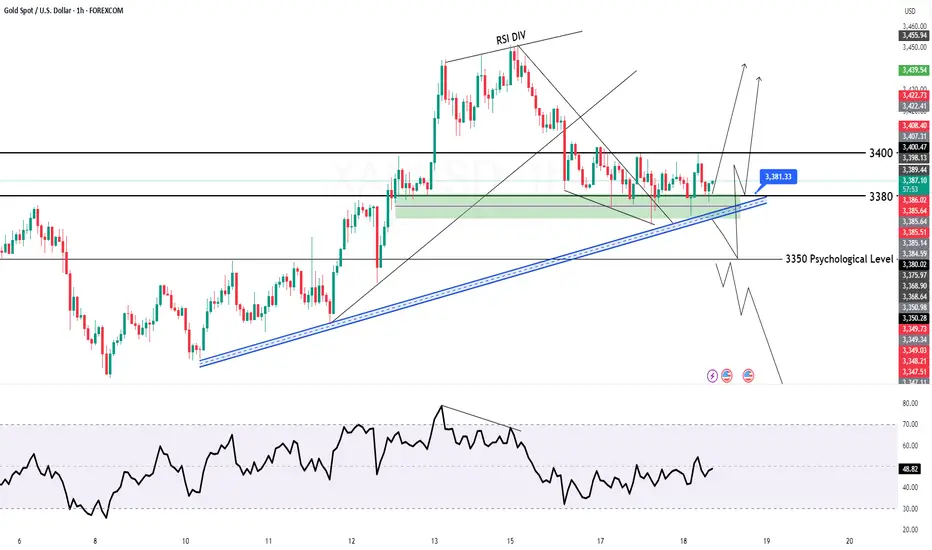
GOLD H1 Intraday Chart Update for 18 June 25Hello Traders, Welcome to the FOMC Day
as you can see that market is in tight range for now which is 3370-3400, we are still waiting for long above 3400 Psychological Level once market will clearly breaks 3400 level we consider long opportunities
if market breaks 3350 Psychological digit successfully then it will move towards 3325 first then focus will 3300 Major Support Level
All eyes on FOMC for the day
Disclaimer: Forex is Risky
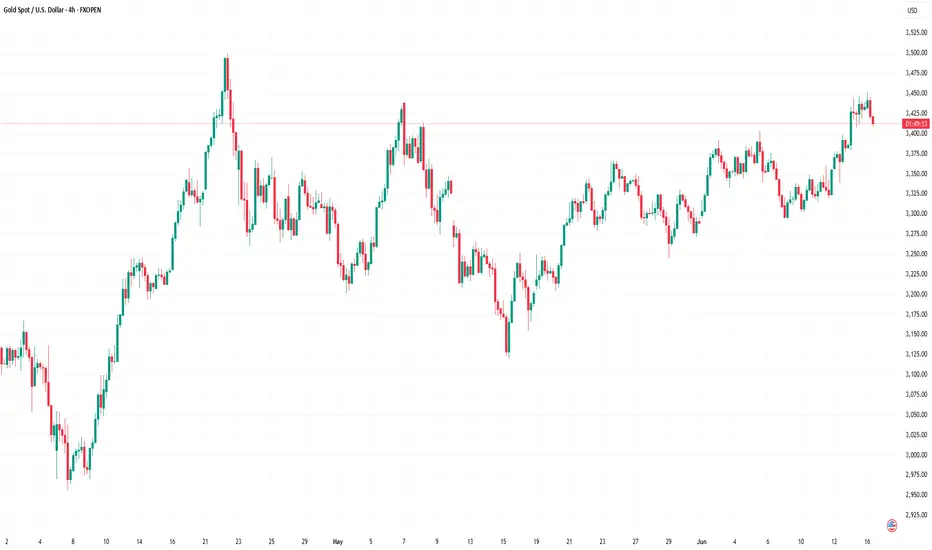
Gold (XAU/USD) 4H Technical Analysis - 18 June-2025Gold has been in a bullish 4H uptrend, making higher highs and higher lows. Recent data show gold peaked near ~$3,445 on June 16 (a new all-time high) before pulling back toward the $3,400 area.
In other words, price action remains constructive: successive higher lows (around $3,372, $3,322) and higher highs (around $3,445) indicate a strong uptrend.
As long as each pullback holds above the prior swing low (so far ~$3,372), the bullish structure (Break-of-Structure, BOS) is intact.
A decisive drop below ~3,372 (and especially below ~$3,322) would violate that structure (a Change-of-Character, CHoCH) and open a deeper correction.
Market Structure & Bias (4H)
Bullish bias: Gold has made a series of higher lows and highs on 4H, confirming an uptrend
Technical indicators (RSI bullish, price above 200-SMA) and fundamentals (safe-haven demand) support this bias.
Caution near $3,400:
The key $3,400 zone has switched roles as resistance-turned-support. Holding above $3,400 keeps bulls in control, but failure to regain it could allow a deeper dip toward ~$3,350.
Break-of-Structure (BOS): A BOS (new 4H high) upholds the uptrend.
A CHoCH (e.g. a close below $3,372/$3,322) would signal a possible reversal
Key 4H Levels & Zones
Resistance/Supply: ~$3,445–3,450 (recent swing high); ~$3,500 (psychological/all-time level).
Price may stall or reverse near these supply zones.
Pivot/$3,400: ~3,400–3,413 zone – a critical pivot. Gold traded near $3,400 recently; a break above targets $3,450, while failure could drop to support.
Support/Demand Zones: ~$3,372 (prior 4H higher-low). Near ~$3,350–3,353 – the 61.8–78.6% Fibonacci retracement of the last rally and a “golden pocket” demand area. ~$3,322–3,328 – a strong 4H demand order-block where price held on the last pullback.
Finally ~$3,300 (major low below).
Order Blocks & Imbalances: Smart-money traders note a 4H demand block at $3,322–3,328 (the low of a large bullish candle).
A brief sweep above $3,338 (a liquidity grab) was followed by a clean bounce from this zone.
Any unfilled gaps (imbalances) near $3,380–3,400 may attract price back during retracements.
In summary, the 4H chart shows a bullish structure with key support at ~$3,372–3,350 (demand/Fib zone) and resistance around $3,445–3,500. As FXStreet notes, the uptrend remains “intact” on 4H as long as dips are bought.
However, traders should watch for any break below $3,372/$3,322, which would flag a bearish structure break.
Until then, the overall bias is bullish, favoring long entries on dips into the above support zones.
1H High-Probability Trade Setups (Bullish Bias)
Setup 1 – Buy on $3,400 pivot hold: Entry zone $3,390–3,400 (at/just above 4H pivot). Stop: ~$3,380 (just below pivot, ~$10 below entry). TPs: $3,420 and $3,450. Trigger: A bullish candlestick pattern or break-and-retest of ~$3,400 (e.g. bullish engulfing or hammer on 1H). Reason: The $3,400 level is a key 4H support/resistance flip.
Holding here would confirm the uptrend continuation, targeting the recent swing highs. A 1H bullish signal (like a reversal bar) gives a clear entry.
Setup 2 – Buy on deep pullback: Entry zone $3,370–3,380 (around 4H higher-low). Stop: $3,360. TPs: $3,400 (the pivot) and $3,420. Trigger: A strong 1H bullish candle or double-bottom forming near zone. Reason: This area lines up with the 4H demand/Fib zone ($3,350–3,372).
It represents a higher-low in the 4H structure. A bounce here would signal buyers stepping in at a key support.
Setup 3 – Buy after breakout of $3,445: Entry zone $3,450–3,455 (above recent high). Stop: ~$3,440. TPs: $3,480 and $3,500. Trigger: A clean 1H candle close above $3,445 (breakout) and retest. Reason: A push above $3,445 (June high) would form a new 4H BOS, suggesting continued momentum. Buying on the breakout retest captures follow-through to the next targets.
(Each setup uses a small $~10 stop relative to gold’s price. Always wait for the specified trigger pattern before entering.)
Takeaway:
On the 4H chart, gold remains bullish while above ~$3,372/$3,350. Key zones to watch are $3,372–3,350 (buy zone) and $3,400–3,445 (sell/resistance). For now, favor long entries into support, and confirm with clear 1H signals before trading.
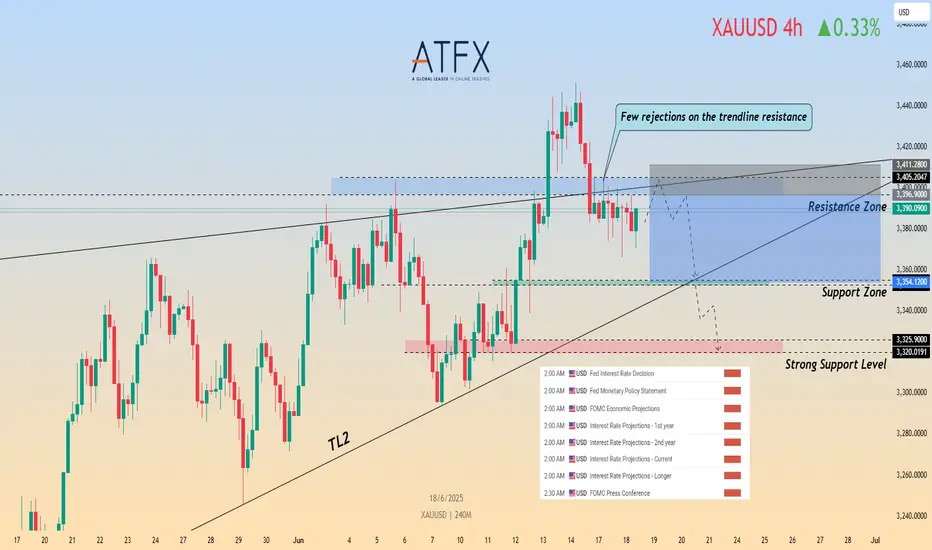
Short Opportunity on XAU/USD: Fed & Conflict Drive Next MoveTVC:GOLD OANDA:XAUUSD XAU/USD is showing multiple rejections at the key resistance confluence of the trendline (TL1) and the $3,396–$3,405 zone. Price remains capped below this level while supported by TL2, with downside potential toward $3,354 and $3,326 if bearish pressure persists. A short setup is in play: entry at $3,396, stop at $3,411, and targets at $3,354 and $3,326, offering a favorable 1:2.97 risk–reward. Invalidation occurs on a 4H close above $3,411, which could open the path to $3,450+. Geopolitical risk remains elevated as the Israel–Iran conflict enters day six, with airstrikes near Tehran and speculation of U.S. involvement following President Trump’s emergency security meeting. Meanwhile, the upcoming Fed decision is key; while no rate move is expected, markets are focused on the updated dot plot and Powell’s tone amid ongoing tariff uncertainty. Long-term support for gold is reinforced by a World Gold Council survey showing 95% of central banks expect global reserves to rise, with a record 43% planning to increase holdings. Short-term bias remains cautiously bearish while below resistance, but any dovish Fed surprise or escalation in conflict may reverse momentum.
Resistance : $3,396 , $3,405
Support : $3,354 , $3,325, $3,320
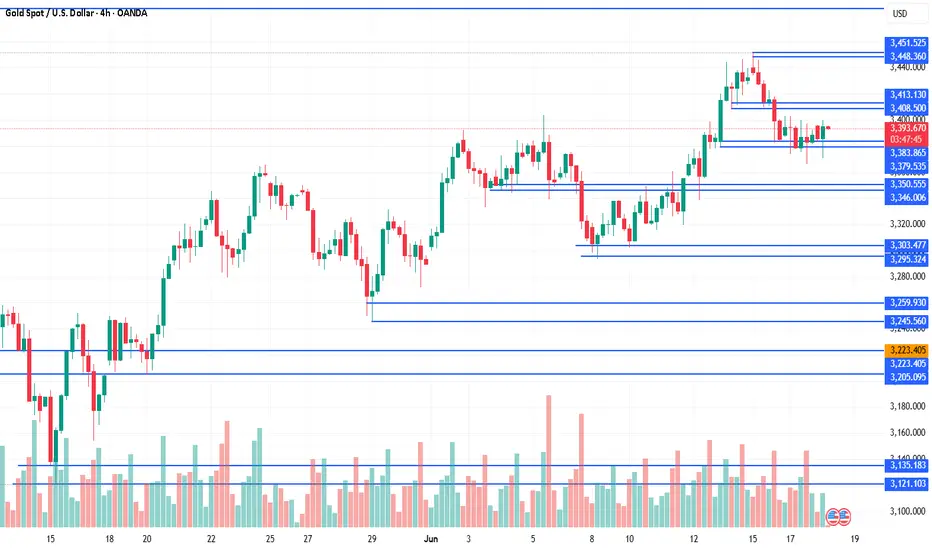
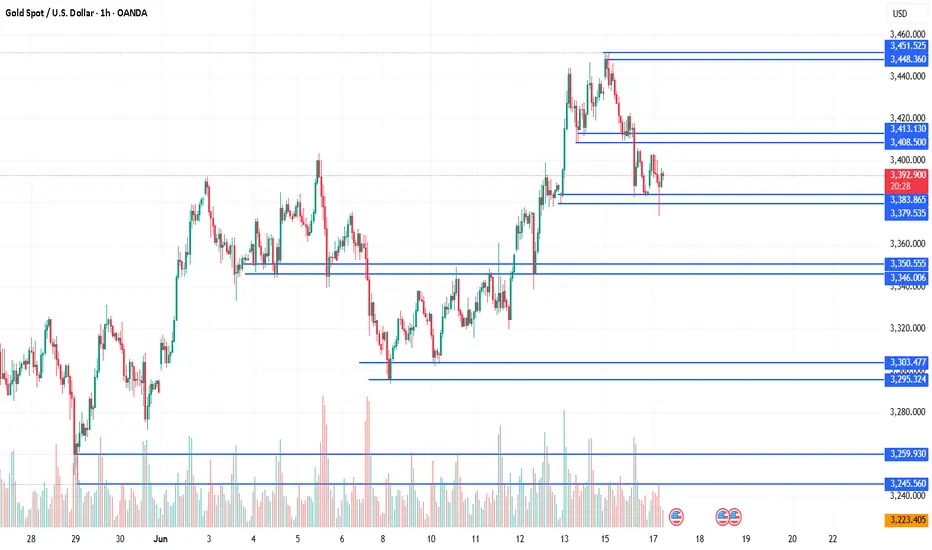
6/17 Gold Analysis and Trading SignalsGood morning!
Yesterday, gold opened with a gap-up and surged to around 3451, but failed to sustain above key resistance. After another failed attempt to break higher, prices gradually turned lower and finally broke below 3400, finding short-term support near 3382.
The primary driver of this decline was a waning of geopolitical risk sentiment, which had previously fueled the rally. Additionally, the market is now pricing in expectations that the Fed will keep rates unchanged, a factor that was likely preemptively reflected in price.
🔍 Fundamental Focus:
Today’s U.S. session will feature a key news release, which may prove decisive for gold’s next directional move. With yesterday’s advance pullback, market dynamics are likely to be more volatile today. We recommend caution, especially ahead of the announcement.
📉 Technical View:
Gold is currently in a post-decline consolidation phase.
The main resistance lies between 3430–3450, while 3415 on the 30-minute chart also presents a short-term cap.
For those entering long positions, target zones should remain conservative, ideally around 3412–3418, and then be adjusted depending on volume momentum and breakout structure.
📊 Weekly Structure Outlook:
The weekly chart shows that gold is at a key trend inflection point.
If no additional bullish catalysts emerge, the market is likely to develop into a bearish consolidation, with the next major downside target around 3200.
📌 Trading Plan (For VIP):
✅ Sell Zone: 3436–3466
✅ Buy Zone: 3347–3323
✅ Flexible Trade Zones: 3428 / 3415 / 3403 / 3392 / 3378 / 3362 / 3354
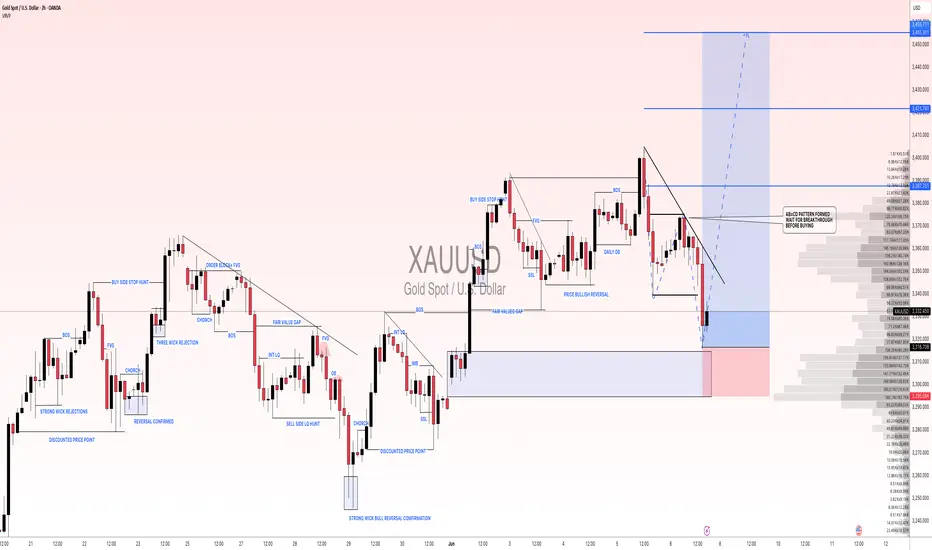
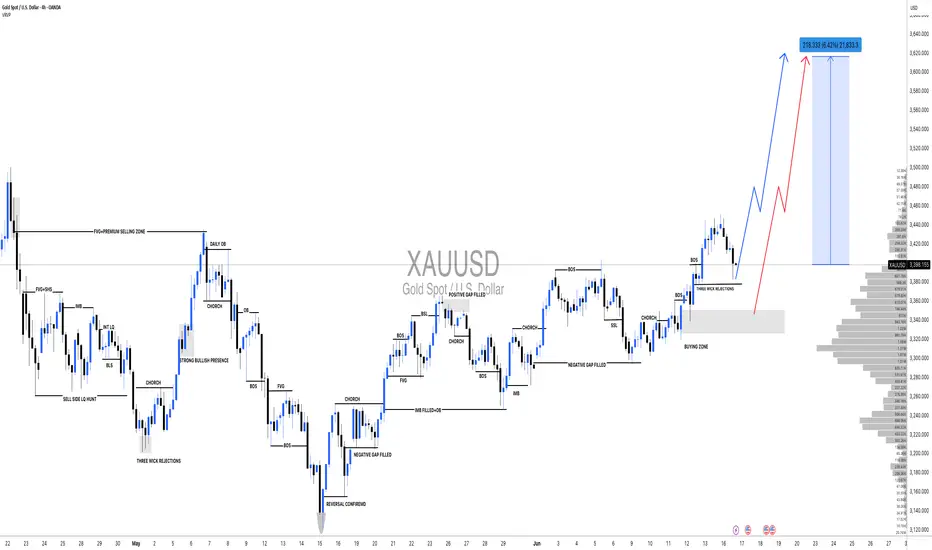
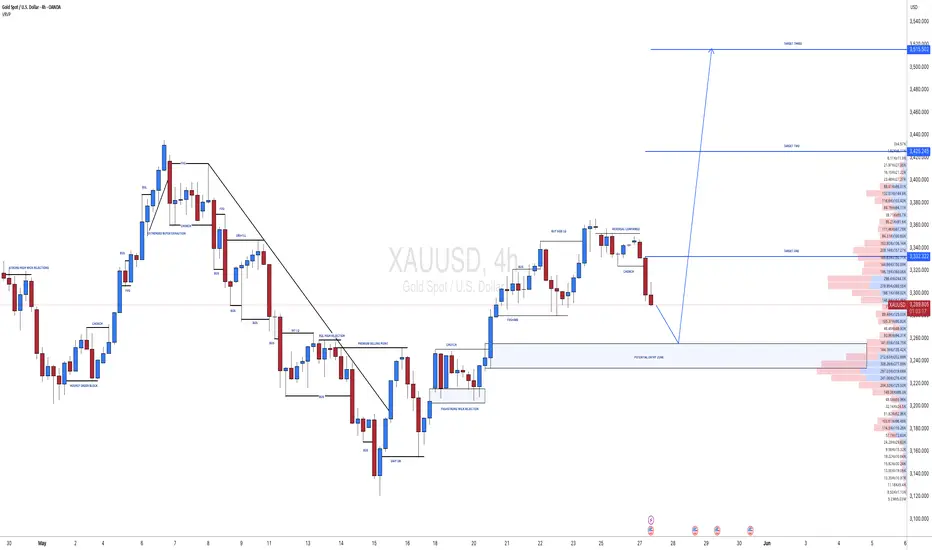
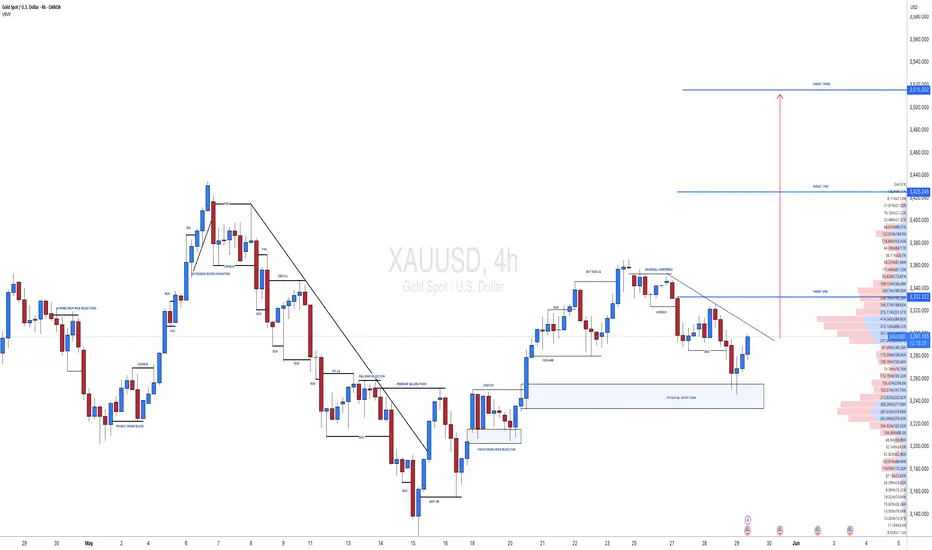
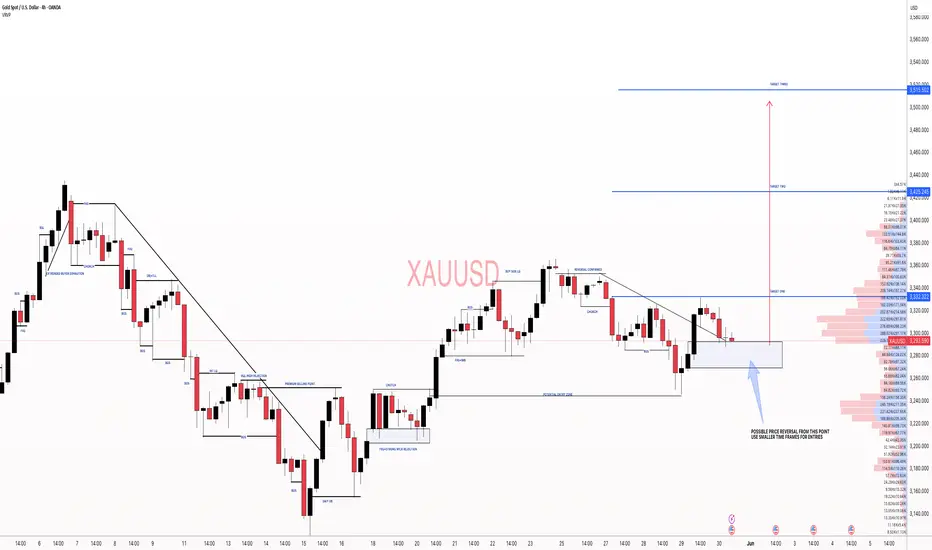
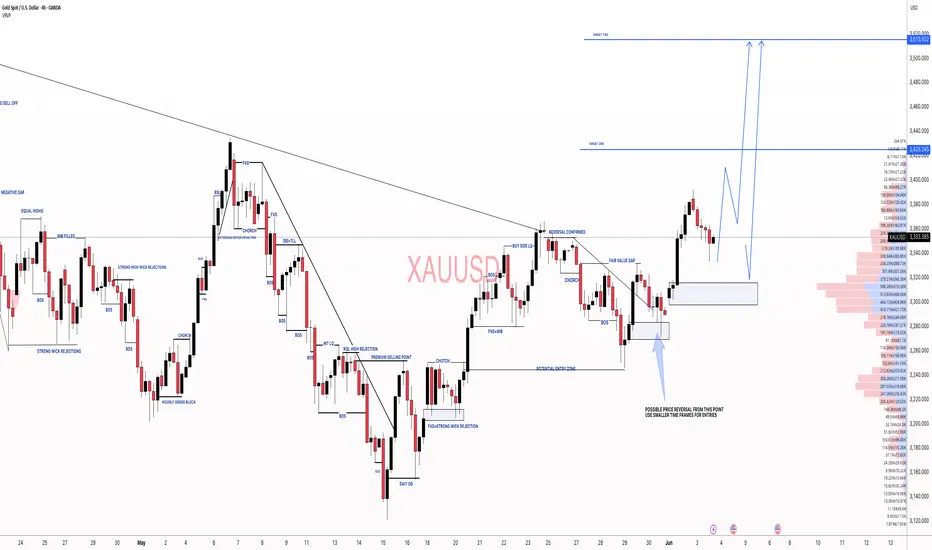
XAUUSD: Accumulation in process,Waiting for Bullish DistributionHello,
Today, we will analyse the key points of each significant move.
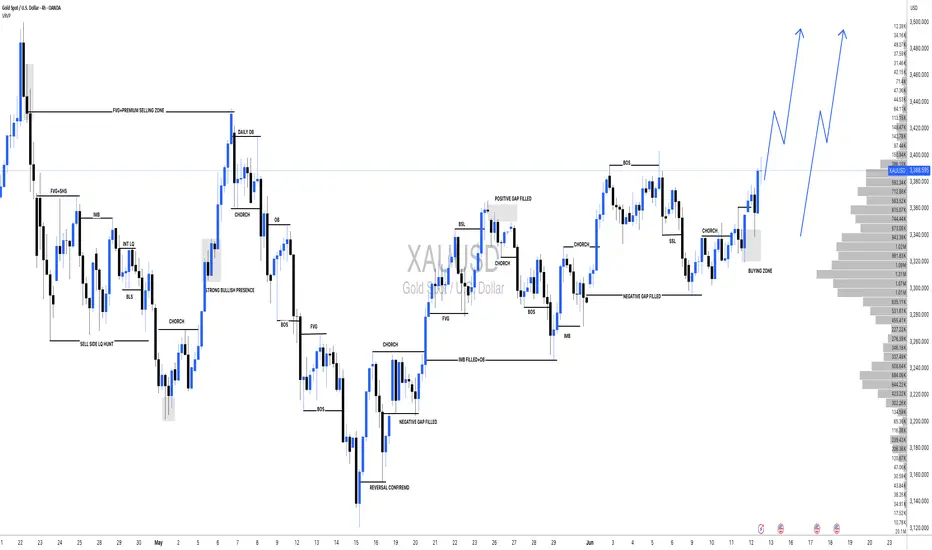
Following the price’s all-time high at $3500, it experienced a sharp decline and failed to maintain that level. A substantial 2400 pips would have resulted in significant losses for many accounts. Initially, it was perceived as a minor correction, with the expectation of further price appreciation. However, this assumption proved incorrect. After reaching an even higher peak, the price invariably undergoes a more substantial correction.
At 3260, substantial bullish volume surged into the market, necessitated by the presence of a fair value gap. Subsequently, the price experienced a decline, reflecting the prevailing bearish trend, which favoured the bears. However, at 3200, a pivotal level representing a discounted price point, bull volume surged. This powerful bullish impulse propelled the price to 3432, ultimately confirming the bullish trend. AB=CD there recurring pattern emerged weekly. When the price reached the 3432 level as a fair value gap, the CD pattern commenced.
AB=CDTheHeyIndeed, we have identified a recurring pattern. It appears to be an equal move in any direction, and it has manifested precisely as anticipated. We were aware that the price would reject at 3120, and it did so accordingly. Currently, the market is in our favour. Upon market opening, it exhibited a positive gap, propelling the price to 3450. However, it subsequently declined, reaching 3384.
Presently, we find ourselves in the accumulation phase, poised for distribution. This distribution is anticipated to be substantial, potentially leading to another record high, potentially reaching 3650.
Moving forward, the price could continue towards our target from its current position. Alternatively, there exists a possibility that it may drain the sell-side liquidity and reverse from 3360-3370.
Our take-profit levels are set at 3450, 3490, 3520, and finally, 3600. When entering the market, it is advisable to employ a short time frame. It is important to note that this analysis is merely our opinion, and market conditions may deviate from expectations.
We extend our best wishes for success and safe trading. If you wish to demonstrate your support, you may consider liking, commenting, or sharing this analysis with others.
Sincerely,
Team Setupsfx_
Gold (XAU/USD) 4H Technical Outlook-17 June 2025Gold’s 4-hour chart shows a clear uptrend: price is making higher highs and higher lows, trading above key moving averages and an upward trendline
Analyst ManiMarkets notes “a remarkably robust and sustained uptrend… printing higher highs and higher lows” since late 2024. The nearest major hurdle is around the $3,500 all-time high.
The current structure remains bullish: we have not seen a sustained break of the uptrend, so the overall bias is bullish. In Smart-Money terms, recent price action shows no bearish break of structure on 4H (no BOS), and price is simply consolidating near highs – a bullish sign.
Key zones to watch:
Demand/Order Block (~$3,374–3,380): Around $3,375 is a swing-low and past demand area. It lines up with the 4H EMA50 and 1H EMA200, a classical support confluence.
A strong bullish “order block” (heavy buying zone) sits here – a typical smart-money support area.
Pivot Point (~$3,389): Using the classic pivot formula
On the recent 4H range gives Pivot ≈ 3,389. This acts as a short-term balance point.
Resistance (≈$3,400–3,405): Gold has multiple prior highs around $3,400–3,405 (e.g. the overnight high ~$3,405 and the last swing high ~$3,405) which have been repeatedly tested. Traders are watching a break above ~$3,405 for follow-through. (A recent idea noted gold “bounced off support” near $3,390 and is “looking for a clean sweep of the highs at 3405”.)
Major Resistance ($3,500): The all-time peak around $3,500 is a big psychological barrier.
We expect stiff supply if price approaches 3,500.
Using these levels, the pivot-based support and resistance on the 4H chart are:
Pivot Point: ~$3,389
R1: ~$3,406 (Pivot + 1×range)
R2: ~$3,421 (Pivot + 2×range)
R3: ~$3,437 (Pivot + 3×range)
S1: ~$3,374 (Pivot – 1×range)
S2: ~$3,357 (Pivot – 2×range)
S3: ~$3,342 (Pivot – 3×range)
(These are rough levels using the standard formula on the last 4H high/low.)
Beyond numbers, price-action is key: we look for bullish patterns at support (e.g. bull-engulfing or pin-bar at ~$3,375–3,380) and cautious action near resistance. A brief “liquidity grab” happened at the $3,375 area recently (price wiggled below and then shot back up), which in Smart-Money jargon sweeps stops.
That suggests larger players may have been absorbing buying interest. In short, the tape looks healthy for bulls unless $3,375 breaks decisively. A break of the $3,400–3,405 highs would be a bullish BOS (break of structure), targeting the next supply zone.
Trade Setups (1H, Aligned with Bullish Bias)
Below are three high-probability long setups on the 1-hour chart (in line with the 4H uptrend).
Each is sized for a ~$10 stop from the entry zone.
Buy near $3,374–3,380 (Demand Zone):
Entry: $3,374–3,380 area (around Pivot S1 and the recent swing low).
Direction: Buy.
Stop: ~$3,364 (just below this zone, ~$10 lower).
Targets: ~$3,402 (near Pivot R1/previous high), and then ~$3,420 (around next resistance).
Reason: This zone is a confluence of support – it was a recent 4H low and aligns with EMAs (1H EMA200/4H EMA50)
It acts like a “bull order block” where buyers stepped in
A strong bounce from here keeps the bullish structure intact.
Trigger: Look for a bullish reversal candle on 1H (e.g. an engulfing or pin-bar) forming near $3,375. This confirms rejection of lower prices and signals a buy setup.
Chart: Example 1H gold chart. Blue shaded area marks the ~$3,374–3,380 buy zone (Pivot S1/EMA support). A bullish reversal candle here would trigger a long entry, targeting $3,402 then $3,420.
Buy break-&-retest at ~$3,402–3,408:
Entry: After a close above ~$3,405, look to buy on a pullback into $3,402–3,408 (just above the old high).
Direction: Buy.
Stop: ~$3,392 (about $10 below the entry zone).
Targets: ~$3,430 (next swing high) and ~$3,450 (round level/upper channel).
Reason: A decisive move above ~$3,405 would mark a BOS (break of the prior high), shifting structure higher. That resistance then becomes support on a retest. This is a classic “breakout retest” entry. (As noted, highs around 3,405 have been tested repeatedly, so breaking them signals strength.)
Trigger: Wait for a 1H candlestick to close firmly above 3,405, then buy on the next pullback into the $3,402–3,408 range with a bullish candle or dip-buy signal.
Buy on pullback to ~$3,385–3,390 (minor higher low):
Entry: $3,385–3,390 if price dips but holds above the 4H pivot (~3,389).
Direction: Buy.
Stop: ~$3,375 (below the entry zone, about $10 down).
Targets: ~$3,420 and ~$3,450 (same as above levels).
Reason: If the market skips Setup 1 and 2, any 1H pullback that still holds above the pivot (creating a higher-low) is another opportunity. Buying this higher-low keeps us aligned with the 4H uptrend. Essentially, we allow price to re-test the pivot area as new demand.
Trigger: A bullish reversal pattern on 1H in the $3,385–3,390 area (for example, a hammer or bullish engulfing) would mark a higher-low and signal a long entry.
Each setup has a tight stop (~$10) just beyond the support zone, and logical profit targets at nearby resistance levels. All assume the 4H trend stays intact. If support fails (e.g. a clean break under $3,374), be ready to reassess.
Takeaway: Gold’s 4H trend is bullish, so focus on buying dips into identified support zones (not shorting). Use tight stops beyond those zones and aim for the next resistance. In practice, that means looking to go long around ~$3,375–3,380 and ~$3,405 (on a clean breakout), riding any bullish continuation toward $3,430–$3,450, while managing risk at each step.
opportunity for selling GOLDI see that gold has confirmed strong resistance, so I took a sell trade with it.
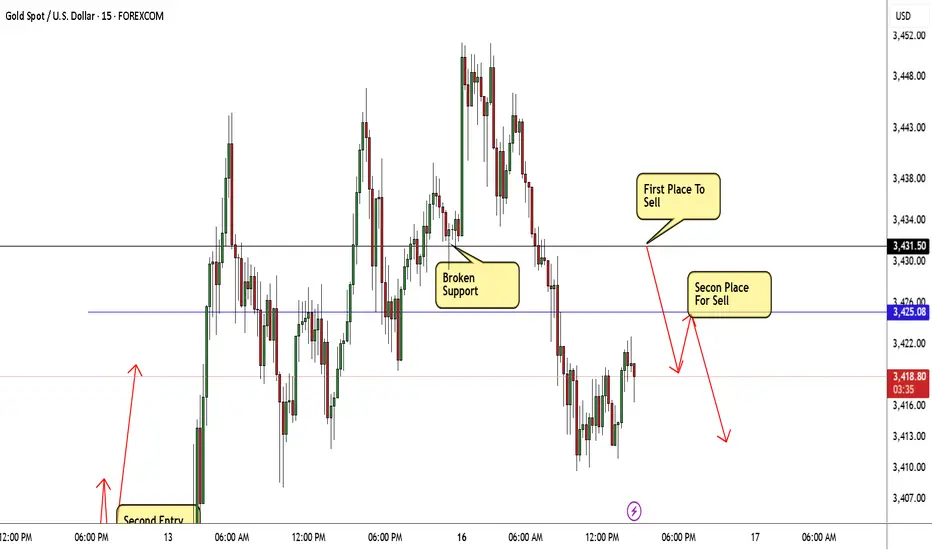
GOLD Best 2 Places For Sell Very Clear To Get 500 Pips !Here is my 15Mins T.F Chart On Gold and here is my fav 2 places to sell this pair , if we take a look on the chart we will see that we have avery good support @ 3431.50 and the price broke it and close below it and now i`m waiting for retest to this broken support and new res , and if i have a good bearish price action i will enter a sell trade and targeting the first support @ 3425.00 and if i have a good closure below it at least with 30 Mins Candle then i can add another contract and targeting the second support , if we have a closure above 3431.50 this idea will not be valid .
Safe-Haven Demand Drives Gold Higher – 3500 Within ReachWishing everyone a peaceful weekend—despite turbulent times.
This weekend has been anything but calm. The escalating conflict in the Middle East continues to widen, with rising casualties. As always, war is often a pursuit of power by those at the top, while the real cost is borne by innocent civilians. Though we are mere observers from afar, it’s hard not to feel the weight of the situation.
From a geopolitical perspective, this conflict coincides with U.S.–Iran nuclear negotiations. Could this be a calculated move by certain powers to shift the balance in their favor? While it remains speculative, what’s certain is that the intensifying conflict is already shaking global financial markets.
In such a climate, safe-haven assets are clearly benefiting. Gold’s upward momentum appears firmly established, and oil’s direction hinges on the situation at the Strait of Hormuz. If the strait is closed, a surge in USOIL prices toward $100 would no longer seem unlikely.
Under the influence of such impactful news, traditional technical analysis plays a lesser role. The market direction is largely determined by sentiment, and chart patterns now serve more as entry point references rather than decisive indicators.
My trading outlook for Monday:
If gold opens with a bullish gap and rallies toward the 3480–3500 zone, this area could present a short-term selling opportunity—ideally executed with a quick in-and-out strategy;
If a pullback follows, look to build intraday long positions: aggressive traders may consider entries near 3430, while conservative ones can wait for a potential retest of the 3418 level.
One crucial reminder: News-driven markets are highly uncertain. Eventually, every war comes to an end, and when the demand for safe havens fades, so too will prices. Stay rational in your decisions, and always manage your risk appropriately.
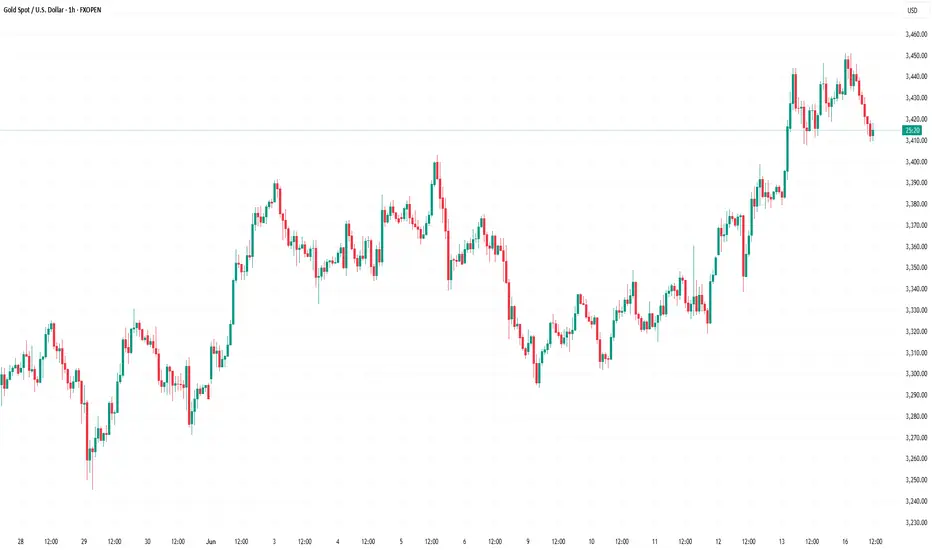
Gold Regains Bullish MomentumGold Regains Bullish Momentum
Gold price started a fresh surge above the $3,375 resistance level.
Important Takeaways for Gold Price Analysis Today
- Gold price started a fresh surge and traded above $3,420 against the US Dollar.
- A key bullish trend line is forming with support at $3,415 on the hourly chart of gold at FXOpen.
Gold Price Technical Analysis
On the hourly chart of Gold at FXOpen, the price formed a base near the $3,300 zone. The price started a steady increase above the $3,350 and $3,375 resistance levels.
There was a decent move above the 50-hour simple moving average and $3,400. The bulls pushed the price above the $3,420 resistance zone. A high was formed near $3,450 and the price is now consolidating gains.
On the downside, immediate support is near the $3,415 level and the 23.6% Fib retracement level of the upward move from the $3,301 swing low to the $3,451 high.
Besides, there is a key bullish trend line forming with support at $3,415. The next major support sits at $3,375 and the 50% Fib retracement level of the upward move from the $3,301 swing low to the $3,451 high.
A downside break below the $3,375 support might send the price toward the $3,335 support. Any more losses might send the price toward the $3,300 support zone.
Immediate resistance is near the $3,450 level. The next major resistance is near the $3,460 level. An upside break above the $3,460 resistance could send Gold price toward $3,480. Any more gains may perhaps set the pace for an increase toward the $3,500 level.
This article represents the opinion of the Companies operating under the FXOpen brand only. It is not to be construed as an offer, solicitation, or recommendation with respect to products and services provided by the Companies operating under the FXOpen brand, nor is it to be considered financial advice.
XAU/USD Chart Analysis Following Israel-Iran StrikesXAU/USD Chart Analysis Following Israel-Iran Strikes
In 2025, the price of gold continues to form a long-term upward trend, highlighted by the black line. The red line previously acted as resistance, resulting in the formation of a contracting triangle on the XAU/USD chart – a typical sign of market equilibrium.
However, this red line was breached (as indicated by the arrow) amid news of the exchange of strikes between Israel and Iran. In response, gold price movements have more clearly outlined the rising blue channel, which began to take shape in the second half of May.
Over the weekend, the strikes continued, and on Monday morning, trading opened with a modest bullish gap. This indicates that geopolitical risk concerns are helping to keep gold prices anchored above the red line.
What could happen to the price of gold next?
Much will depend on how the situation in the Middle East develops. Should the exchange of strikes between Iran and Israel subside and official statements offer hope for de-escalation, a pullback from the upper boundary of the blue channel is likely.
If such a scenario plays out, technical analysts may focus on the support zone around $3,390–3,400 on the XAU/USD chart, formed by:
→ the psychological level of $3,400;
→ the red line, which previously acted as resistance;
→ the median of the blue channel.
This article represents the opinion of the Companies operating under the FXOpen brand only. It is not to be construed as an offer, solicitation, or recommendation with respect to products and services provided by the Companies operating under the FXOpen brand, nor is it to be considered financial advice.
GOLD H1 Intraday Chart Update For 16 June 2025Hello Traders,
Read GOLD intraday Chart carefully as WAR scenarios is still active, only if market breaks 3400 Psychological Level Successfully then we will consider or expect longer term selling
otherwise market remains Bullish
Disclaimer; Forex is Risky
Gold (XAUUSD) Trading Setup – Mid-June 2025 Analysis🔰 Gold (XAUUSD) Trading Setup – Mid-June 2025 Analysis
This chart represents a strategic price action-based setup on Gold (CFDs on Gold – US$/Oz) using a 15-minute timeframe. It includes clearly defined entry zone, support/resistance levels, and profit-taking targets (TP1, TP2) for both bullish and bearish scenarios.
🔍 Current Market Context
Current Price: ~$3431.77
Structure: The price has been in an upward trend with a consolidation phase forming near the key mid-zone.
Highlighted Zone: A decision zone is marked in red (between ~$3422 and ~$3418), acting as the key liquidity zone or breakout area.
📈 Bullish Bias
If price breaks and holds above the red zone:
✅ TP1: $3480
✅ TP2: $3580
These levels act as short- to mid-term bullish targets based on projected extensions of recent upward momentum.
📉 Bearish Bias
If price breaks and holds below the red zone:
✅ TP1: $3320
✅ TP2: $3260
This indicates a possible reversal or correction phase, with targets derived from recent swing lows and support areas.
📌 Trading Notes
The blue shaded areas represent target zones for partial or full exits.
Red zone is the critical breakout decision point.
Ideal for breakout or pullback traders.
Can be combined with volume/confirmation indicators (e.g., RSI, MACD, or price action candles) for entry timing.

XAUUSD:Touching $3500 One More Time Gold is currently extremely bullish and we expect price to touch 3500$ region one more time before it may reverse. you can set your own target based on your risk. Gold will remain volatile in coming weeks and we want all of you to trade safe.
Good luck and trade safe.
Team Setupsfx_
XAUUSD:[GOLD]: First Drop And Then Reverse! Comment Your Views! Gold touched $3350 but was rejected at that level, dropping around 3288. The price shows some minor support at this region, which we’re currently monitoring. If it breaks through, it could touch our buying zone, reversing the trend. You can set three targets based on your own analysis and bias. Please use accurate risk management while trading.
If you’d like to contribute, here are a few ways you can assist us:
- Like our ideas
- Comment on our ideas
- Share our ideas
Team Setupsfx_🚀❤️
#XAUUSD[GOLD]: Massive Boost For Buyers, Incoming More Volume! Gold has been moving as expected in our previous chart. We anticipate a smooth bull market in the coming days, with a target price region of 3400$. There are three specific targets you can aim for.
If you’d like to contribute, here are a few ways you can help us:
- Like our ideas
- Comment on our ideas
- Share our ideas
Team Setupsfx_🚀❤️
#XAUUSD[GOLD]:At Critical Level, Bullish Swing Is Very LikelyHey There Everyone,
So, gold prices took a bit of a dip, hitting 3250 gold. But guess what? They bounced back like a rubber ball and reached 3332! And here’s the exciting part: they broke through that pesky bearish trend line. This means they’re probably going to retest that line to confirm the trend.
Right now, it looks like they’re at a potential retest point, and that’s where things could get really interesting. If strong bullish volume comes in, the price could skyrocket! There are three possible targets here: 3332, 3362, and 3420.
Now, here’s something important to keep in mind: next week, there are some big news and events coming up that could totally shake things up in the gold market. And let’s not forget about price manipulation. If someone tries to mess with the price, it could drop back to 3250 and then reverse course. So, it’s crucial to have backup plans in case of any unexpected twists.
The US dollar is also going to be all over the place due to upcoming news, which could disrupt the gold market and other currencies. So, it’s best to trade cautiously today and next week. The price can be a bit unpredictable, so take your time to do your own analysis and assess your risk before making any moves.
Good luck and trade safely! We wish you all the best in your trading journey!
Cheers,
Team Setupsfx_
XAUUSD: Still Bullish with improved entry zones! Gold experienced a sudden drop today, falling to 3335 after briefly reaching 3391. This unexpected decline was not anticipated given the bullish price momentum. However, it has provided clarity for buyers, particularly swing traders. The price could drop to 3340 once more before reversing and hitting our first target, followed by a second target later.
Another possible scenario arises if the price continues to drop further. In this case, the second entry scenario becomes more secure, as Asian session volatility could cause the price to go sideways.
Please use accurate risk management and consider liking and commenting on this idea.
Good luck and trade safely.
Team Setupsfx_
XAUUSD:06/06/2025 Update! Gold experienced a decline to 3314 following the release of unexpectedly strong NFP data. However, this decline is unlikely to lead to further price drops below 3314. This is primarily due to the ongoing turmoil within the president’s own political party, which is only just beginning to unfold and will likely intensify in the coming weeks.
Before making any trading decisions, it is advisable to conduct your own analysis. Additionally, the current price action has established an AB=CD pattern, where the price has successfully reversed from point ‘d’. This pattern suggests that waiting for the price to break out could be a prudent strategy for a safe entry.
Three targets have been reasonably set, with the potential to reach target two. However, the target three remains uncertain. The total potential profit from this idea is approximately 1300 pips.
It is also important to monitor the DXY closely. We recommend waiting for the price to complete its bullish correction before taking an entry on gold.
We sincerely hope that this analysis proves beneficial. Please consider liking, commenting, and sharing this post to encourage us to provide more such insights.
Best regards,
Team Setupsfx_