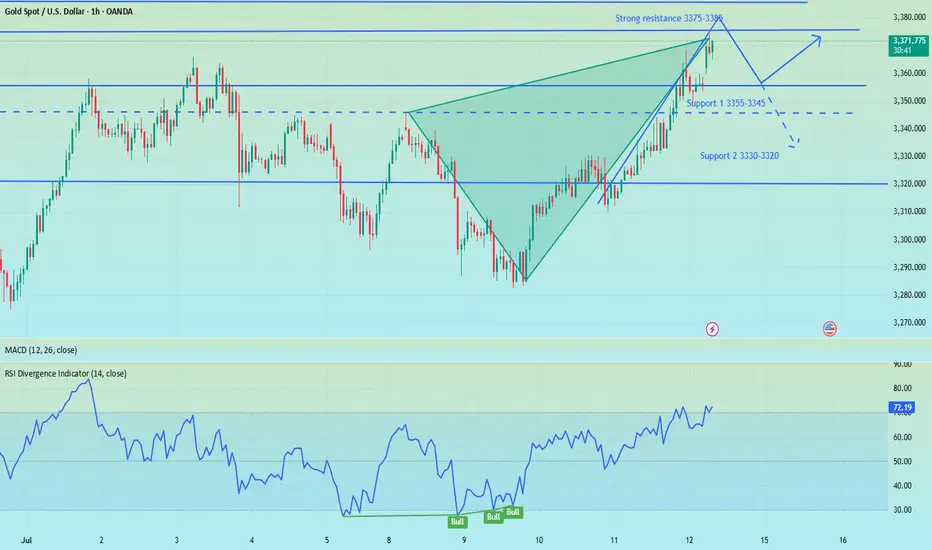
Gold gaps up and open higher,beware of going long at high levelsBros, the Asian session opened higher in the morning. Currently, gold is falling back to the SMA1O moving average. We will continue to be bullish after it falls back and stabilizes. At present, it has broken through the key resistance level of 3360. The daily line has shown a strong pattern of three consecutive positives. The gold price remains in the rising channel, and the bullish trend is obvious. As the gold price moves up, the short-term moving average moves up with it. At present, 3355-3345 constitutes an important support in the short term, and 3375-3385 above constitutes a short-term resistance area. Whether it can stand firmly above 3360 this week is the key.
Severe overbought in the short term, there are trading risks for long positions at high levels. Short-term operation suggestions for the Asian and European sessions: consider shorting when it touches 3365-3375, and stop loss when it breaks 3375. The target focuses on 3355-3345, and the breakout looks at 3330-3320. On the contrary, if it stabilizes at 3355-3345, you can consider going long.
Xauusdshort
Short position profit, focus on 3355-3345 support📰 News information:
1. Focus on tomorrow's CPI data
2. Bowman's speech at the Federal Reserve
3. Tariff information outflows and countries' responses to tariff issues
📈 Technical Analysis:
The short-term bears have successfully hit the TP to realize profits, and the trading strategy is still valid. Continue to pay attention to the 3355-3345 support during the day. If effective support is obtained here, you can consider going long. For the rebound, the first TP can focus on the 3365 line. If the gold price breaks through 3380 in the future, it will not be far from 3400. If it falls below, pay attention to the support of 3330-3320 below. It is expected that this is the limit position of short-term bearishness. The impact of tariffs is still there, and the bullish trend remains optimistic in the short term, unless Europe, Japan and other countries have a new solution to tariffs.
🎯 Trading Points:
BUY 3355-3345
TP 3365-3380-3400
In addition to investment, life also includes poetry, distant places, and Allen. Facing the market is actually facing yourself, correcting your shortcomings, facing your mistakes, and exercising strict self-discipline. I share free trading strategies and analysis ideas every day for reference by brothers. I hope my analysis can help you.
OANDA:XAUUSD PEPPERSTONE:XAUUSD FOREXCOM:XAUUSD FX:XAUUSD TVC:GOLD FXOPEN:XAUUSD
XAU/USD: Analysis and Strategy Amid Trade ConflictsA rate cut this month is highly unlikely, with the earliest possible delay to September. Currently, the gold market trend is still dominated by tariff factors. Although the tariff war was extended for 90 days in April, the 10% base tariff imposed on all trading countries during this period has already made the total tax revenue of these three months reach 70% of that in previous years.
Trump's launch of the tariff war has clear core goals: first, to directly increase U.S. fiscal revenue; second, to boost exports through policy inclination, while helping enterprises increase profits to expand the tax base; third, to promote the growth of domestic employment. Just last weekend, his administration announced that it would impose a 30% tariff on the European Union and Mexico, and the new regulations will take effect on August 1.
Against this backdrop, the escalation of trade conflicts has become increasingly obvious. For gold, this means continuous and strong support, and the certainty of its upward logic has been further enhanced. From a long-term perspective, the gold market is not expected to see a deep correction in the second half of the year.
After pulling back to around $3,280 last week, the price has embarked on a sustained upward trajectory and now fluctuates within the range of $3,345-$3,380. For this interval, a strategy of buying low and selling high would be appropriate.
I am committed to sharing trading signals every day. Among them, real-time signals will be flexibly pushed according to market dynamics. All the signals sent out last week accurately matched the market trends, helping numerous traders achieve substantial profits. Regardless of your previous investment performance, I believe that with the support of my professional strategies and timely signals, I will surely be able to assist you in breaking through investment bottlenecks and achieving new breakthroughs in the trading field.

XAUUSD Analysis – July 14, 2025: Gold Tests Critical Resistance Gold (XAUUSD) is currently trading around $3,373, rebounding strongly from the recent low at $3,294. Price is now testing the key resistance zone at $3,372–3,375, which aligns with the 0.0 Fibonacci retracement of the previous downtrend and a significant supply zone on the H4 timeframe.
1. Technical Analysis (H4 Chart):
🔹 Fibonacci & Price Action:
The price found strong support at $3,294, where previous demand and Fibonacci levels converge.
A sharp bullish move has pushed price above the 0.5 (at $3,316) and 0.618 (at $3,322) Fibonacci levels – signaling strong buyer interest.
The $3,372 zone is now acting as short-term resistance, matching the previous swing high.
🔹 EMA & RSI:
EMAs are trending upward, confirming short-term bullish momentum.
RSI is approaching overbought territory, suggesting a potential pullback in the short term.
🔹 Trendline & Structure:
Price remains above the rising trendline, indicating sustained bullish momentum.
The nearest support zone is now at $3,322 – $3,333, which overlaps with key Fibonacci and previous structure levels.
2. Key Price Levels:
Price Zone
Significance:3,372 – 3,375
Short-term resistance – Fibo 0.0:3,345 – 3,333
First support – pullback zone:3,322 – 3,316
Strong support – EMA + Fibo 0.5:3,294 – 3,287
Major support – recent swing low
3. Suggested Trading Strategies:
Strategy 1 – Take Profit for Existing Longs:
If you entered long positions near $3,295–$3,300, consider taking partial profits at the current resistance zone ($3,372–$3,375).
Strategy 2 – Short-Term Sell Opportunity:
Consider a short entry near $3,372–$3,375, with a stop-loss above $3,383.
Target profit: $3,333 – $3,322
Strategy 3 – Buy on Dip (Trend Continuation):
If price pulls back to the $3,333 – $3,322 support and holds, this is a good zone to enter long.
Stop-loss below $3,316, with potential target back to $3,385 – $3,400 if a breakout occurs.
Gold is showing a solid recovery after a sharp decline, but it is now testing a key resistance zone around $3,373. Caution is advised in the short term, as a pullback may occur. Priority should be given to "Buy on Dip" strategies if support zones hold.
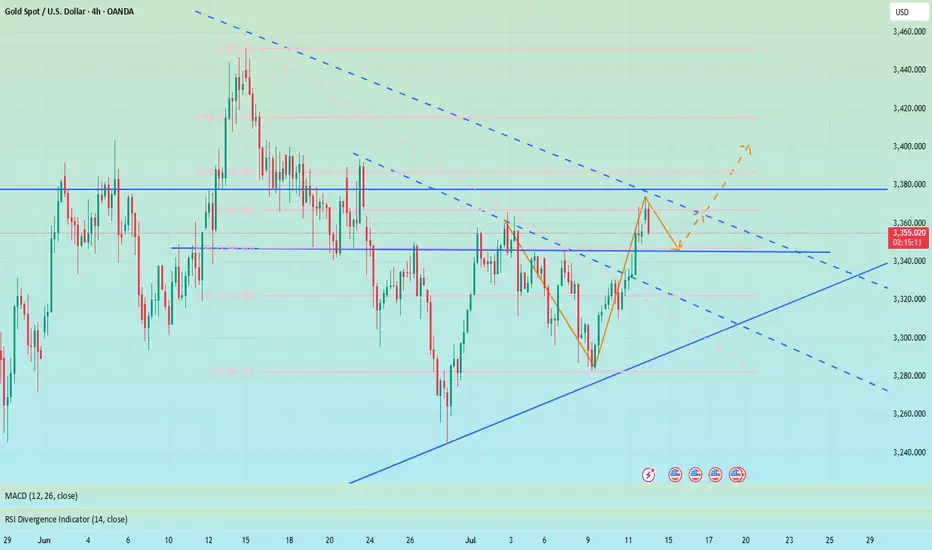
Gold trend forecast for next week, continue to go longAfter the gold broke through on Friday, we started to turn long, and gold rose strongly. Gold finally rose as expected, and the gold bulls are still strong. If there is no major change in the news over the weekend, the decline next week will not be large, and we can continue to buy. The gold 1-hour moving average continues to cross upward and the bulls are arranged and diverge. The strength of gold bulls is still there, and the gold moving average support has also moved up to around 3330. After gold broke through 3330 yesterday, gold fell back to 3330 and stabilized and rose twice. The short-term gold 3330 has formed a strong support. Gold will continue to buy on dips when it falls back to 3330 next week.

The impact of tariffs continues, shorting is expected to retrace📰 News information:
1. Focus on tomorrow's CPI data
2. Bowman's speech at the Federal Reserve
3. Tariff information outflows and countries' responses to tariff issues
📈 Technical Analysis:
During the weekend, the Trump administration's tariff information continued to come out, causing a large amount of funds to flow into the safe-haven market, triggering an escalation of market risk aversion. Although the collapse in the previous tariff remarks did hit the market's buying enthusiasm to a certain extent, the strong rise on Friday also stimulated the market's buying enthusiasm again. This, whether it is on the way down or on the way up, has attracted retail investors to a certain extent. As we judged on gold on Friday and the weekend, short-term bulls are undoubtedly strong. However, I think it is very dangerous to continue to chase long positions at high levels. Therefore, I tend to short-term and then consider continuing to chase long positions after the market retreats to the support level.
First of all, the CPI data will be released tomorrow. With inflation in the United States currently heating up, the Federal Reserve is undoubtedly resisting a rate cut in July. This has, to some extent, dampened the enthusiasm of bulls. Secondly, it is necessary to pay attention to the response of Europe and Japan to the tariff issue. Due to the timeliness, the current market expectations are undoubtedly limited.
In the short term, the RSI indicator is already seriously overbought. For today's operation arrangement, it is recommended to short at the rebound of 3365-3375. If the gold price continues to maintain a strong trend in the short term and breaks through this resistance area, it is time to stop loss. First of all, we should pay attention to whether 3355-3345 can be broken. Once it falls below the support of 3355-3345, we will need to see the 3330 line below, and it may even fall below 3300. Therefore, we also need to take precautions and follow up.
🎯 Trading Points:
SELL 3365-3375
TP 3355-3345
In addition to investment, life also includes poetry, distant places, and Allen. Facing the market is actually facing yourself, correcting your shortcomings, facing your mistakes, and exercising strict self-discipline. I share free trading strategies and analysis ideas every day for reference by brothers. I hope my analysis can help you.
FXOPEN:XAUUSD TVC:GOLD FX:XAUUSD FOREXCOM:XAUUSD PEPPERSTONE:XAUUSD OANDA:XAUUSD
GOLD Breakout or Fakeout? Thief’s Guide to Safely Rob the Move!🏆 XAU/USD Master Plan: Loot the Bullish Rally Before the Bearish Trap!💨💰
🌟 Hola! Bonjour! Hallo! Marhaba! 🌟
Attention Money Makers & Market Robbers! 🤑💸
🔥 Thief Trading Strategy Alert 🔥
Time to execute our gold heist on XAU/USD! Based on technical + fundamental looting tactics, here’s the play:
📈 ENTRY ZONES (4H TIMEFRAME)
BUY: Sneak in at Market Maker’s Buy Zone (Pullback Entries Only!).
SELL: "The vault’s wide open!"—Ambush bearish traps at risky highs (Red Zone).
🛑 STOP-LOSS (THIEF RULES)
Hide your SL at:
Past key lows OR nearest swing low (4H).
Adjust based on your risk, lot size, & robbery multiplier.
🎯 TARGET: 3525.00 (OR ESCAPE EARTHER!)
Scalpers: Long-side only! Trail your SL to lock loot.
Swing Thieves: Join forces—big pockets or small, execute the plan!
⚠️ WARNING: NEWS = VOLATILITY TRAPS!
Avoid new trades during news.
Use trailing SL to protect stolen profits.
📰 FUNDAMENTAL LOOT LIST (READ BEFORE HEIST!)
COT Report, Macro Data, Sentiment Outlook—Link in bi0! 🔗🤙🏻👉🏻👉🏻
Gold’s bullish now… but robbers adapt fast!
💥 BOOST THIS PLAN = STRONGER GANG!
Hit 👍 & Share—More boosts = More gold stolen daily!
Stay tuned… Next heist drops soon! 🚀🐱👤

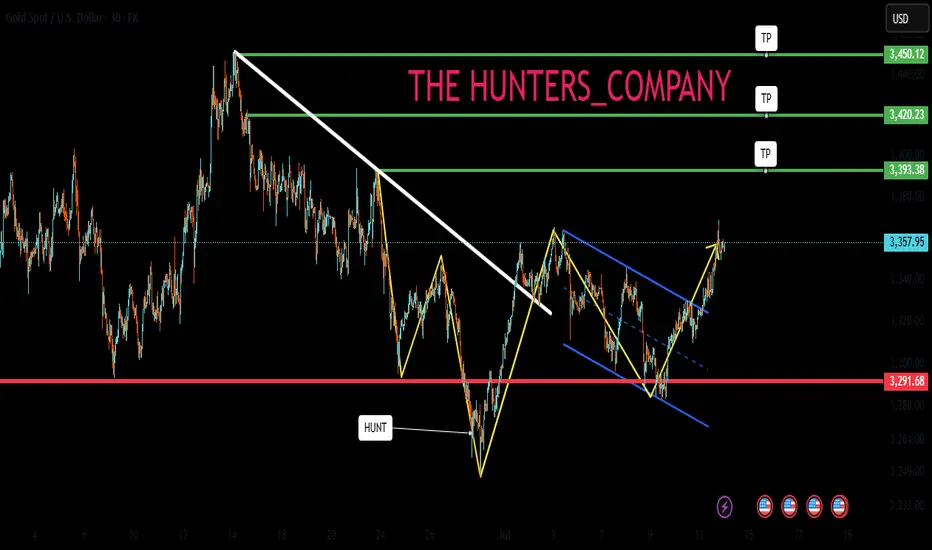
GOLD UPDATE Hello friends🙌
📉Regarding the decline we had, which we also analyzed for you and said that the price is falling...
✔Now, with the support hunt identified, you can see that the price has returned strongly and broken the identified resistance and managed to reach higher ceilings, which also created a QM pattern, which increases the likelihood of the upward trend continuing.
Now with capital and risk management you can move towards your specified goals.
🔥Follow us for more signals🔥
*Trade safely with us*
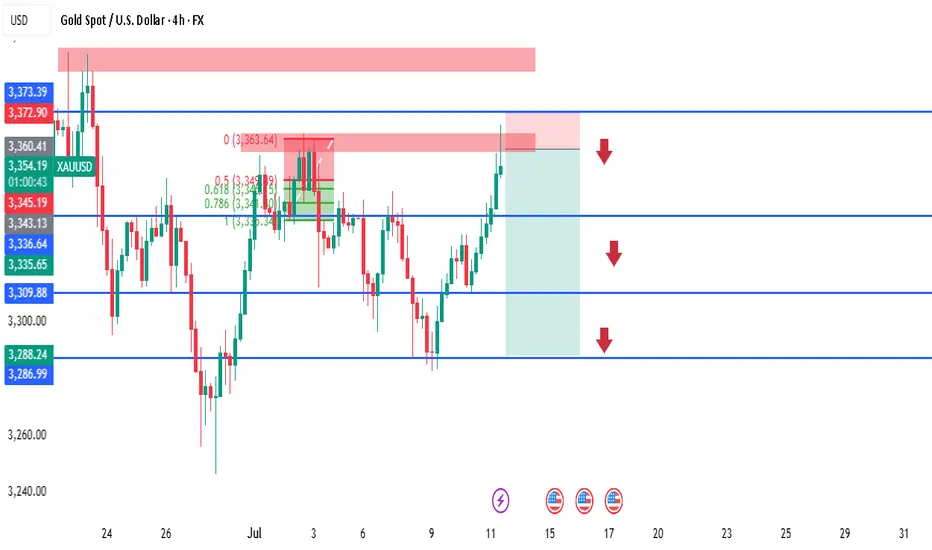
Gold just played an interesting game on the 4-hour chart!🚨 GOLD Technical Outlook – 4H Chart Insight! 🕵️♂️✨
📉 First, we spotted a Bearish Engulfing pattern that created a strong Sell Zone, signaling downward pressure. But guess what? The market wasn't ready to give up just yet…
📈 From the lower end, a powerful Bullish Engulfing stepped in like a hero, offering solid support and pushing the market back up!
Now here's where it gets exciting:
🔥 Gold has formed another bullish engulfing pattern, and the price is once again knocking on the door of that Sell Zone.
🤔 What's next?
A rejection from this sell zone could trigger another drop 📉
But keep an eye on the overlapping support zone below — if price revisits and holds there, we could see a bullish bounce toward the upside again! 🚀
📌 Key takeaway: We’re at a decision point. The next move could be explosive — up or down. Stay sharp! 🔍
⚠️ DYOR – Do Your Own Research! 🚫 This is not financial advice — just a trader's perspective.

BTC's increasing fomo force will push the price up furtherCRYPTO:BTCUSD just broke the important resistance zone and trendline around 110000. This price increase to create a new ATH will create a large amount of FOMO in the market pushing BTCUSD to increase more than half. 116,000 FIbonacci extension points are considered the immediate Target for the uptrend.
Waiting for retests to the support zone for the trend-following BUY strategy.
Support: 110000-107500
Resistance: 116000
Buy zone: 110000 ( support + trendline)
Buy Trigger: break above 112000
Leave your comments on the idea. I am happy to read your views.

Gold - This is the official top!Gold - TVC:GOLD - might top out soon:
(click chart above to see the in depth analysis👆🏻)
Since Gold confirmed its rounding bottom in 2019 it rallied more than +200%. Especially the recent push higher has been quite aggressive, squeezing all bears. But now Gold is somehow unable to create new all time highs, which could constitute the a top formation.
Levels to watch: $3.500, $3.000
Keep your long term vision🙏🙏
Philip (BasicTrading)

XAUUSD 4H SMC Analysis – Sell Opportunity Near Supply Zone Price is currently tapping into a 4H supply zone around 3353–3360, a strong area of previous sell-off and imbalance. We're expecting a potential reaction and rejection from this area, aligning with the following SMC confluences:
🔻 SMC Confluences:
Price swept short-term liquidity above previous highs (liquidity grab).
Price now tapping into a mitigation zone within premium pricing.
Bearish order block aligned around 3360.
FVG (Fair Value Gap) filled between 3345–3360.
Fibonacci 0.5–0.618 zone respected.
🎯 Sell Setup:
Entry: 3355–3360 (Confirmed reaction)
SL: Above 3373 zone (liquidity sweep buffer)
TP1: 3343 (short-term structure)
TP2: 3309 (previous support)
TP3: 3288 (strong 4H demand)
📌 Watch for M15–H1 bearish CHoCH (Change of Character) or BOS (Break of Structure) as confirmation before entry.
Precisely look at 3365 and pay attention to the pullback chanceAt present, gold has risen as expected and reached the highest level near 3368. The upper 3375-3385 constitutes a short-term resistance level. At present, the bullish momentum is still relatively strong, and the short-term support structure below has been formed. I still maintain the views of the previous transaction and wait for a second trading opportunity when it pulls back below. Although the 1H chart shows that the current trend remains strong and the retracement is small, it is necessary to remain cautious - even if the market is strong, it is not recommended to chase long easily, and the risk of a deep correction in the gold price must be guarded against. First, pay attention to the support area of 3345-3335 below. If it falls back to this level, you can consider going long with a light position.
OANDA:XAUUSD

The idea remains unchanged, NY3360-3365 is emptyThe idea remains unchanged during the NY period. Although gold has currently reached a high of around 3348, it has not stabilized above it. If gold successfully breaks through 3350 in the short term, it may reach 3360 or 3365. In the 4H cycle, it presents a step-by-step upward pattern. The K-line is temporarily fluctuating sideways near the upper track. At the same time, 3345 has formed a double top pattern. Combined with Thursday's low of 3310, an inverted triangle oscillation range of 3345-3310 is formed in the short term. This week's trend needs to pay close attention to the breakthrough direction of this range. Short-term long positions can be taken after the trend is confirmed.
XAUUSD@3330-3320 long TP 3345-3365
OANDA:XAUUSD
Breaking through 3350, the bullish trend remains unchanged📰 News information:
1. Pay attention to the impact of Trump administration tariffs
📈 Technical Analysis:
Possible interest rate cuts and tariffs in the fall continue to stimulate risk aversion. Currently, the 3300-3285-3310 points form a head and shoulders bottom pattern. The bullish momentum is relatively strong in the short term. Our short trade near 41 has hit the stop loss. As I wrote before, gold may continue to rise to 3360 or 3365 after breaking through 3350. The current RSI indicator is seriously oversold, so be cautious when operating in a unilateral trend in the short term. The safe way is to wait for a pullback to 3345-3340 to go long
🎯 Trading Points:
BUY 3345-3340
TP 3360-3370-3400
In addition to investment, life also includes poetry, distant places, and Allen. Facing the market is actually facing yourself, correcting your shortcomings, facing your mistakes, and exercising strict self-discipline. I share free trading strategies and analysis ideas every day for reference by brothers. I hope my analysis can help you.
TVC:GOLD FXOPEN:XAUUSD
Bulls rise, beware of Friday's black swan📰 News information:
1. Pay attention to the impact of Trump administration tariffs
📈 Technical Analysis:
Gold rose as expected and touched around 3344, which was in line with our judgment last night. However, from the market point of view, the K-line entity did not stand firmly above 3335. There are only two possible scenarios for the subsequent trend of gold. One is to stand directly above and test the 3345 resistance again, and the other is to fall in the European and American markets due to timeliness and retest the key support of 3310. At present, the upper positions are 3345 and 3365 respectively. If 3345 is repeatedly not broken and the European market falls with acceleration, then the 3310 area will still need to take back the long positions, which can be defined as a long wide-range wash. 3330-3320 is a very critical support position, and 3310 is a strong support. Therefore, the best position for shorting during the day is around 3335-3345, with the target at 3330-3320. Consider long positions after falling back and getting support here.
🎯 Trading Points:
SELL 3335-3345
TP 3330-3320
BUY 3330-3320
TP 3345-3365
In addition to investment, life also includes poetry, distant places, and Allen. Facing the market is actually facing yourself, correcting your shortcomings, facing your mistakes, and exercising strict self-discipline. I share free trading strategies and analysis ideas every day for reference by brothers. I hope my analysis can help you.
OANDA:XAUUSD PEPPERSTONE:XAUUSD FOREXCOM:XAUUSD FX:XAUUSD FXOPEN:XAUUSD TVC:GOLD
Gold Spot / U.S. Dollar (XAUUSD) 4-Hour Chart4-hour chart from OANDA shows the price movement of Gold Spot (XAUUSD) with a current value of $3,325.625, reflecting a $11.925 increase (+0.36%). The chart highlights key levels including a sell price of $3,325.290 and a buy price of $3,325.960, with a spread of 67 points. Technical analysis includes a resistance zone around $3,359.388 and a support zone near $3,317.966, with recent price action showing a potential upward trend from a low point. The chart spans from June to early August 2025.

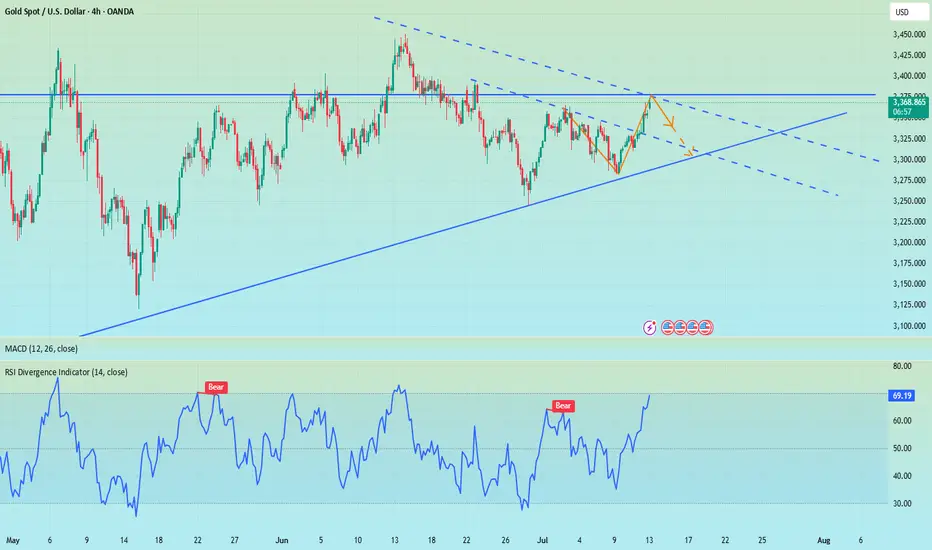
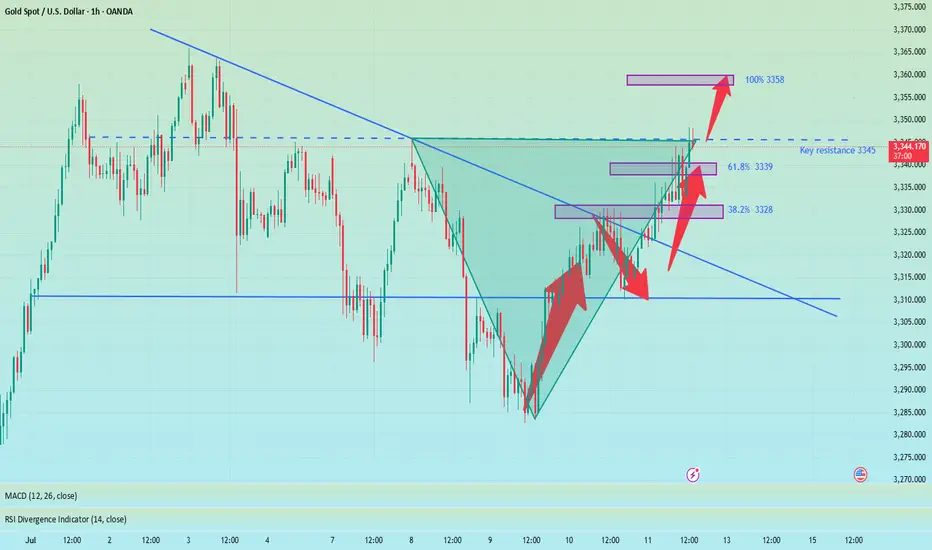
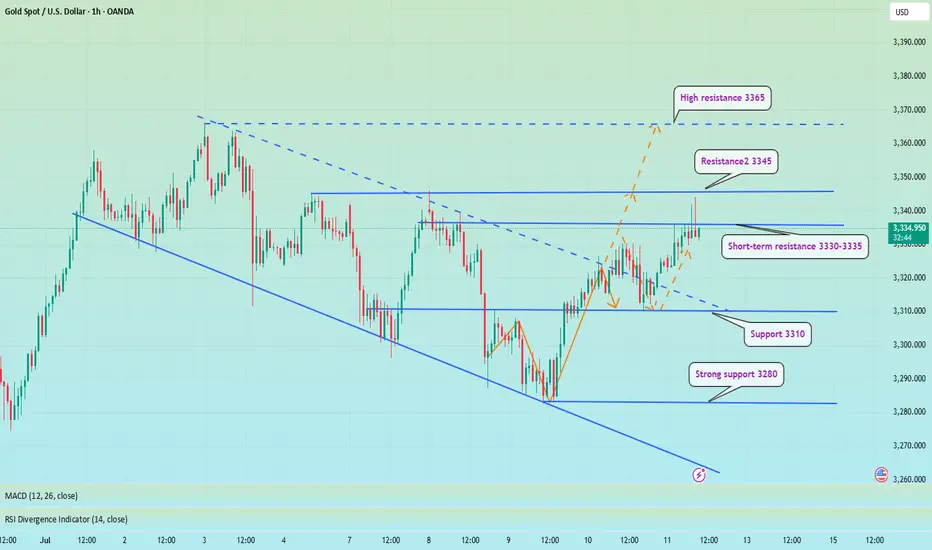
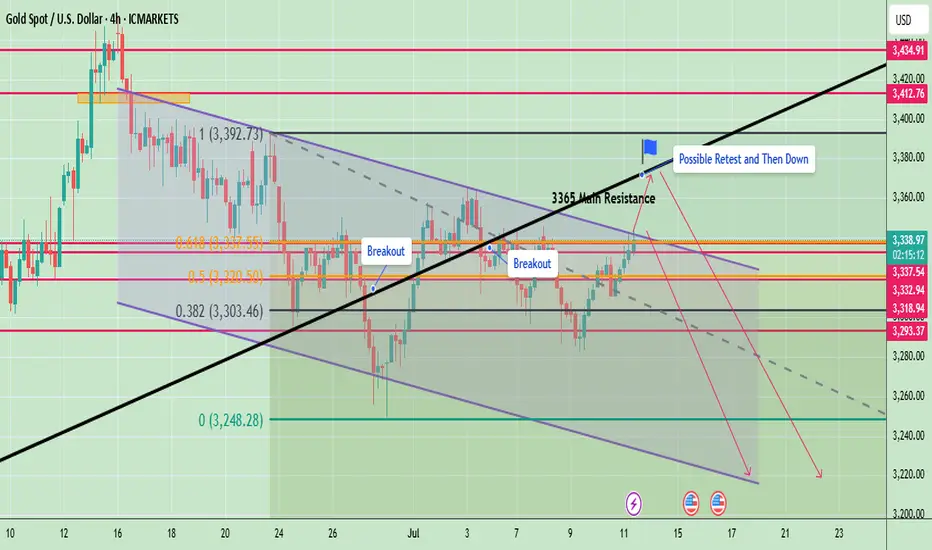
Gold Possible Retest of $3,365 Before Downside MoveGold is currently trading around $3,335, approaching a critical resistance level at $3,365, which has been marked as a “Main Resistance” on the chart. The recent price movement shows a strong bullish rebound from the $3,293–$3,300 support zone, breaking above two key trendlines labeled "Breakout."
The chart suggests a potential “retest” of the $3,365 resistance before another downward move, as marked by the annotation "Possible Retest and Then Down." This idea is reinforced by the broader descending channel pattern visible from late June, indicating that the larger structure still favors bearish continuation unless a strong breakout occurs above $3,365.
⚠️ Bearish Confluence
Price is inside a corrective channel, repeatedly failing to sustain above prior highs
$3,365 has held firm multiple times as resistance — a strong horizontal and trendline convergence zone
Price is still well below the swing high at $3,392
🟩 Bullish Scenario (If Invalidation Occurs)
If price breaks and closes above $3,365, it would invalidate the current bearish structure and open the door for upside targets like:
$3,392 (previous high)
$3,412
Possibly $3,434, which is a longer-term diagonal trendline resistance
At present, gold is in a corrective upward move within a broader bearish channel. The zone between $3,337–$3,365 will be key. A bearish rejection here would confirm downside continuation, with price potentially targeting $3,265–$3,220. However, a bullish breakout above $3,365 could invalidate the bearish view and suggest strength returning toward $3,392 and above.
Note
Please risk management in trading is a Key so use your money accordingly. If you like the idea then please like and boost. Thank you and Good Luck!
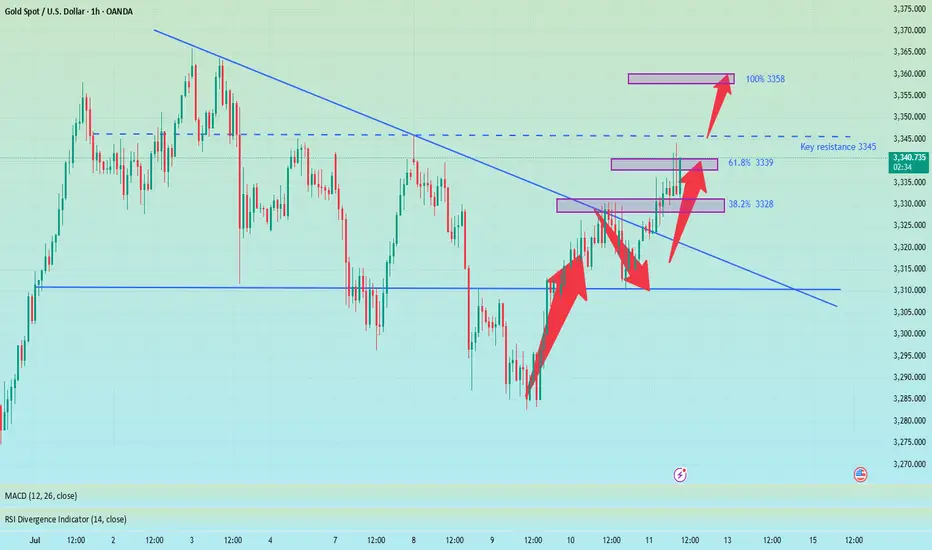
XAUUSD Approaches Key Resistance – Will 3,345 Hold or Break?As of July 11, 2025, gold (XAUUSD) is showing a mild recovery around 3,331 USD, following a rebound from the 3,318–3,322 USD support zone. This move comes amid a wave of macroeconomic data and global monetary policy expectations that continue to weigh heavily on gold’s intraday direction.
1. Key Fundamentals Impacting XAUUSD Today
Dollar Index (DXY) remains strong near 106.0 – sustaining pressure on gold due to a firm greenback.
U.S. 10-year Treasury yields are holding above 4.36%, reflecting persistent market expectations that the Fed may keep interest rates elevated in the near term.
June CPI data (YoY) came in at 2.4%, slightly below forecast (2.5%), increasing hopes for a potential rate cut in Q4 – a short-term bullish catalyst for gold
Geopolitical tensions remain subdued, limiting safe-haven inflows into gold in the medium term.
Upcoming U.S. PPI data this week could trigger volatility, depending on whether it surprises to the dovish or hawkish side.
2. Technical Analysis – XAUUSD on H4 Timeframe
Support zone: 3,316 – 3,322 USD, aligning with the 0.5–0.618 Fibonacci retracement of the latest bullish leg.
Resistance zone: 3,345 USD – a confluence of previous highs and 0.618 Fibonacci level of the prior correction wave.
EMA outlook: Short-term EMA is turning upward, indicating potential bullish momentum building.
RSI: Recovering toward 60 but not yet overbought – a sign of healthy upside potential, though confirmation is still needed.
3. Trade Scenarios to Consider
Bullish Breakout Scenario (if price breaks 3,345 USD):
Entry: Buy on H4 candle close above 3,345 USD
Target: 3,357 – 3,370 USD
Stop-loss: Below 3,322 USD
Bearish Rejection Scenario (if price fails at 3,345 USD):
Entry: Sell on bearish reversal candlestick (e.g., pin bar, engulfing) at 3,345 USD
Target: Revisit support at 3,318 – 3,309 USD
Stop-loss: Above 3,350 USD
Gold is trading in a decision zone between short-term support and a major resistance barrier. While macro fundamentals are slightly leaning bullish after soft CPI data, strong dollar strength and high bond yields still cap upside momentum. Traders are advised to wait for price confirmation at 3,345 USD before committing to directional setups.
Follow for more daily gold trading strategies, and save this analysis if you found it useful!

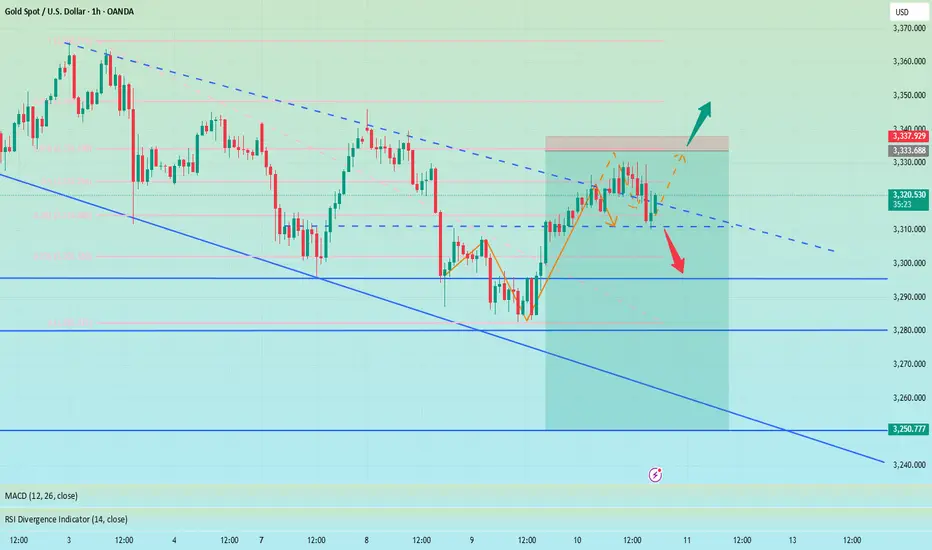
XAUUSD Rises Steadily After RetestXAUUSD Rises Steadily After Retest – Buy Zone Showing Strong Effectiveness
Technical Analysis – July 11, 2025 (H4 Timeframe)
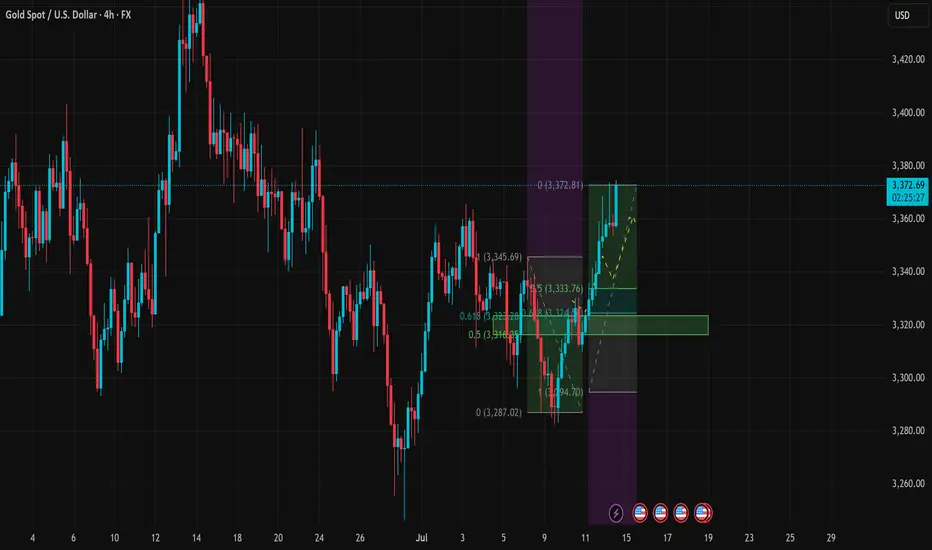
Gold (XAUUSD) is currently trading around $3,345, continuing its steady upward move from the key confluence support at $3,309–$3,318. The bullish momentum has strengthened following a clean break and successful retest of the previous bearish structure.
1. Updated Technical Data:
Current Price: $3,345.10
Fibonacci Retracement:
0.618 at $3,309.69
0.5 at $3,318.91
Recent Swing High (1.0 Fibo): $3,345.69
RSI (H4 Estimate): Around 62 – nearing overbought territory, but still has room for further upside
EMA20/EMA50: EMA20 has crossed above EMA50 – short-term trend is bullish
Next Resistance: $3,357.97 (previous swing high)
Immediate Support: $3,318–$3,309 (Fibonacci confluence zone)
2. Price Action Insight:
Following the correction low at $3,287.02, gold has shown strong recovery with a clear impulsive wave formation. The previous Buy Zone between $3,309–$3,318 has proved highly effective, leading to the current bullish breakout.
A classic “break–retest–continuation” pattern is forming on the H4 chart, suggesting that bulls remain in control unless disrupted by macro events.
3. Suggested Trading Strategies:
Primary Scenario: Buy on Dip
Entry Zone (on retest): $3,330 – $3,318
Stop Loss: Below $3,308
Take Profit 1: $3,345 (already reached)
Take Profit 2: $3,357
Extended Target: $3,368 – $3,372 if $3,357 breaks decisively
Alternative Scenario: Short from $3,357 if Reversal Signal Appears
Stop Loss: Above $3,362
Take Profit: Toward $3,330 – $3,318 support
4. Conclusion for Today:
Short-Term Trend: Bullish
Medium-Term Outlook: Neutral to bullish – watch $3,357 breakout for confirmation
Main Bias: Buy the dip and hold toward resistance at $3,357–$3,372
Follow for more real-time trading strategies and insights. Save this post if you find it helpful!

Gold fluctuates, consolidation in the 3330-3310 range📰 News information:
1. Waller meeting on interest rate cuts
2. Trump tariff issues
📈 Technical Analysis:
Waller will participate in the meeting in more than two hours and pay attention to whether there is any news of interest rate cut. The key is to operate around the 3330-3310 range. Continue to pay attention to the support of 3310-3305 at night. If gold falls below 3310,-3305 again, the downward trend will continue, and it is expected to touch 3280 again, or even 3250. If it rebounds above 3330, it is likely to continue to rise.
In addition to investment, life also includes poetry, distant places, and Allen. Facing the market is actually facing yourself, correcting your shortcomings, facing your mistakes, and exercising strict self-discipline. I share free trading strategies and analysis ideas every day for reference by brothers. I hope my analysis can help you.
TVC:GOLD FXOPEN:XAUUSD FX:XAUUSD FOREXCOM:XAUUSD PEPPERSTONE:XAUUSD OANDA:XAUUSD
Go long when the trend reverses, beware of black swansYesterday's pullback to 3313-3310 confirmed the upward trend of gold. As I expected, it broke through the resistance of 3330 and touched around 3345. Currently, the short-term strong resistance is at 3345. Only by breaking through this resistance can gold maintain its upward trend. If it is blocked near the 3345 line in the short term, there is a possibility of a pullback. If 3345 breaks, there will be 3365 and 3400 above. Once the direction is clear, it will be easier to act. If there is a pullback during the day, it will give us a trading opportunity to enter the long position.
OANDA:XAUUSD
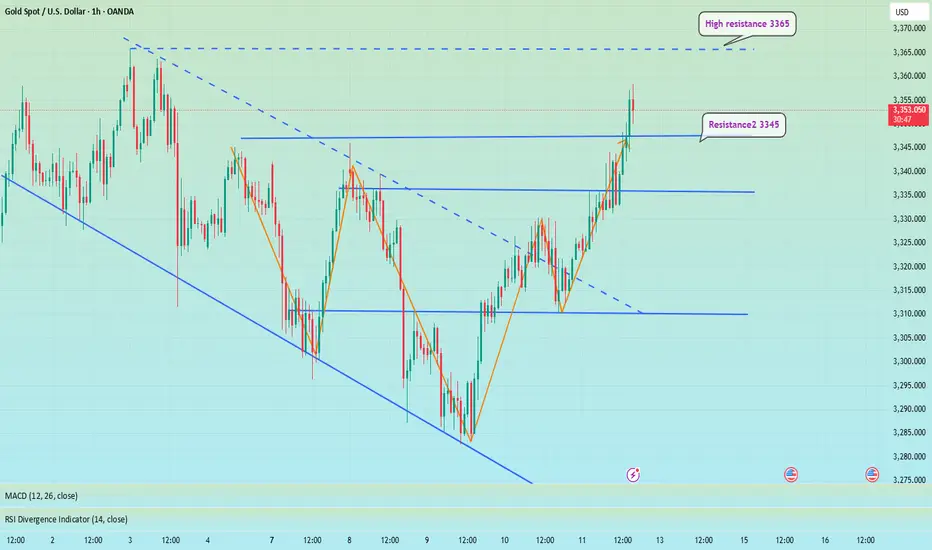
Gold Price Analysis July 11Gold price today continues to maintain a strong upward momentum after breaking the previous support trendline (gold wire). Currently, SELL orders should only be considered as short-term response transactions, with priority given to monitoring to join the main trend.
✅ Trend: Up has been confirmed, the nearest target is towards the 3390 area today.
🔑 Key Levels:
Support: 3330 – 3314
Resistance: 3345 – 3362 – 3388
🎯 Trading strategy:
SELL activation: Watch the 3345 area, only SELL when there is a price rejection signal with a confirmation of a decrease.
Potential SELL area: 3362 – 3387 (strong resistance).
BUY Activation: Look for buying opportunities at support 3330 – 3314 if there is a clear bullish reversal signal.
