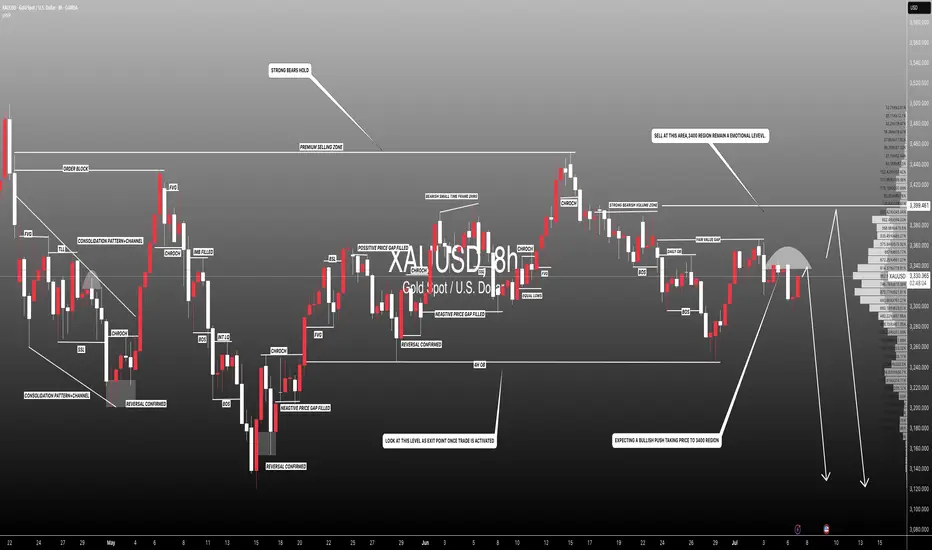
XAUUSD Analysis todayHello traders, this is a complete multiple timeframe analysis of this pair. We see could find significant trading opportunities as per analysis upon price action confirmation we may take this trade. Smash the like button if you find value in this analysis and drop a comment if you have any questions or let me know which pair to cover in my next analysis.
Xauusdshort

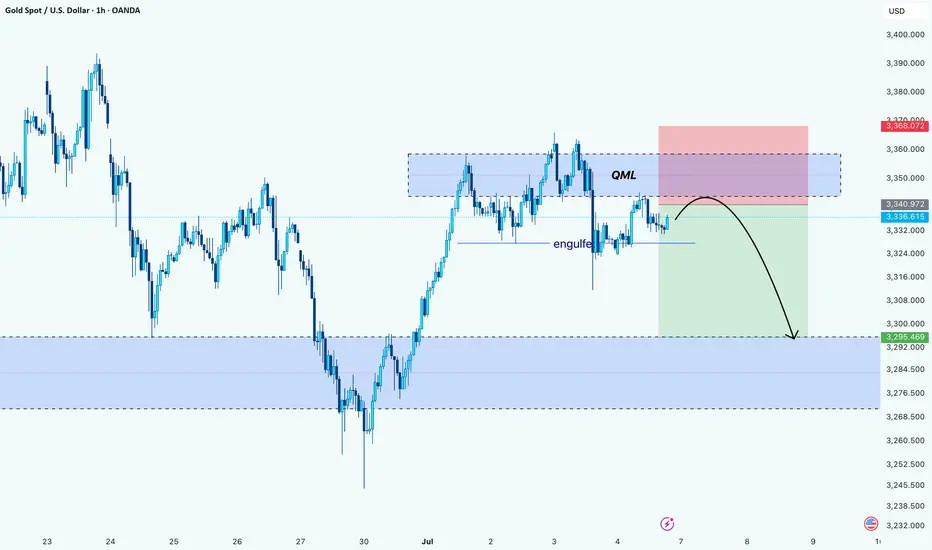
Gold’s Trap Above QML: Bearish Play UnfoldingHello Guys!
Gold appears to be forming a textbook Quasimodo reversal setup after printing a lower high into a key supply zone. Price aggressively tapped into the QML area (around 3,350–3,360), where sellers previously stepped in, and we’re now seeing signs of rejection.
The engulf zone marked earlier confirms bearish intent. It broke structure and flipped momentum. Price is currently retesting below that engulf level, likely as a last attempt to grab liquidity before heading down.
The projected move suggests a drop toward the next significant demand zone around 3,295–3,285, where the price previously found a strong bullish reaction.
Bias: Bearish below QML
Target: 3,295 zone
Invalidation: Above 3,368 (high of supply zone)
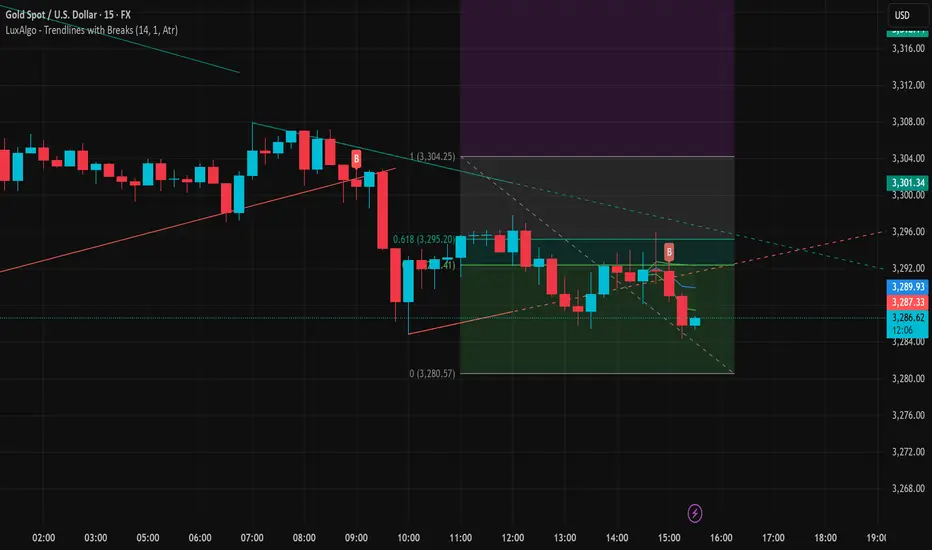
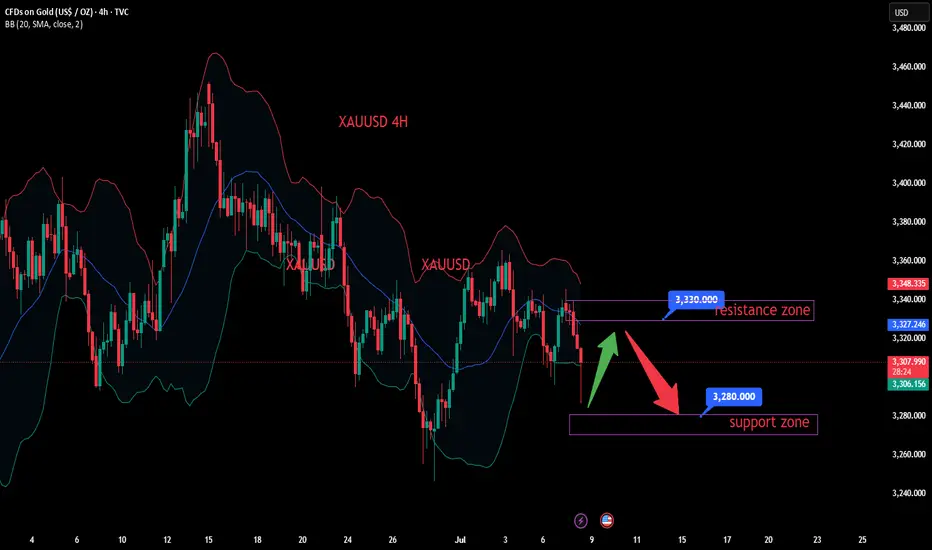
XAUUSD Loses Short-Term Support – Deeper Decline May FollowGold (XAUUSD) is showing clear signs of short-term weakness after losing a key support zone around 3,287 USD – which previously aligned with the rising trendline and the 61.8% Fibonacci retracement level (3,295.20 USD) of the prior downward move.
1. Price Structure and Current Pattern:
Price has formed a descending triangle and just broke below its lower boundary with strong bearish candles.
Consecutive bearish candles with short lower wicks indicate strong selling pressure with little buying interest.
After being rejected at 3,304.25 USD – the most recent swing high – price has dropped toward the 0.0% Fibonacci level at 3,280.57 USD.
2. Fibonacci and Key Price Zones:
The 3,295.20 area (Fibo 0.618) has now become a strong resistance after a failed recovery attempt.
The 3,280 – 3,275 zone is the next target for bears if no strong reversal appears in upcoming sessions.
A break below 3,275.73 may open the path for further downside toward 3,268 – 3,260.
3. Trendlines and Candle Behavior:
The short-term rising trendline (in red) has been broken alongside increasing sell volume.
The upper descending trendline (in light blue) remains intact, confirming that the overall structure is still bearish.
Suggested Trading Strategy:
Sell on rallies: Prefer short entries around 3,290 – 3,293, with a stop loss above 3,296.
Short-term target: Look for potential take-profit zones at 3,275 – 3,268.
Avoid bottom fishing unless there’s a strong bullish reversal signal such as an engulfing or hammer candle backed by volume.
Conclusion:
Gold is under visible downside pressure below key technical resistance. If the price fails to hold above 3,280, the downtrend could extend further. Traders should remain cautious of weak pullbacks and look to enter in line with the dominant bearish trend.
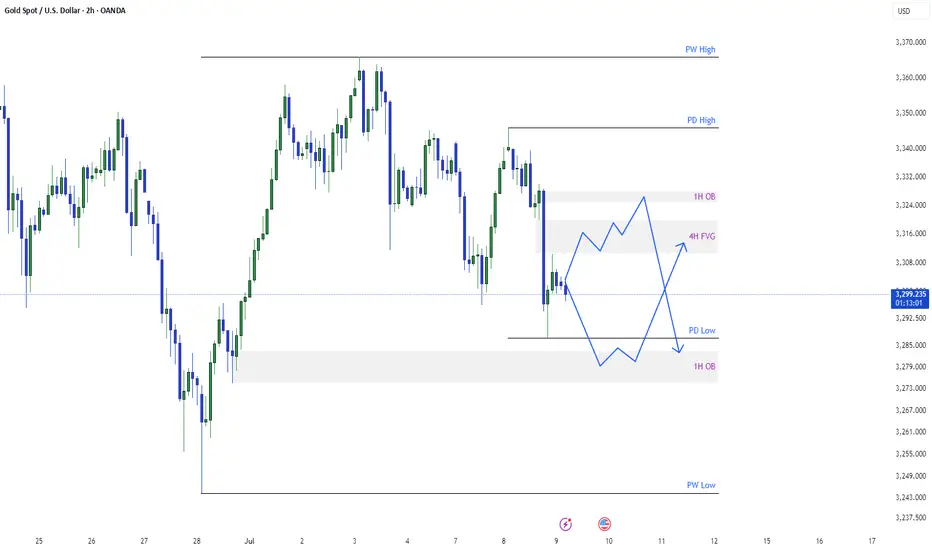
Gold Wants to Go lowerSee my previous analysis for gold I described I will take the low and has taken already. now the daily candle shown good sell. today there are two possibilities. Either gold will have pullback or will go further in sell. I have given both possibilities in my analysis.
For Pull Back: It may take the previous day low and then retraces back to 4 hour FVG or to the order block residing at 3324.
For Further sell : It may pull back to 4 hour FVG and then goes back to take previous day low.
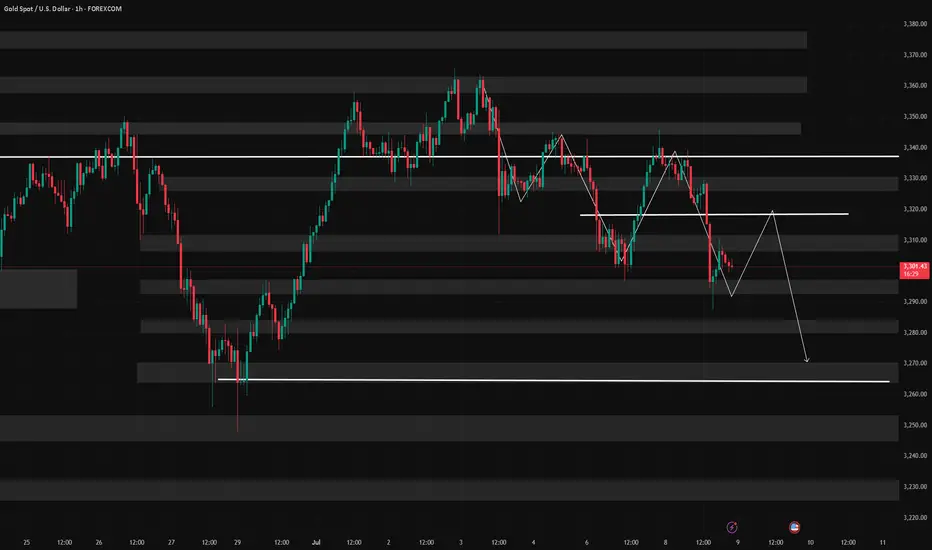
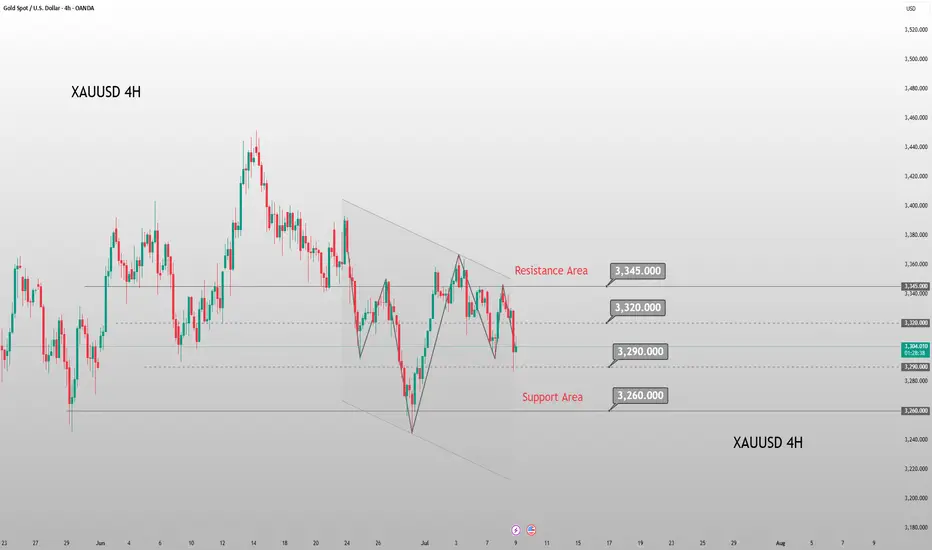
Gold will continue to fall today.Gold continued to fall in the US market after hitting a high on Tuesday and hit a recent low. Currently, there is a fierce competition between long and short positions. The repeated swings in the US tariff policy have caused fluctuations in risk aversion sentiment, and the probability that the Federal Reserve will maintain interest rates above 95% in July has supported the US dollar. Technically, we need to focus on the key support of 3260 and the strong resistance range of 3320 above. The hourly chart shows that the short-term moving average diverges downward, and the K-line is under pressure, showing short-term fatigue, suggesting that there is still a need for a correction today.
Thank you for your likes and support!
I will continue to share my views.
I wish you a smooth trading!

7/9: Failure to Break Above 3321 May Lead to a Drop Toward 3220Good morning, everyone!
Yesterday, gold tested support and attempted a rebound but failed to break through resistance, followed by a second leg down that broke the support zone, invalidating the potential inverse head-and-shoulders pattern and resulting in a drop below the 3300 level.
On the daily (1D) chart, price has now broken below the MA60, signaling a further confirmation of the bearish structure.
However, due to the sharp drop, a double bottom or multi-bottom structure is forming on the 30-minute chart, which may be building momentum for a potential test of the 3321 resistance zone.
📌 Key focus areas:
If 3321 is broken and held, there is room for a short-term rebound to extend;
If 3321 holds as resistance, the current rebound is likely a short-selling opportunity.
Technically speaking, without the support of bullish news, if gold fails to reclaim and sustain above 3321, there is a strong chance of a further move lower—potentially down to 3220, where the weekly MA20 is located. A deeper decline could even test the 3200–3168 support zone.
📉 Therefore, the primary trading bias remains bearish, with sell-on-rebound as the preferred strategy until a stronger bullish signal emerges. Monitor the 3321 zone closely for direction confirmation.
XAU/USD Analysis – Expecting Fibonacci Retracement to 0.618 I’m currently anticipating a short-term retracement in XAU/USD towards the 0.618 Fibonacci level around 3323, followed by a continuation of the bearish move targeting a Fair Value Gap (FVG) around 3272.
📌 Technical Confluence:
The market has recently shown a strong bearish impulse, and the current price action appears to be forming a corrective retracement.
The 0.618 retracement level aligns with a key resistance area around 3323, increasing the probability of a bearish reaction from this zone.
There’s a visible FVG left unfilled near 3272, which may act as a price magnet.
I’m also watching for a liquidity sweep above local highs, followed by bearish confirmation on the lower timeframes (e.g., 5min) to trigger a short entry.
📉 Trade Idea:
Looking for a sell entry near 3323 after confirmation (liquidity grab, bearish structure shift, etc.)
Target: 3272 FVG zone
Stop Loss: Just above recent highs or liquidity zone, depending on intraday structure

Wednesday's Gold Trend Analysis and Trading RecommendationsGold surged on Tuesday but then kept pulling back during the U.S. session, hitting a recent new low, with intense seesawing between bulls and bears currently. The fluctuating U.S. tariff policies have triggered volatility in risk-averse sentiment, while the over 95% probability that the Federal Reserve will keep interest rates unchanged in July has provided support to the U.S. dollar.
Technically, focus should be on the key support level around 3260 and the strong resistance range of 3320 above. The hourly chart shows short-term moving averages diverging downward, with candlesticks under pressure and showing short-term weakness, suggesting there is still a need for a pullback tomorrow. The current bull-bear watershed lies at the 3390 mark; if gold fails to break through and stabilize above 3315 effectively, any short-term rebound can be seen as a good opportunity to enter short positions.
The 4-hour chart indicates that gold found support near 3287 and slowly recovered losses, but it remains trapped in a consolidation pattern recently. Although the 3287 support is effective, the consolidation range has not been broken. The future direction depends on the actual defensive strength of the 3260 support level and the direction of the range breakout.
For Wednesday's trading, the main strategy is to go short on rebounds. Focus on the resistance zone of 3315-3320, where short positions can be established. The downside targets are 3270 and the key support level of 3260 in sequence. If 3260 is broken through effectively, it may open up more downward space.
XAUUSD
sell@3315-3320
tp:3300-3280-3260
Investment itself is not the source of risk; it is only when investment behavior escapes rational control that risks lie in wait. In the trading process, always bear in mind that restraining impulsiveness is the primary criterion for success. I share trading signals daily, and all signals have been accurate without error for a full month. Regardless of your past profits or losses, with my assistance, you have the hope to achieve a breakthrough in your investment.
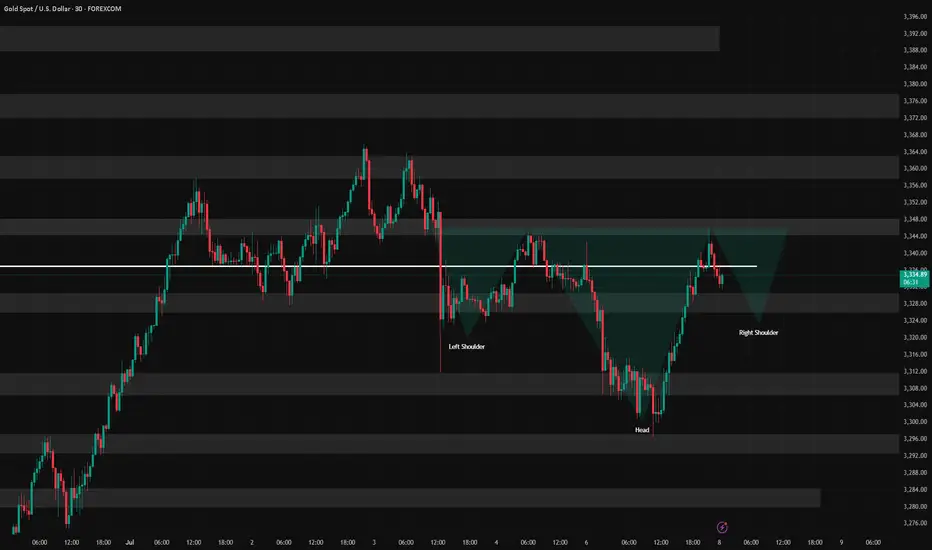
7/8: Inverse Head and Shoulders Pattern, Support at 3321–3312Good morning, everyone!
Yesterday, gold broke below the 3321 support during the session, dropped to around 3296, then staged a strong rebound back toward the opening price—forming a classic deep V-shaped reversal and regaining support above the MA60 on the daily chart.
The market remains in a consolidation phase between the MA20 and MA60 on the 1D chart, with no clear directional breakout yet.
On the 30-minute chart, the previous head-and-shoulders top pattern has been completed with the recent decline. The current structure can be tentatively viewed as the formation of a head-and-shoulders bottom.
If this bullish reversal pattern holds:
The 3321 level must act as valid support during any pullback; deeper confirmation may come from 3312, which corresponds to the previous left shoulder low. Although this was partially driven by a data-related spike, most candle bodies remained around 3321—so 3321 is the primary support, and 3312 is the backup.
If confirmed, the price may advance toward the 3360 target zone.
If the pattern fails, watch for the development of a double bottom formation, with MA60 on the daily chart remaining a key support level.
📌 For today, focus on trading within the 3312–3352 range, using a buy-low/sell-high approach, and stay flexible in response to evolving chart patterns.
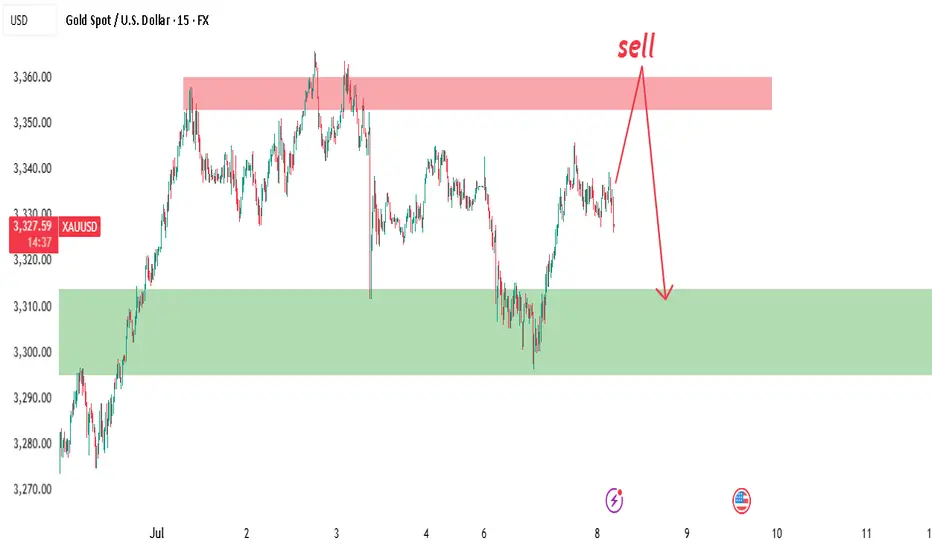
XAUUSD 15M Smart Money Sell SetupGold is showing classic Smart Money Concepts (SMC) behavior with liquidity engineering and premium mitigation.
🧠 SMC Breakdown:
Price swept buy-side liquidity above 3,355 and failed to close above the zone.
Supply zone (red) at 3,350–3,360 was previously unmitigated and now tapped.
Clean mitigation candle formed inside the supply with a sharp rejection.
Sell pressure expected from institutions looking to fill short positions after engineered liquidity.
📌 Sell Idea:
We anticipate a bearish reaction from the 3,350–3,360 zone down to the demand area.
🎯 Trade Plan:
📍 Entry Zone: 3,350–3,360 (inside red supply zone)
🛑 SL: 3,365 (above the liquidity wick)
✅ TP: 3,300 zone (green demand block)
📊 Why This Trade?
Structure is bearish from higher timeframes.
This is a sell in premium after liquidity sweep.
Imbalance left behind during the move up still unfilled.
Expecting internal CHoCH on M1/M5 to confirm entry.
🧲 Liquidity Map:
Engineered highs above 3,355 swept.
Clean equal lows sitting at 3,300 – perfect magnet for price.
⚠️ Note: Patience is key. Let price come into your zone and show a reaction before entering.
#XAUUSD #SmartMoneyConcepts #SupplyAndDemand #GoldSellSetup #SMC #TradingView #InstitutionalTrading #LiquiditySweep #PriceAction #Forex
XAUUSD:Sharing of the Latest Trading StrategyAll the trading signals this week have resulted in profits!!! Check it!!!👉👉👉
Gold Market Analysis:
Overnight Dynamics: Following Trump’s reinstatement of tariffs, gold’s safe-haven demand drove another rally, but it still pulled back after facing pressure at the 3345 level. The decline extended today, requiring attention to the sustainability of safe-haven flows—recently, safe-haven-driven rallies have often been followed by pullbacks, so caution remains warranted for further gold corrections.
Technical Trends:
On the daily chart, gold continues to trade in a narrow range, with short-term moving averages essentially converging and flattening, suggesting a high probability of continued sideways movement in the near term.
The current range is temporarily compressed between 3285–3345, with the market bias leaning toward a "range-bound bearish" trend.
Trading Bias: Maintain a bearish stance on rebounds!
Trading Strategy:
Sell@3330-3320
TP:3300-3280
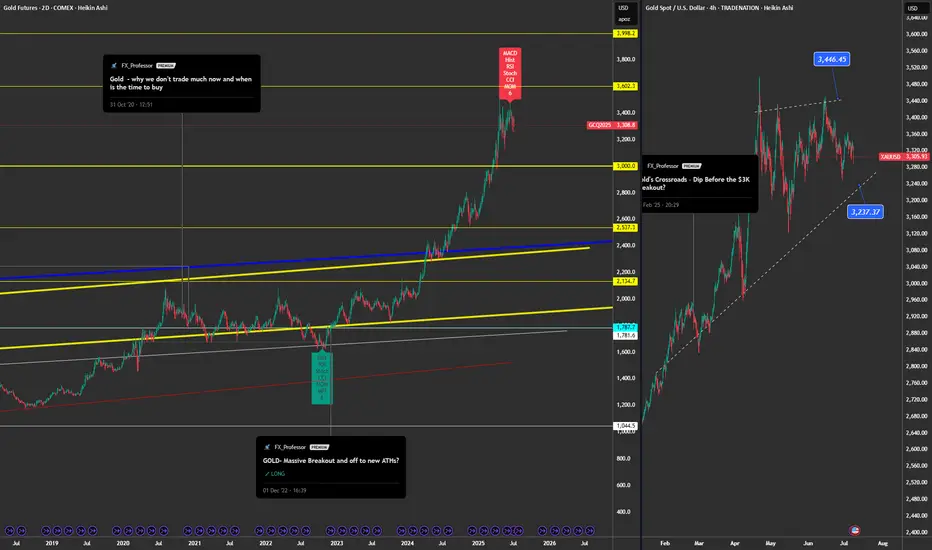
Goldman Says $4K – My Chart Says Sell💥📉 Gold Analysis – Divergences, Resistance, and a Short Bias 🪙⚠️
Hey Traders,
As promised in the latest video, here's the official chart update for Gold – and the message is clear: I'm short.
📊 What I See on the Chart
We're now well below the 3,446 resistance, with early signs of weakness showing up across multiple timeframes. I’ve laid out both the 2-Day and 4H charts in this post, and here’s what I’m tracking:
⚠️ Technical Warning Signs:
🔻 2D chart: Six bearish divergences
– RSI, Stochastic, CCI, OBV, MFI, and MACD all flashing red
📉 1D chart: Same thing — six divergences, telling me momentum is fading
⏳ 4H chart: Price action breaking trendlines, and support at 3,237 looks shaky
🚨 If that breaks, my main support zone is at $3,000 – and that’s where I believe we’re heading.
This is not just a pullback. This is the kind of confluence you can’t ignore if you trade technically.
🔁 Sentiment Shift
Back in December '22 and again earlier this year, I was long Gold – and it was the right call. But now?
📌 This chart has gone from momentum to exhaustion.
📌 I see less demand, softer momentum, and strong bearish divergence stacking across every major timeframe I watch.
🎯 Trade View
✅ I’m short Gold.
🎯 Targeting the $3,000–3,050 zone.
📉 Invalidated if we reclaim and close above $3,446 with strength.
It’s that simple. Nothing personal – just structure, divergence, and flow.
🧠 The Chart vs. The Narrative
Recently, I saw a note from Goldman Sachs forecasting $4,000 Gold. Maybe they’re right.
But I’ll be honest with you – I don’t buy the media hype.
I'm not here for the headlines.
I'm a chart guy. Always have been. Always will be.
The chart is the map to the treasure – and that’s the only thing I follow.
🧠 I cover this and the broader macro setup (Dollar, BTC, DAX, Tech, BTC.D, and more) in the full 20-min video just dropped. If you haven’t watched it yet, go catch up — it explains the logic and why this isn’t just a gold story.
One Love,
The FXPROFESSOR 💙
Disclosure: I am happy to be part of the Trade Nation's Influencer program and receive a monthly fee for using their TradingView charts in my analysis. Awesome broker, where the trader really comes first! 🌟🤝📈
Short-term gold bulls and bears are anxious,3330 becomes the keyAt present, the market has been fluctuating narrowly in the range of 3330-3320, and both bulls and bears are in a stalemate. However, gold has formed a double-layer head and shoulders bottom pattern, so the short-term bullish trend is definitely unchanged. In the previous post, I also mentioned that if the rebound in the European session is weak and gold continues to be below 3345, then the short-term NY session may usher in a retracement and a second bottom. Therefore, I still hold a long order of 3325-3315, and temporarily modify the TP to the 3335 line. I expect that there may be a retracement here, but there may also be a direct retracement. No matter what the situation is, we need to stabilize before entering the market.
In addition to investment, life also includes poetry, distant places, and Allen. Facing the market is actually facing yourself, correcting your shortcomings, facing your mistakes, and exercising strict self-discipline. I share free trading strategies and analysis ideas every day for reference by brothers. I hope my analysis can help you.
PEPPERSTONE:XAUUSD FOREXCOM:XAUUSD FX:XAUUSD FXOPEN:XAUUSD OANDA:XAUUSD TVC:GOLD
How to solve the problem of order being trapped in a loop📊 Gold Day Trading Strategy (Recommendation index ⭐️⭐️⭐️⭐️⭐️)
📰 News information:
1. The lasting impact of new tariffs
2. The impact of geopolitical conflicts
3. The Fed’s interest rate cut
📈 Technical Analysis:
The recent market conditions have been volatile. Many brothers have reported that they have been trapped recently. They have just been released from short positions, but have fallen into the situation of being trapped by long orders again. I have also encountered such a situation recently. Brothers who follow me must know that I have been trapped, but in the process of being trapped, I still share my trading ideas for the brothers who are trapped to check, so that we can all get out of the trap.
Gold fell as expected and hit the lowest point of 3287 before rebounding. The current 3300-3290 range given at the bottom has certain support. At present, I have answered it. As long as it does not fall below 3285, we can still go long and look for rebound correction. TP can temporarily look at 3305-3310. At present, the short-term upper watershed is near the 3321 line. As time goes by, the medium-term point can be seen at 3345. Only when the price stands above 3345 can the upward momentum continue to touch the 3380 line, or even 3400. In the short term, you can go long if you look at the support below. In the short term, pay attention to the resistance above 3315-3320. If it encounters resistance under pressure, it will fall back. On the contrary, after breaking through the first level of resistance, the upward trend will continue.
🎯 Trading Points:
BUY 3300-3290-3285
TP 3305-3315-3320-3345
SELL 3315-3321
TP 3300-3290
In addition to investment, life also includes poetry, distant places, and Allen. Facing the market is actually facing yourself, correcting your shortcomings, facing your mistakes, and exercising strict self-discipline. I share free trading strategies and analysis ideas every day for reference by brothers. I hope my analysis can help you.
TVC:GOLD OANDA:XAUUSD FXOPEN:XAUUSD FX:XAUUSD FOREXCOM:XAUUSD PEPPERSTONE:XAUUSD

XAUUSD Short / Sell Setupwait for the entry and place tp & SL, must use SL, never exceed more than 2% on SL of your portfolio on any trade. If tp is achieved first then trade setup will be invalid.
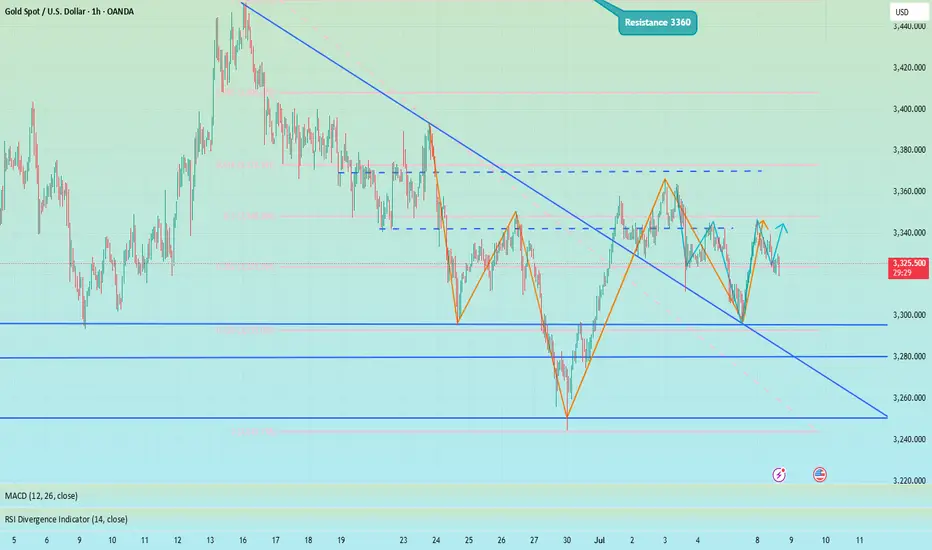
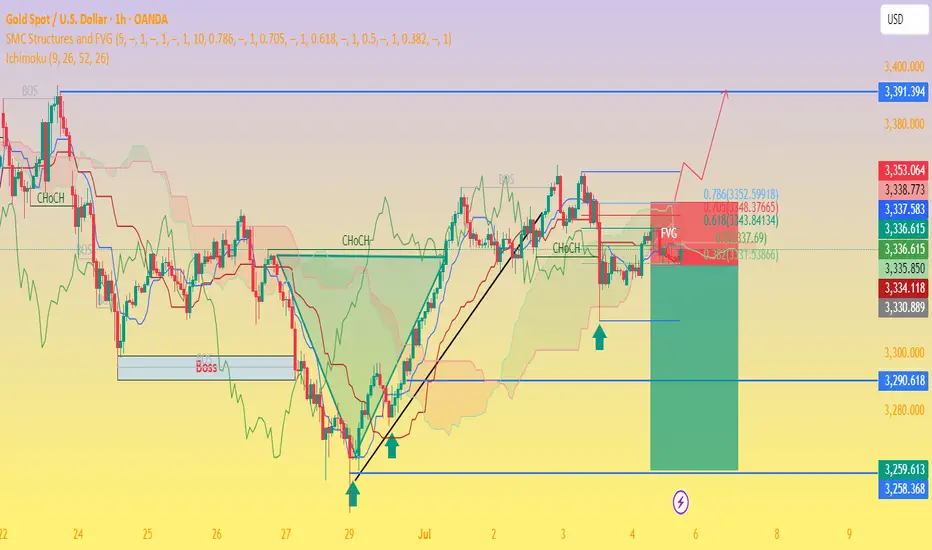
Gold Price Setup: Bullish Continuation or Rejection? 🧠 Chart Analysis (XAU/USD – 1H):
Key Structure Highlights:
CHoCH (Change of Character) zones marked both up and down indicate a battle between bulls and bears.
Recent bullish CHoCH followed by a fair value gap (FVG) retest suggests potential continuation to the upside.
Price recently bounced strongly from demand zone, shown by the green arrows and strong candle reaction.
Ichimoku Cloud:
Price is trying to break back above the Kumo (cloud), a sign of bullish momentum building.
However, resistance is still present with the Kijun and Tenkan lines converging.
FVG (Fair Value Gap):
The current price is attempting to fill and break above the FVG zone.
A successful breakout above this area confirms bullish intention.
Fibonacci Levels:
Price is hovering around the 0.5 - 0.618 retracement zone, often a strong reversal or continuation point.
Upside targets lie near the 0.786 retracement (3352) and ultimate target at 3391, a major resistance level.
Risk Management:
Trade setup shows an excellent Risk:Reward ratio.
Stop-loss placed just below the last structure low.
Potential downside to 3290–3258 if breakout fails.
🟢 Possible Next Move:
Bullish Scenario: If price clears the FVG and breaks above 3353, expect continuation to 3391.
Bearish Rejection: If rejected at FVG/0.618 level, watch for a drop back to 3290 or even 3259.
Gold is bullish and needs more momentum at 3320The buying pressure in the US session pushed the price up and formed a bullish hammer candle on D1. Today's bearish recovery is seen as a buying opportunity to head towards the uptrend again.
3344 is the immediate resistance zone in the European session that Gold faces. Breaking this resistance zone will head towards 3365. According to the wave structure, it would be great to have a retest of 3320 to find some buying momentum and then break 3344.
SUPPORT: 3320-3297
RESISTANCE: 3345-3352-3365
SELL Trigger: Break 3320 ( Trendline & break zone)
Do you have any comments on the trading plan? I would love to hear your views.

Setupsfx_ | XAUUSD(Gold):07/07/2025 Update | Gold dropped nicely when the market opened last night, dropping around 600 pips. However, it couldn’t hold on to the gains and came right back to the selling zone. There are two entry points and two potential targets.
Good luck and trade safely!
Team Setupsfx_
GOLD ON BUY FROM 3316#XAUUSD price we expect drop till 3316 for bullish range to form.
Buy limit 3316-3315.5, target 3330, stop loss 3310.
Below 3306 holds bearish continuation, target 3290-3280.
Bullish range can form above 3330 on 2 times breakout, target 3345
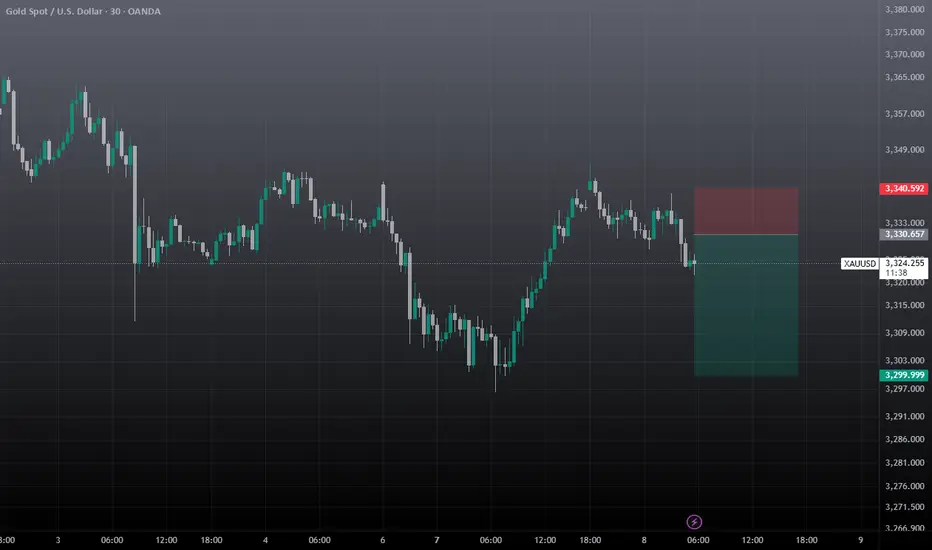
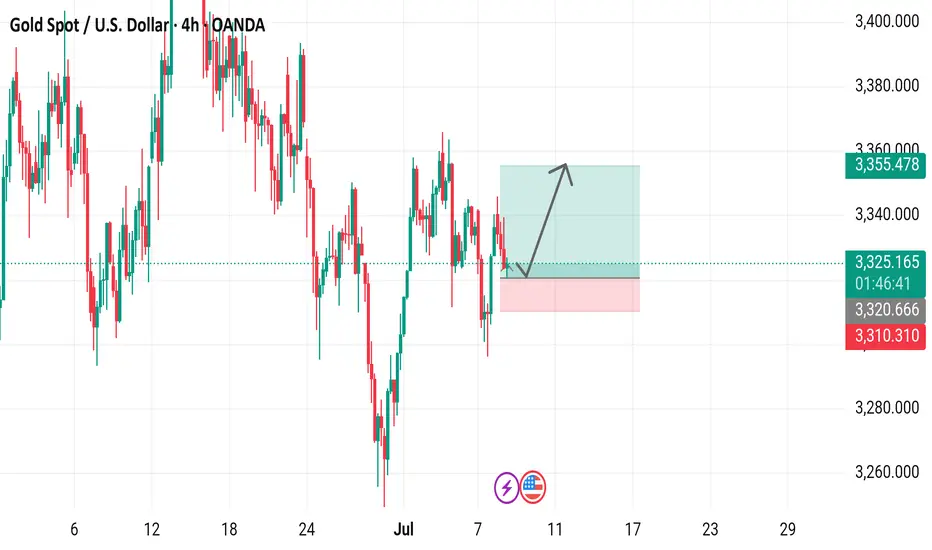
Gold Spot / U.S. Dollar (XAU/USD) 4-Hour Chart4-hour chart from OANDA displays the recent price movement of Gold Spot (XAU/USD) against the U.S. Dollar. The current price is $3,325.120, reflecting a decrease of $11.320 (-0.34%). The chart highlights a recent upward trend with a buy signal at $3,325.410 and a sell signal at $3,324.830, indicating a potential trading range. A shaded area suggests a possible price target or support/resistance zone around $3,355.478, with historical price levels marked on the right side. The timeframe covers the period around July 7-8, 2025.
XAUUSD Trading Strategy – July 8, 2025Gold (XAUUSD) is trading around 3,331 USD as global markets react to a series of critical economic data releases. The recent rally has brought prices back to a key resistance zone, but selling pressure remains strong due to the following factors:
- The Dollar Index (DXY) TVC:DXY holds steady near 97, its highest level in five weeks. A strong USD continues to weigh on gold, a non-yielding asset.
- U.S. 10-year Treasury yields remain stable at 4.35%, reinforcing expectations that the Federal Reserve will maintain higher interest rates for longer to tame inflation.
- Robust U.S. labor market data and June’s Core PCE figures staying above the Fed’s 2% target further reduce the likelihood of a rate cut in Q3 or Q4.
- Geopolitical tensions remain muted, with no significant escalations in the Russia–Ukraine conflict or Middle East unrest, weakening gold’s safe-haven appeal.
➡ Collectively, these factors suggest that gold’s recent rebound could be a technical pullback within a broader downtrend, unless a new catalyst drives a breakout.
1. XAUUSD Technical Analysis – Daily Chart (D1)
Price is currently testing the 3,331 – 3,340 USD resistance zone, which includes:
A previous supply zone that has rejected multiple rallies.
- Fibonacci retracement 0.5–0.618 from the recent high at 3,405 USD.
- A key Change of Character (CHoCH) area, where trend reversals have previously occurred.
- EMA20 and EMA50 remain aligned downward, confirming the dominant bearish trend.
- RSI hovers around 50 with signs of mild bearish divergence, reflecting weakening bullish momentum.
➡ The current price action fits a classic “sell on rally” setup, with repeated rejections at technical resistance zones.
2. Key Price Levels to Watch
Technical Significance
- 3,340 – 3,331 Confluence resistance (Fibo 0.5–0.618 + supply + CHoCH)
- 3,310 – 3,300 Nearest support – role reversal zone
- 3,275 – 3,260 Short-term target support – June’s low
- 3,223 – 3,205 Strong medium-term support – April’s low + extended Fibo
3. Suggested XAUUSD OANDA:XAUUSD Trading Strategy
Primary Strategy: SELL if price rejects 3,340 – 3,345
Entry: 3,340 – 3,345
Stop Loss: 3,356
Take Profit 1: 3,335
Take Profit 2: 3,330
Take Profit 3: 3,325
Ps : Gold is trading at a critical price zone. If XAUUSD fails to break above the 3,340 USD resistance, there’s a high probability of a pullback toward the lower support levels. Selling at resistance and targeting support remains the preferred approach in the current macro environment, which continues to favor bearish momentum.
This strategy will be updated regularly – save it and follow to avoid missing upcoming opportunities.
Analysis by @Henrybillion
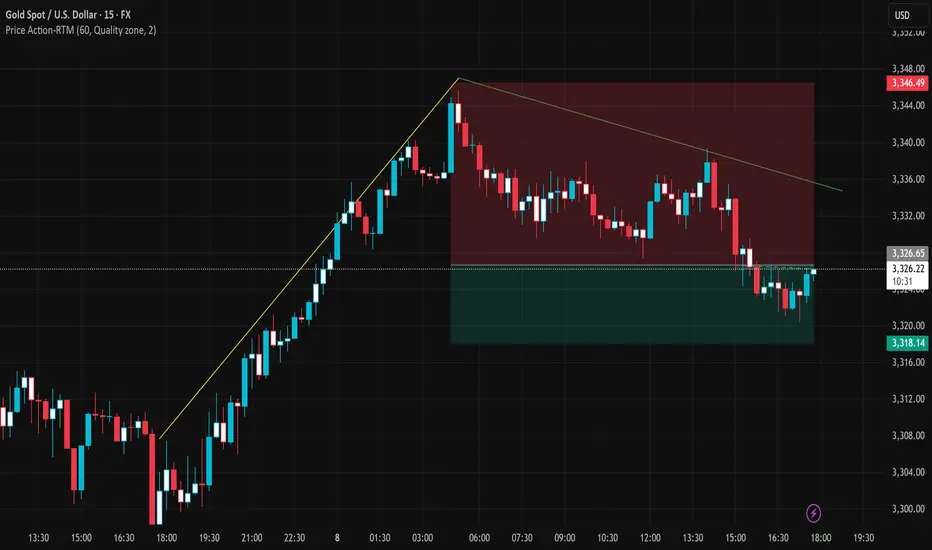
XAUUSD Short-Term Correction From the Top ZoneOn the 15-minute chart, XAUUSD showed a strong upward momentum starting below the 3,300 USD mark, reaching a peak near 3,346 USD. This rally was supported by a clear bullish structure and an ascending trendline.
However, once the price hit resistance at the top, selling pressure intensified, pushing the price into a downward correction. A clear pullback zone has formed between 3,346 USD and the support area around 3,318 USD — currently acting as a buy-side liquidity pocket.
Crucially, the price broke below the previous uptrend line and is now being capped by a descending resistance trendline, indicating a short-term bearish bias. Multiple failed attempts to break above the 3,332 – 3,335 USD area confirm that sellers still have the upper hand.
Additionally, the price action within this correction zone hints at a potential distribution pattern. Without strong buying interest to reclaim the 3,335 USD level, further downside remains possible.
Suggested Trading Strategy:
In the short term, traders may consider a “Sell on Rally” approach if price continues to fail at the 3,332 – 3,335 USD resistance zone.
Conversely, if a clear breakout occurs above the descending trendline and especially above the 3,336 – 3,338 USD area, the bullish trend may resume.
Conclusion:
XAUUSD is undergoing a technical pullback after a sharp rise. The market is currently in a tug-of-war between profit-taking pressure and recovery attempts. How price reacts at the current resistance will determine the next key move.
XAUUSD Analysis todayHello traders, this is a complete multiple timeframe analysis of this pair. We see could find significant trading opportunities as per analysis upon price action confirmation we may take this trade. Smash the like button if you find value in this analysis and drop a comment if you have any questions or let me know which pair to cover in my next analysis.
