Gold (XAUUSD): Potential Short from Bearish OPotential Short Opportunity After Reaction at OB-
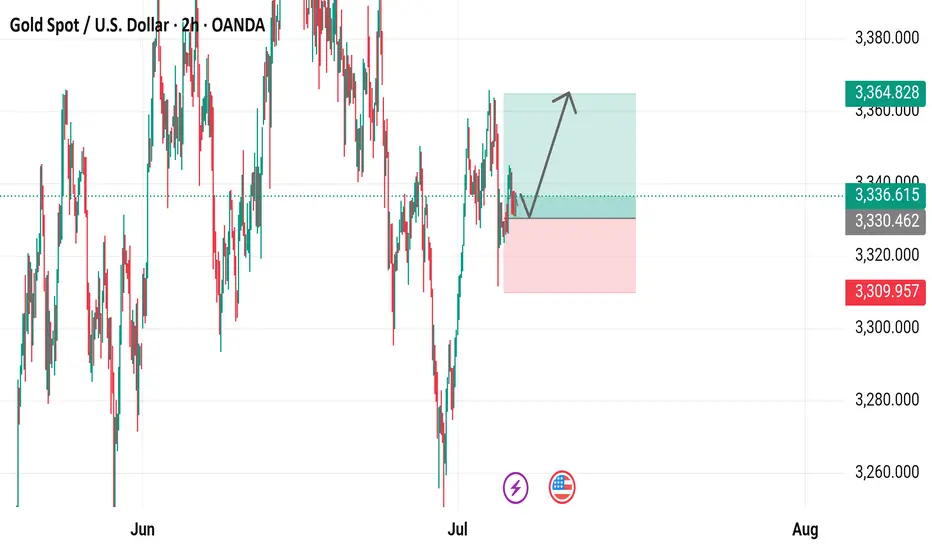
The chart shows a potential short setup on Gold Spot / U.S. Dollar. Price has recently moved upwards, labeled as swing "1", and is approaching a bearish order block (OB-) identified in the $3,344 - $3,353 area.
We could see a reaction at this OB- level, leading to a downward move as indicated by the arrow. The next potential target for this downward move could be the Point of Interest (POI) which aligns with a bullish order block (OB+) around the $3,283 - $3,288 zone.
Alternatively, if price pushes through the initial OB-, the next bearish OB- around $3,375 - $3,385 could act as further resistance, potentially leading to a reversal as shown by swing "2".
Traders could look for confirmation signals around these OB- levels to initiate short positions, targeting the POI OB+ as a primary target. A break below the POI OB+ could open the way for further downside.
Consider price action and volume at the highlighted zones for better entry and exit decisions.
Xauusdshort

Gold Spot / U.S. Dollar (XAUUSD) 2-Hour Chart2-hour chart from OANDA displays the recent price movement of Gold Spot (XAUUSD) against the U.S. Dollar. The current price is $3,336.615, up by $10.585 (+0.32%). The chart highlights a recent upward trend with a buy signal at $3,336.970 and a sell signal at $3,336.260. Key price levels include a resistance zone around $3,364.828 and a support zone near $3,309.957, with the price showing a potential breakout above the recent consolidation range.
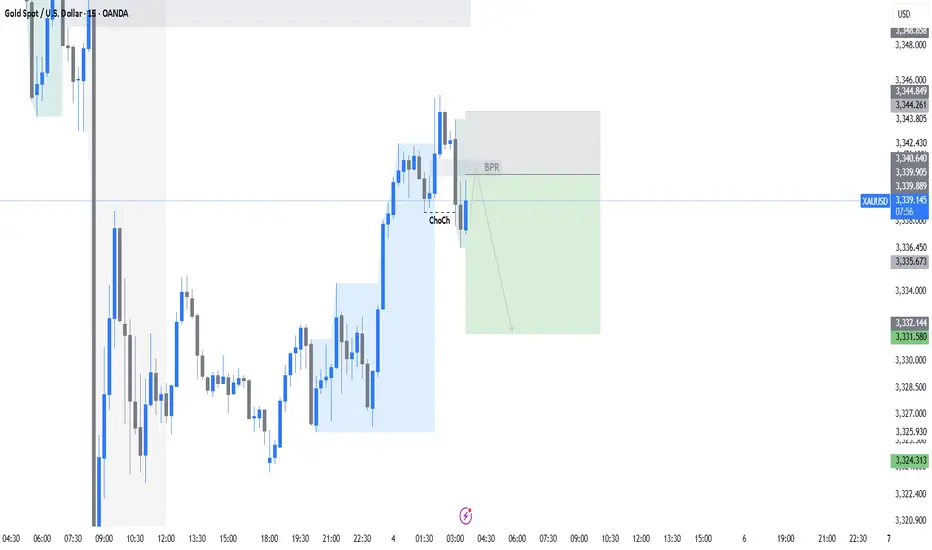
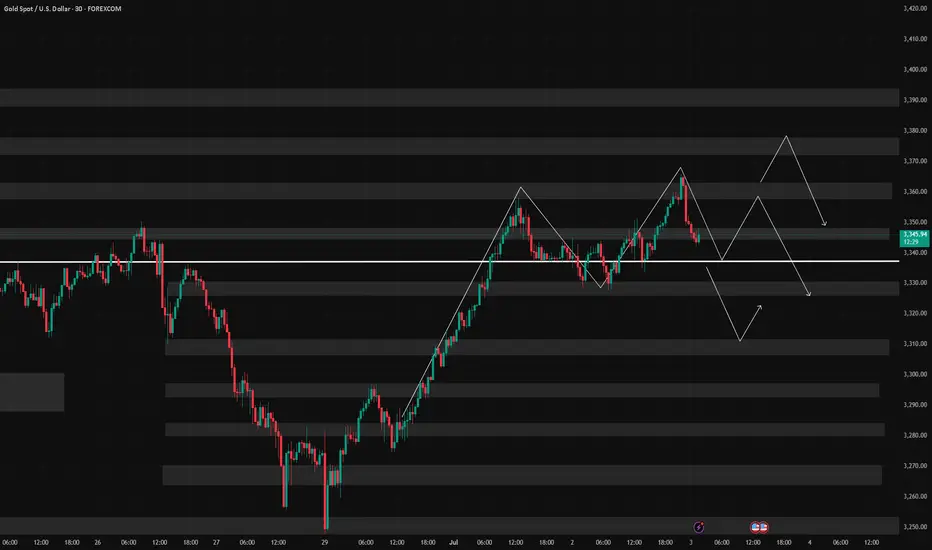
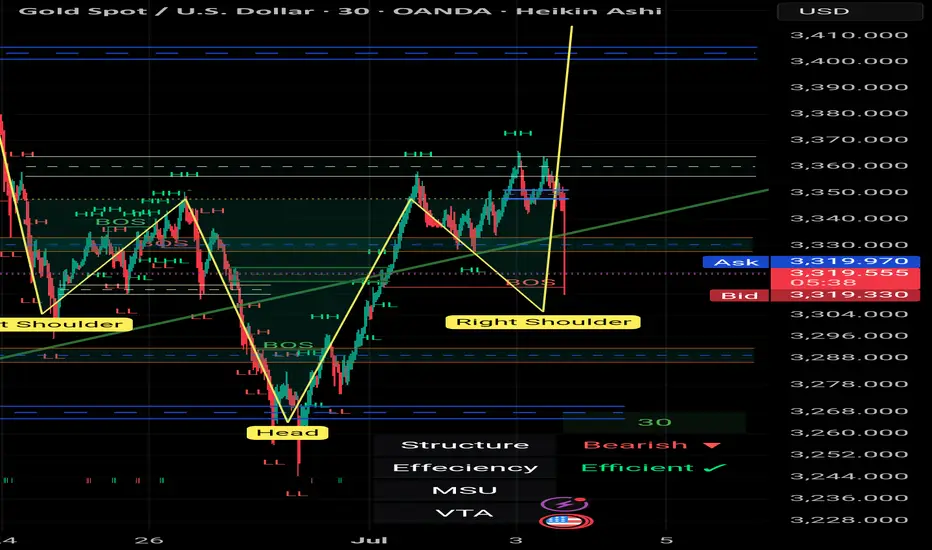
XAUUSD | 30m | Weekly Open Outlook Published by Mohsen Mozafari## 📍 XAUUSD | 30m | Weekly Open Outlook
⏱️ *Published by Mohsen Mozafarinejad*
---
### 🔍 Market Structure:
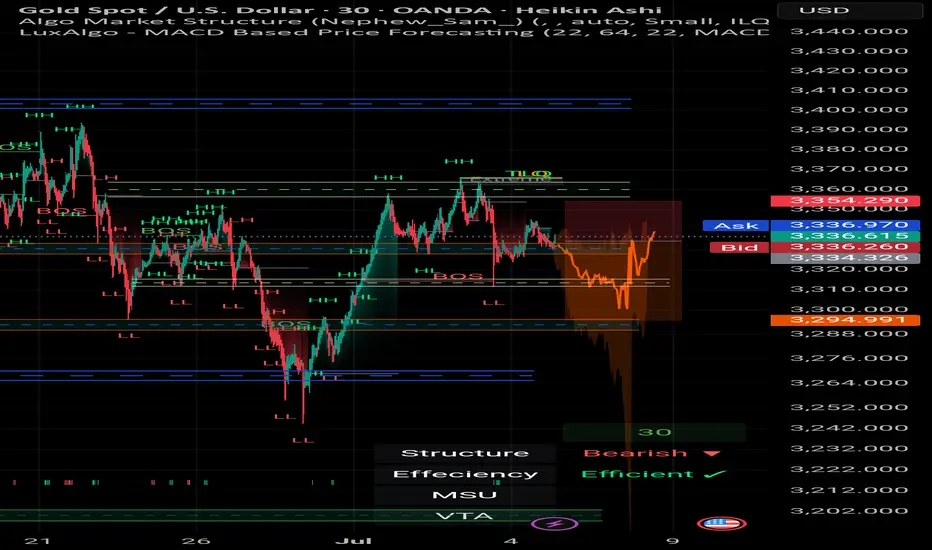
The market currently shows a **bearish structure**.
After a recent **BOS (Break of Structure)** near the 3344 zone, price retraced to mitigate unfilled sell orders within the **Extreme Supply OB (TLQ)**.
---
### 🔸 Key Observations:
- Price is reacting from a clear **supply zone (TLQ)** following BOS.
- The move appears to have cleared liquidity from late long entries.
- OB efficiency remains intact, indicating healthy market flow.
---
### 🧭 Scenario A – Short Bias
> If price consolidates or rejects below the 3340 level, a **high-probability short** may form.
🎯 Target: **Demand OB at 3295**
🚫 Invalidation: **Break & close above 3354 (last HH)**
---
### 🧭 Scenario B – Fakeout & V-Shape Reversal
> If price sweeps above TLQ but loses momentum, it could trap buyers and sharply reverse below BOS.
This would signal potential **seller exhaustion**.
---
### ⚙️ Technical Summary:
- **Structure:** Bearish 🔻
- **Efficiency:** Efficient ✅
- **MSU & VTA levels:** Valid for lower timeframe confirmations
- **Momentum:** Controlled pullback detected
---
> 📌 *"Precision beats prediction. Let the chart speak before you act."*
---
#### 🔖 Hashtags:
#XAUUSD #SmartMoney #SupplyDemand #OB #BOS #ScalpingGold #ForexAnalysis #MohsenMozafarinejad
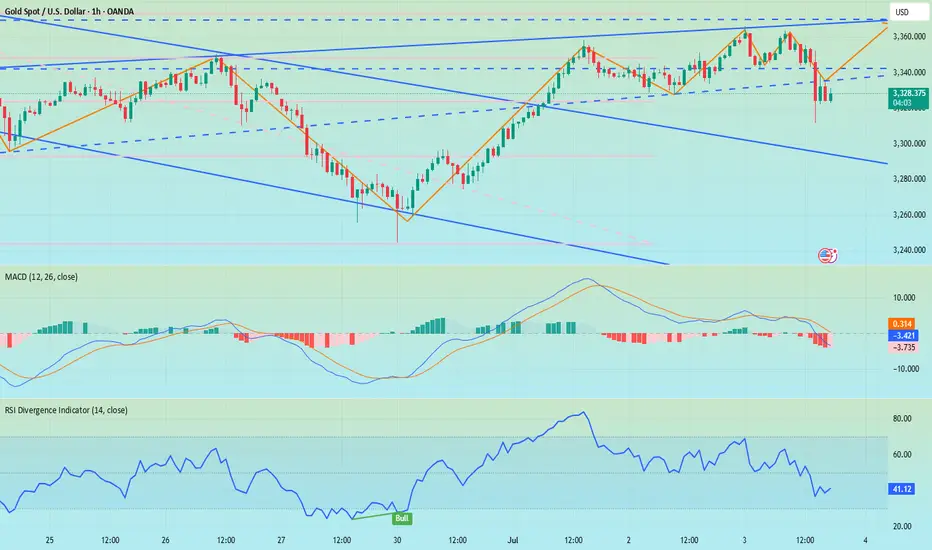
Gold lacks downside momentum: Next week's analysis & adviceGold trading is relatively light today due to the U.S. Independence Day holiday. On the downside, we continue to focus on the short-term support at the 3325 level, while the key resistance above remains in the 3345-3350 range, which was yesterday's breakdown point. The market has closed early today, and price action has been stuck in a range-bound consolidation.
After plunging $40 on the back of bearish non-farm payroll data, gold stabilized and rebounded, recouping nearly half of the losses. This performance confirms that the downside space is limited. Currently, the market has returned to a oscillating upward pattern, and the weekly chart is likely to continue range-bound fluctuations. From a technical perspective, the 3325 level has formed a key support. The secondary retest overnight confirmed the bottom structure, and the gradual lifting of early session lows has also released a bullish signal. Looking ahead to next week, gold is expected to continue its bullish trend. If the 3325 support level below remains unbroken, one can look for opportunities to establish long positions.
XAUUSD
buy@3325-3330
tp:3340-3360-3380
Investment itself is not the source of risk; it is only when investment behavior escapes rational control that risks lie in wait. In the trading process, always bear in mind that restraining impulsiveness is the primary criterion for success. I share trading signals daily, and all signals have been accurate without error for a full month. Regardless of your past profits or losses, with my assistance, you have the hope to achieve a breakthrough in your investment.
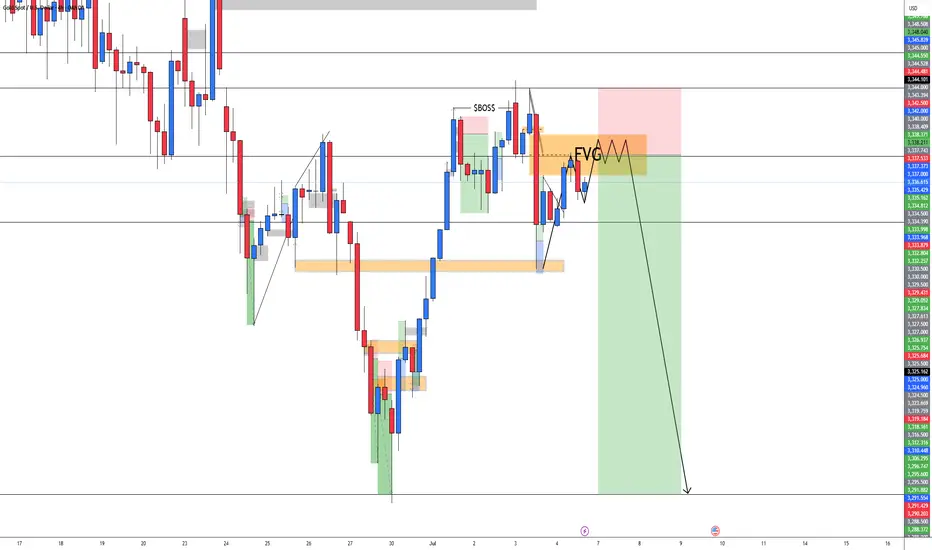
XAUUSD BEARISHAccording to the SMC and FVG concept, I am seeing bearish momentum in Gold. We have to wait for the proper rejection from FVG to sell the GOLD.
June Nonfarm Data: Gold PlungesThe US June nonfarm payrolls data is out: 147,000 jobs were added, exceeding the expected 106,000 and the previous 139,000, with slight upward revisions to the prior two months’ figures. The unemployment rate dipped from 4.2% to 4.1%, beating the forecast of 4.3%. While the US economy slows, the job market remains robust. 🌟
Post-data release, market bets on a July rate cut have evaporated, with the probability of a September cut dropping to around 75%. US stock futures extended gains, Treasury yields rose across the board, the US Dollar Index surged, and gold plunged nearly $40 in a short squeeze—signaling an unexpected major bearish hit to gold. Weng Fuhao advises trading with the trend, focusing on shorting on rebounds. 😲
Gold, jolted by the nonfarm data, slid sharply in the short term before a minor rebound, with bearish signals across all timeframes. The data triggered an immediate breakdown, shifting the short-term trend to downward: on the 3-hour chart, moving averages formed a death cross, MACD showed a death cross with expanding volume, and gold prices fell below the Bollinger Band lower track, confirming a clear bearish momentum. 📉
🚀 Sell@3355 - 3345
🚀 TP 3335 - 3325 - 3315
Accurate signals are updated every day 📈 If you encounter any problems during trading, these signals can serve as your reliable guide 🧭 Feel free to refer to them! I sincerely hope they'll be of great help to you 🌟 👇
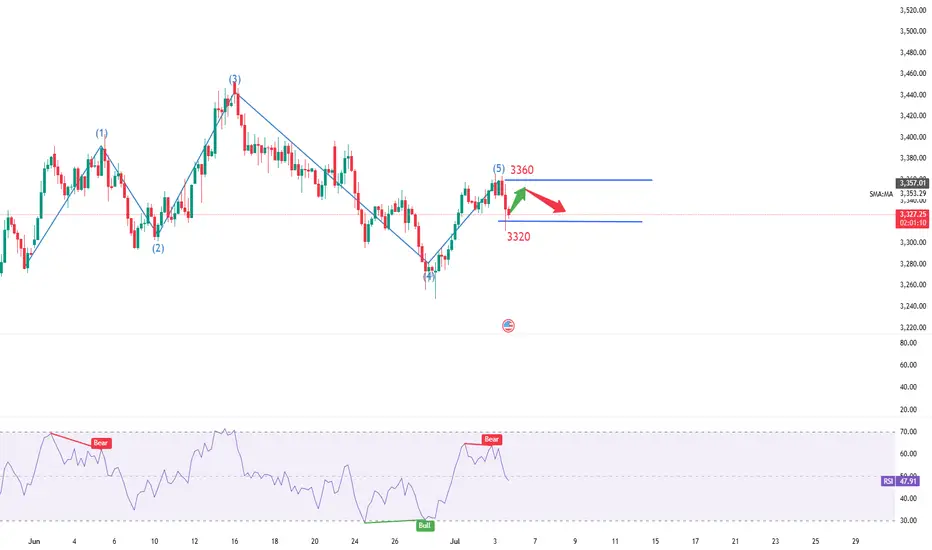
Go short before breaking 3350, go long before falling to 3320📰 News information:
1. Geopolitical situation
2. Tariff implementation and interest rate cut bill
📈 Technical Analysis:
As I said, the US stock market closed early today, and the market will lack some momentum. It is difficult to have a large fluctuation. It is expected to fluctuate and consolidate. I also explained in the previous post that the upper pressure in the short term is at 3340-3350. If it is touched, we can try to short and defend 3360. If it falls back to 3323, we can try to go long for the first time. If it continues to fall, it is expected to reach 3315-3305. Therefore, if it first touches 3323, go long, SL 3316, and consider going long if it touches 15-05 below.
🎯 Trading Points:
SELL 3340-33350
TP 3330-3320-3310-3300
BUY 3323
TP 3333-3340-3350
BUY 3315-3305
TP 3325-3333-3340
In addition to investment, life also includes poetry, distant places, and Allen. Facing the market is actually facing yourself, correcting your shortcomings, confronting your mistakes, and strictly disciplining yourself. I hope my analysis can help you🌐.
TVC:GOLD OANDA:XAUUSD FX:XAUUSD FOREXCOM:XAUUSD PEPPERSTONE:XAUUSD FXOPEN:XAUUSD
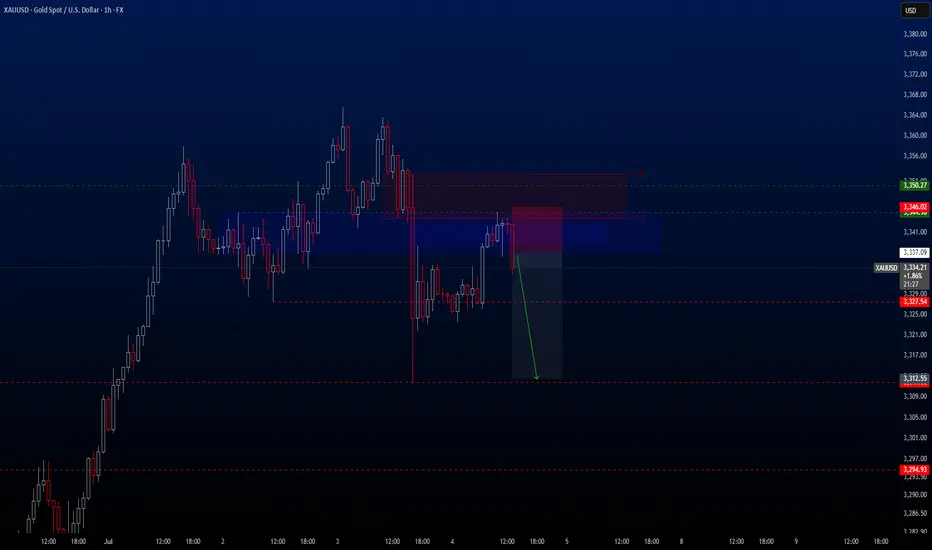
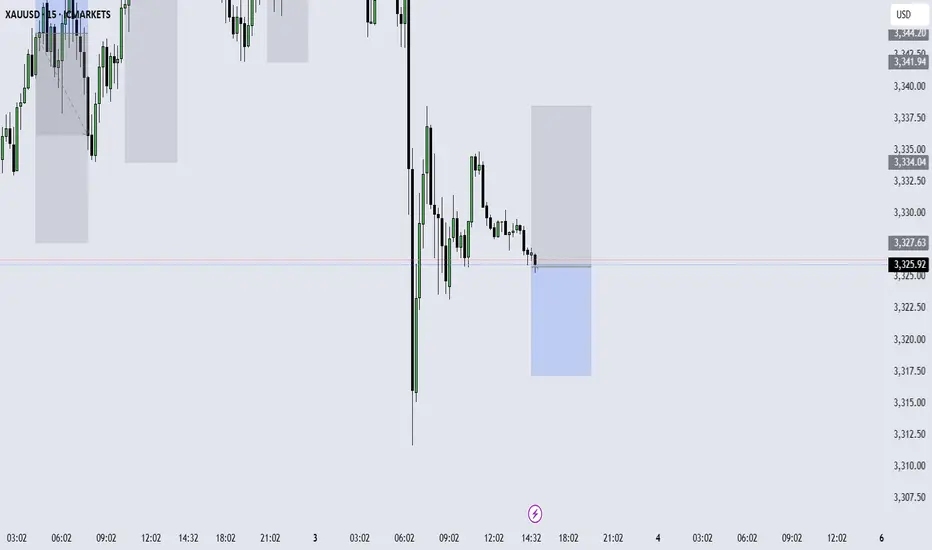
XAUUSDHello traders. After a short break, we’ve identified a promising sell opportunity on the XAUUSD pair.
Despite the U.S. Independence Day holiday, I believe we may still see solid movement in gold during today's session.
🔍 Trade Details
✔️ Timeframe: 1-Hour (H1)
✔️ Risk-to-Reward Ratio: 1:2.70
✔️ Trade Direction: Sell
✔️ Entry Price: 3337.09
✔️ Take Profit: 3312.16
✔️ Stop Loss: 3345.63
🕒 If momentum fades or the price consolidates in a tight range, I will keep this trade open only until 23:00 (UTC+4). After that, I’ll close it manually—whether in profit or loss—depending on how price action evolves.
🔔 Disclaimer: This is not financial advice. I’m simply sharing a trade I’ve taken based on my personal trading system, strictly for educational and illustrative purposes.
📌 Interested in a systematic, data-driven trading approach?
💡 Follow the page and turn on notifications to stay updated on future trade setups and advanced market insights.
U.S. stocks are closed, how to operate gold volatility📰 News information:
1. Geopolitical situation
2. Tariff implementation and interest rate cut bill
📈 Technical Analysis:
Gold has maintained a volatile pattern recently, lacking a sustained unilateral trend. The unclear short-term direction of DXY has limited the volatility of gold. The market has repeatedly shown a mixture of high-rise decline and downward recovery. It is unable to effectively break through the previous high and lacks the momentum to break downward. The short-term pressure during the day is concentrated on the 3340-3345 line, and the upper middle track is at 3350. If it fails to effectively break above 3350, then gold may fall further. On the contrary, if it can stand above the middle track 33350, then gold may rise further. The short-term support below is near the 3323 line. If it fluctuates during the day, maintain a high-altitude low-multiple cycle.
🎯 Trading Points:
SELL 3340-3350
TP 3330-3320-3310
BUY 3320-3310
TP 3340-3350
In addition to investment, life also includes poetry, distant places, and Allen. Facing the market is actually facing yourself, correcting your shortcomings, confronting your mistakes, and strictly disciplining yourself. I hope my analysis can help you🌐.
FXOPEN:XAUUSD PEPPERSTONE:XAUUSD FOREXCOM:XAUUSD FX:XAUUSD OANDA:XAUUSD TVC:GOLD
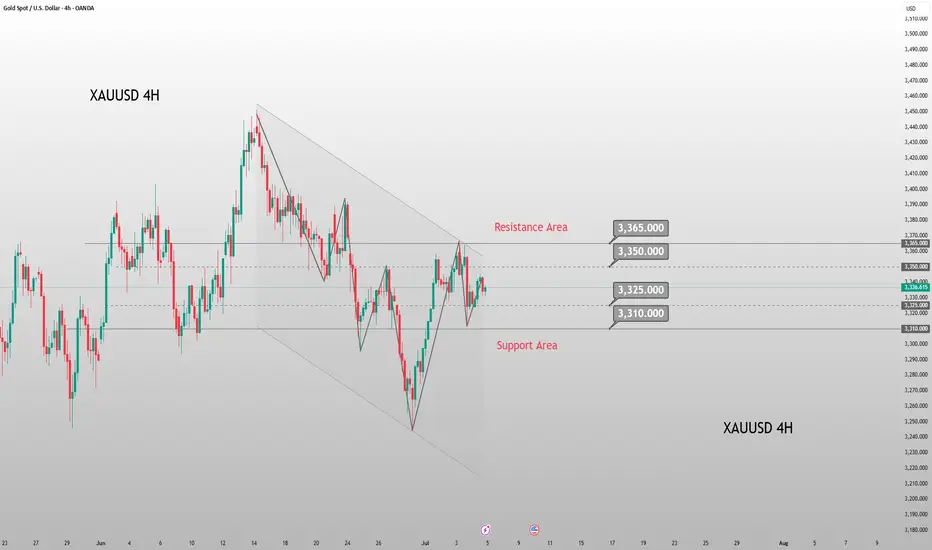
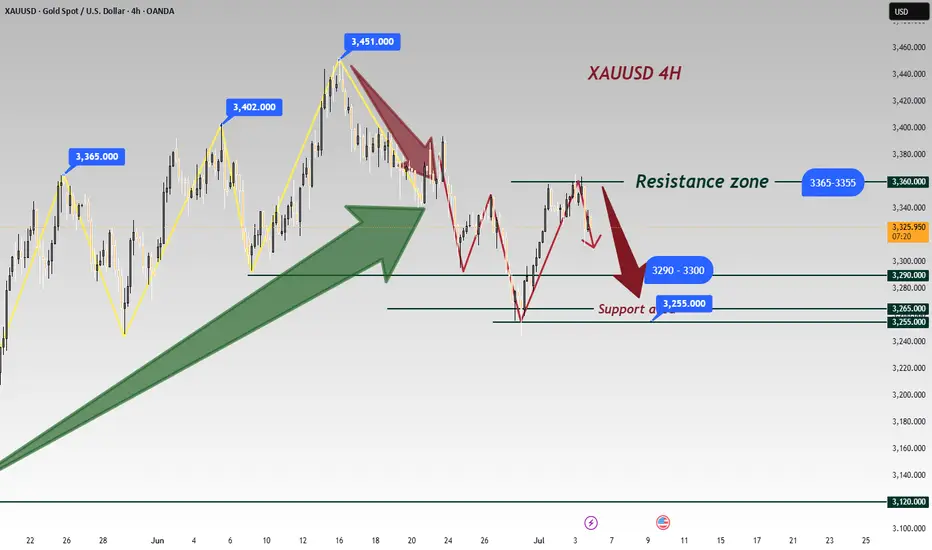
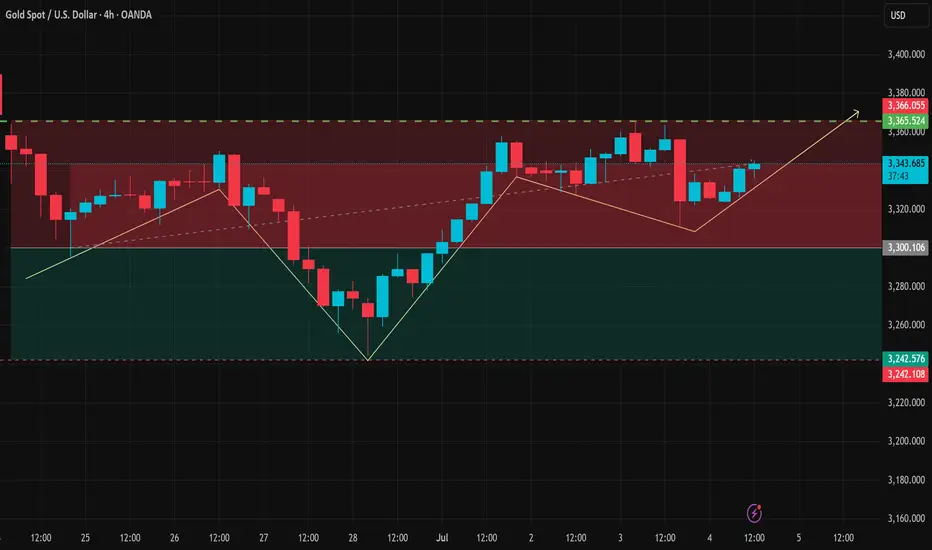
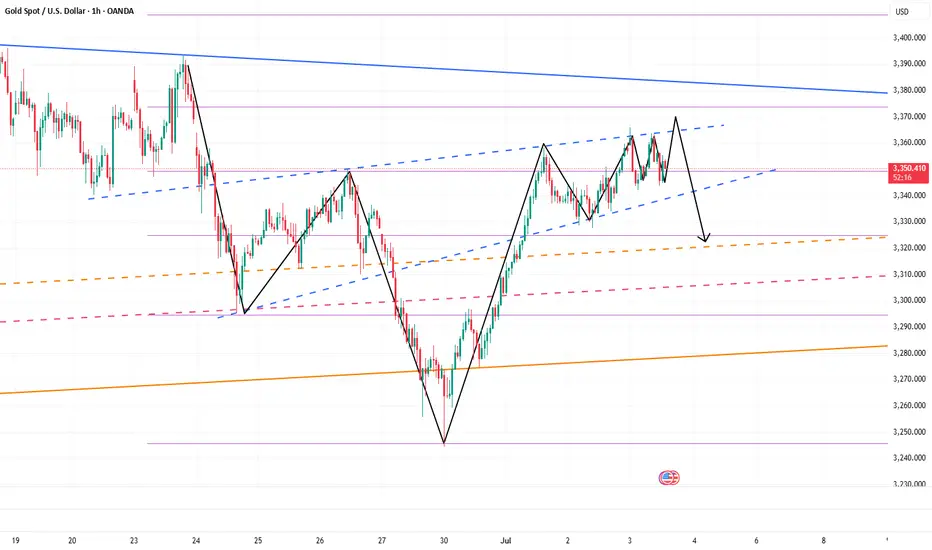
XAUUSD Consolidates Below Resistance – A Breakout Imminent?On the 4-hour timeframe (H4), XAUUSD is clearly consolidating just below the key resistance zone near $3,366, forming higher lows and lower highs within a tightening range highlighted by the shaded area.
1. Key Price Action Highlights
Price has been forming higher lows, suggesting growing bullish momentum.
The $3,366 resistance remains intact – a breakout above this level could confirm bullish continuation.
A visible double bottom (W pattern) formed around June 28 hints at a strong technical rebound after a correction phase.
2. Important Support and Resistance Levels
Price Level
Significance
$3,366 – $3,380
Major resistance zone – likely breakout target
$3,300
Key near-term support where price recently bounced
$3,242
Deeper support – a breakdown here could confirm bearish reversal
3. Suggested Trading Strategy
Buy on breakout above $3,366 with strong volume and clear confirmation (e.g., a large-bodied candle closing above resistance).
Consider buying on a pullback to the $3,320 – $3,300 zone for better risk-reward.
Stay cautious if price breaks below $3,300 – this could signal a bearish shift in momentum.
Gold is currently in a tight consolidation phase under major resistance, with bullish structure still intact. A breakout above $3,366 could trigger a sharp move upward. Until then, traders should monitor the lower boundaries for potential pullbacks or invalidation signals.
Gold AnalysisI am seeing gold for a bearish move as it shifts its direction i am taking a short position from marked zone you guys can manage your risk accordingly
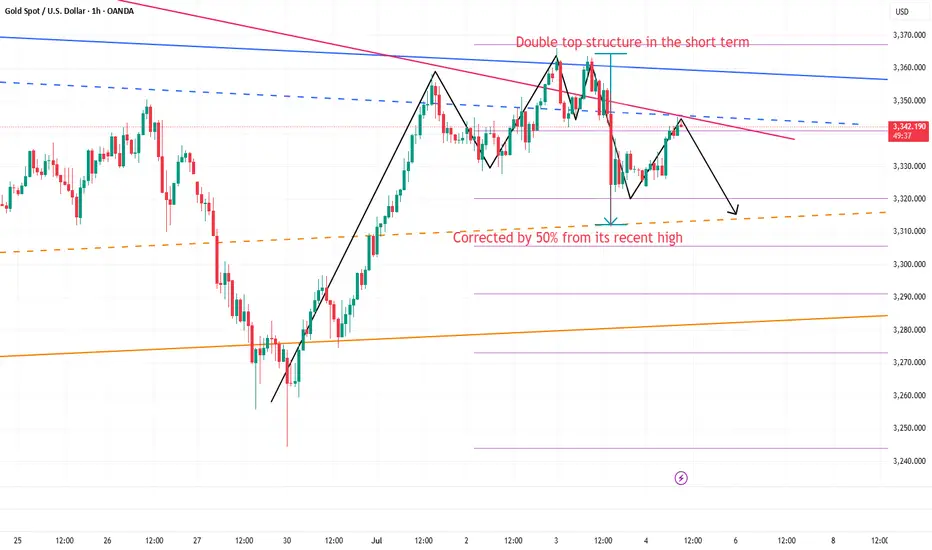
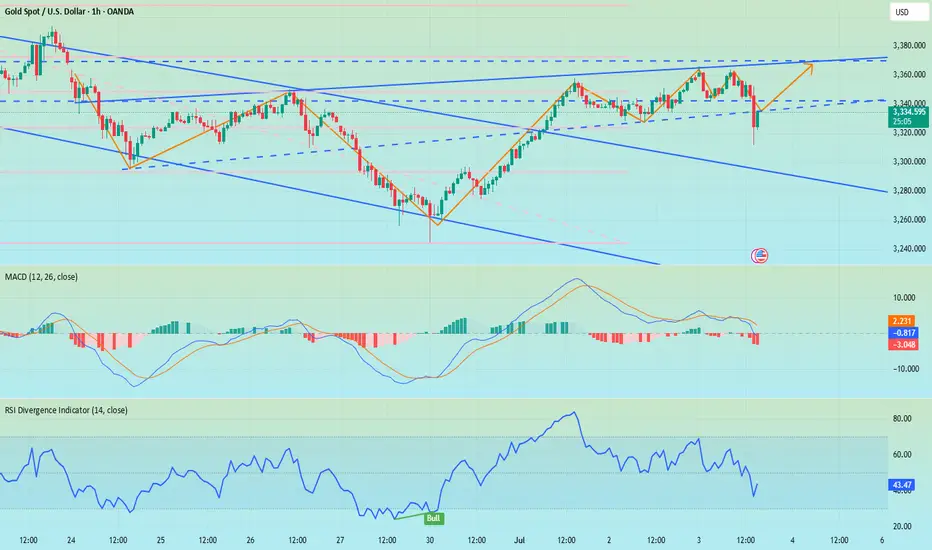
Still short gold before breaking 3355After the release of NFP yesterday, gold began to fall sharply from 3352, reaching a low of around 3312; although it has gradually rebounded above 3340, the time span is not short, so the rebound is not strong; and the double top structure successfully constructed by gold in the 3365-3360 area in the short term still plays a technical suppression role in the short term, greatly weakening the rebound potential; and with the decline of gold yesterday, I think before gold recovers the 3352 starting point, gold will also be under pressure in the 3345-3355 area in the short term. If gold cannot successfully break through this area during the rebound, gold is expected to retest the 3330-3320 area again.
Because of the US Independence Day, the gold market will be closed in advance today. It is expected that gold will not have a breakthrough today, so it may be difficult to break through the 3345-3355 area in the short term, so we can still continue to maintain the trading rhythm of shorting gold in terms of trading.
So I think shorting gold still has a lot of profit potential. We can short gold with 3345-3355 area as resistance and look to the target area: 3335-3325-3315.
7/4: Trade Within the 3313–3346 RangeGood morning, everyone!
Yesterday’s intraday trades delivered solid profits. Since the U.S. market will be closed today, news-driven volatility is expected to be limited. Therefore, today’s trading focus will primarily revolve around technical setups.
Current structure:
Key support: 3321–3316
Immediate resistance: 3337–3342, followed by 3360
If support holds and resistance breaks, a potential inverse head-and-shoulders pattern may form on the 4H chart, with the next target near 3380
If support breaks, focus shifts to the 3303–3289 support zone
Given the likelihood of range-bound price action today, the suggested intraday range is 3313–3346, with a preference for selling near resistance and buying near support.
If an upside breakout occurs, consider using the MA20 on the 30-minute chart as a guide for pullback entries.
XAUUSD (GOLD): Sell setupXAUUSD (GOLD): Sell setup. It is ready for a sell, it will open in Asian session, and also market is complex now, but here is my plan.
Cheers
Will the NFP impact cause the bear market to dominate?📰 News information:
1. Initial jobless claims and NFP data
2. The final decision of the Federal Reserve
📈 Technical Analysis:
In the previous post, I have stated that if the hourly line closes above 3320, gold will fall into high consolidation in the short term. Currently, gold fluctuates narrowly in the short term. I think now we just need to be patient and wait for key points to enter the market. The daily and weekly lines clearly show that the high point of the oscillation range is constantly moving up, and the center of gravity continues to rise. The current market is quietly accumulating momentum, and a new round of weekly and monthly lines are about to rise. Therefore, first of all, I will pay attention to the defensive point below 3320, and then refresh the point below is the previously mentioned 3315-3305. If the point below is touched to get effective support, you can consider going long. Bros who trade independently must strictly set TP and SL to avoid the impact of market fluctuations.
🎯 Trading Points:
BUY 3320-3315-3310
TP 3330-3340-3360
In addition to investment, life also includes poetry, distant places, and Allen. Facing the market is actually facing yourself, correcting your shortcomings, confronting your mistakes, and strictly disciplining yourself. I hope my analysis can help you🌐.
FXOPEN:XAUUSD PEPPERSTONE:XAUUSD FOREXCOM:XAUUSD FX:XAUUSD OANDA:XAUUSD TVC:GOLD
NFP unexpectedly broke out, where will gold go?📰 News information:
1. Initial jobless claims and NFP data
2. The final decision of the Federal Reserve
📈 Technical Analysis:
The unexpectedly negative NFP data caused a sudden plunge in gold prices, which forced me to terminate the transaction urgently. Currently, gold has not fallen below the 3,300 mark. Therefore, I will still pay attention to the closing of the hourly line. If gold closes below 3,320, the downward trend will continue. On the contrary, if it closes above 3,320, gold will consolidate at a high level in the short term. Two days ago, I gave the support level of 3315-3305 below. Please be cautious in trading at the moment.
🎯 Trading Points:
For now, let’s focus on the hourly closing situation
In addition to investment, life also includes poetry, distant places, and Allen. Facing the market is actually facing yourself, correcting your shortcomings, confronting your mistakes, and strictly disciplining yourself. I hope my analysis can help you🌐.
TVC:GOLD OANDA:XAUUSD FX:XAUUSD FOREXCOM:XAUUSD PEPPERSTONE:XAUUSD FXOPEN:XAUUSD
Continue to maintain the rhythm of short tradingUnder the influence of NFP, gold fell sharply as expected. What I had suggested before was proven correct by the market again. "Gold rose in advance to reserve room for the NFP market to fall." After NFP, gold fell to around 3311 and the decline narrowed. Therefore, we accurately seized the opportunity to go long on gold near 3312 and set TP: 3330. Obviously, gold successfully hit TP during the rebound and made an easy profit of 180 pips.
From the current gold structure, gold encountered resistance and retreated twice near 3365, and built a double top structure in the short-term structure. In order to eliminate the suppression of the double top structure, gold still needs to continue to fall after the rebound. After the cliff-like decline of gold, the short-term resistance is in the 3340-3345 area, and the short-term support below is in the 3320-3310 area.
So I think that gold can still continue to short gold after the rebound, and I have already shorted gold around 3336 with the 3340-3345 area as resistance. Now we just need to wait patiently for gold to hit TP. Let us wait and see!
Gold Latest Market Trend AnalysisThe data released by the U.S. Bureau of Labor Statistics showed that the U.S. seasonally adjusted non-farm payroll employment in June was 147,000, with the consensus forecast at 110,000. The previous value was revised up from 139,000 to 144,000. The annual rate of average hourly earnings in June stood at 3.7%, below the expected 3.90%, while the prior figure was revised down from 3.90% to 3.8%.
Following the release of the non-farm payroll report, interest rate futures traders abandoned their bets on a Federal Reserve rate cut in July. Currently, the market-implied probability of a Fed rate cut in September is approximately 80%, down from 98% prior to the report. On Thursday, gold exhibited a seesaw pattern, surging initially to hit resistance near $3,365 per ounce before retreating. During the U.S. session, it broke below support levels and further declined to hover around $3,311, where it staged a rebound. Gold remains in a high-range consolidation under selling pressure.
you are currently struggling with losses,or are unsure which of the numerous trading strategies to follow,You have the option to join our VIP program. I will assist you and provide you with accurate trading signals, enabling you to navigate the financial markets with greater confidence and potentially achieve optimal trading results.
Trading Strategy:
sell@3350-3355
TP:3320-3325
XAUUSD 4H SHORTPrice broke out of the bearish trend line and moved sideways in a range forming two tops or a double top.
Fundamentally, US jobs data came out positive keying into hawkish tone on interest rate and influenced CPI.
Price broke the neckline after 4H closure giving signal for bearish move to $3250 support.
Here’s my little idea on GOLD. Follow for more.
Revealed: Beware of a strong counterattack from gold bears!Perhaps due to the impact of the NFP market later, gold fluctuated relatively cautiously today, and neither the long nor the short side showed signs of breakthrough, and the overall trend remained volatile. However, as gold rebounded, the market bullish sentiment gradually tended to be optimistic. In the short term, the lower support area was relatively obvious, that is, the second pull-up point 3335-3325 area, followed by 3315-3305 area;
However, as gold rebounded twice and fell after touching 3365, the suppression above was also obvious. In the short term, it faced the suppression of 3375-3385 resistance. If gold cannot effectively break through this area, gold bears may make a stronger counterattack, so I don’t think gold bears have no chance at all.
Therefore, I think there is still a good profit opportunity to try to touch the top and short gold. You can consider trying to short gold in the 3365-3375-3385 area and look at the target: 3340-3330-3320.
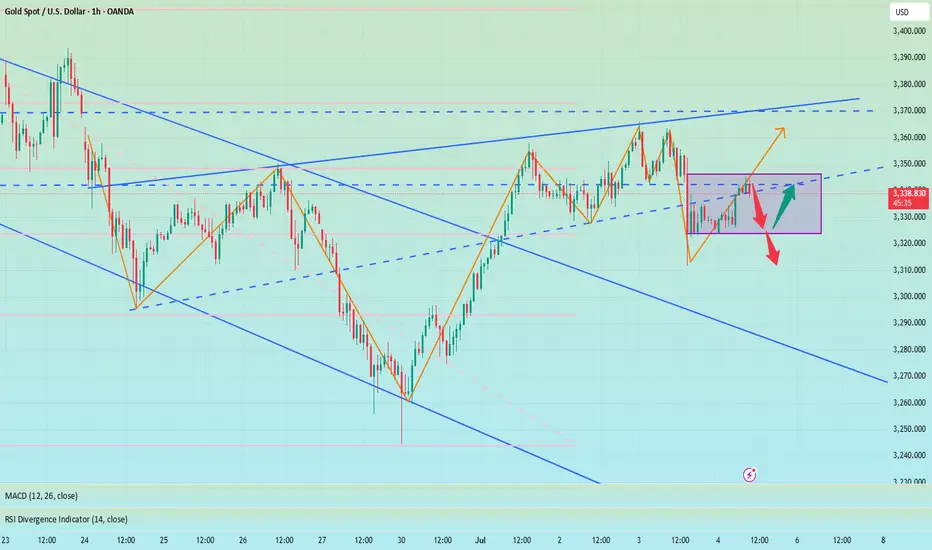
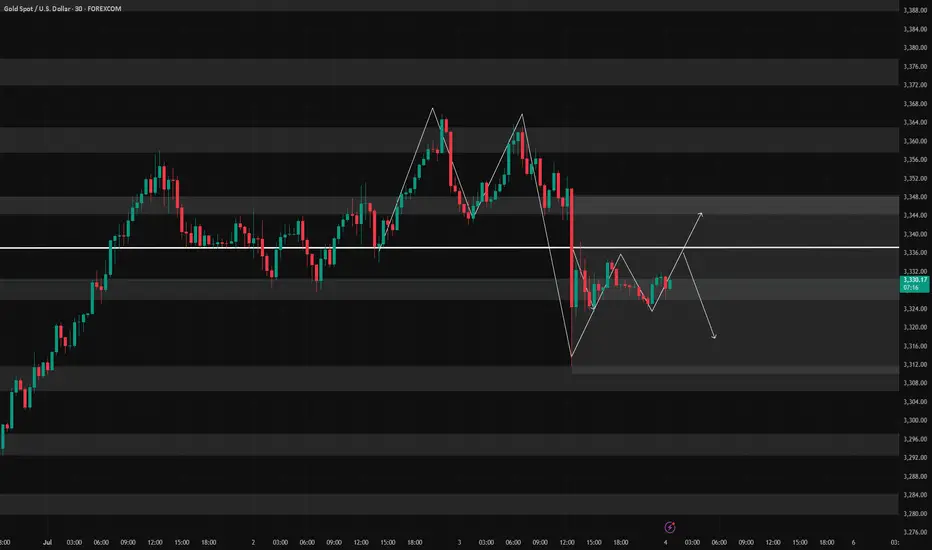
7/3: Focus on Short Positions, Watch Support Near 3320Good morning, everyone!
Yesterday, gold tested support near 3328 but failed to break below it effectively. The price then rebounded toward the 3350 level. At today’s open, gold briefly extended to around 3365 before pulling back.
Technically:
On the daily (1D) chart, the price remains capped by the MA20, with no confirmed breakout yet.
Support levels below are relatively dense, and moving averages are increasingly converging, suggesting a breakout in either direction is approaching.
Key intraday support lies in the 3321–3316 zone.
On the 2-hour chart, we are seeing the first signs of a bearish divergence, indicating a need for technical correction. Much like Tuesday’s setup, there are two possible scenarios:
If 3342–3334 holds, the price may extend slightly higher, intensifying divergence before pulling back;
If 3337 breaks, we could see a drop toward 3320, where correction would occur through a direct decline.
From a fundamental perspective, several high-impact U.S. data releases are scheduled for the New York session, which may increase volatility and make trading more challenging.
Trading suggestion:
For most traders, the safest approach is to wait for data to be released, then look for oversold rebounds or overbought corrections following sharp market reactions.
This style requires patience and strong risk control—avoid being overly aggressive or greedy, as such behavior can easily lead to trapped positions or even liquidation.
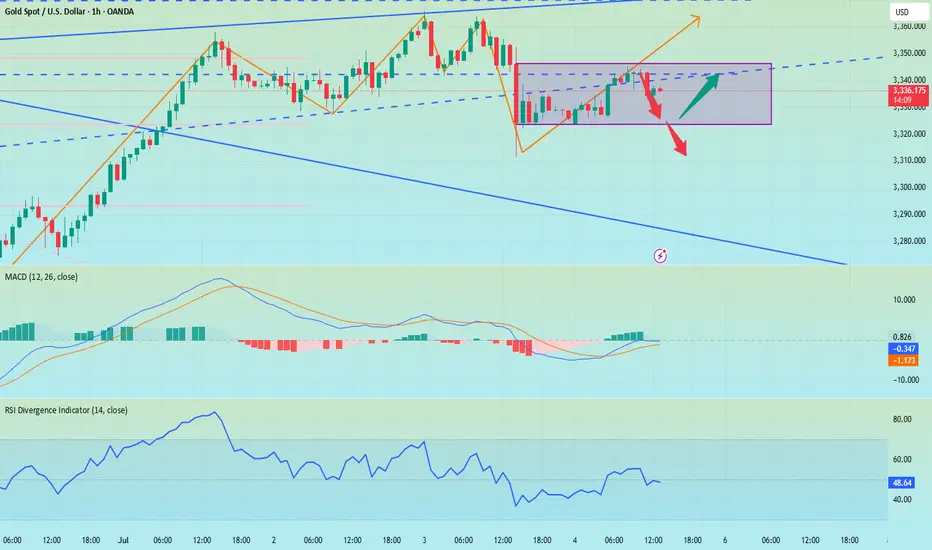
I say nothing , you say me any thing about 📌 **Gold Spot (XAU/USD) – 30m | 2h | Smart Money Perspective**
🔍 After weeks of precision tracking and structural validation, price has now tapped the **Right Shoulder** of a clean *Reverse Head & Shoulders* formation — with absolute respect to structure, liquidity, and OB zones.
💥 This wasn't just a random bounce.
It was:
- A confirmation of **previous BOS & CHoCH**
- A retest of **TLQ/ILQ liquidity zones**
- A reaction from the *Extreme OB* within a compression channel
- And a final push fueled by **inefficiency fills** on the left
🎯 The bullish intent remains strong, and if momentum follows through, we're looking at:
- **TP1** → 3345–3355 (minor OB & void fill)
- **TP2** → 3375–3390 (liquidity sweep target)
- **TP3** → 3420+ (range expansion goal)
🧠 This analysis has not just been correct.
It’s been **respected by the market.**
I take pride in every reaction the chart gives us when we respect the language of price, structure, and timing.
There’s no shortcut here — just observation, logic, and discipline.
We don’t chase the trend. We wait for it to **bow in confirmation**.
Like it just did.
— *Mohsen Mozafari Nejad* 🧭
#SmartMoney #GoldAnalysis #XAUUSD #TradingView #MarketStructure #BOS #OB #MSU #ReverseHeadAndShoulders #Forex #TechnicalAnalysis
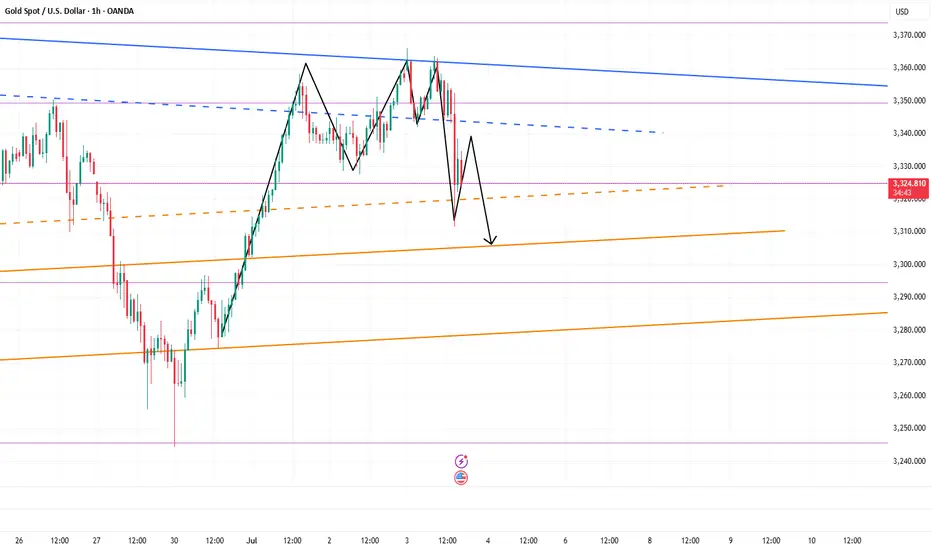
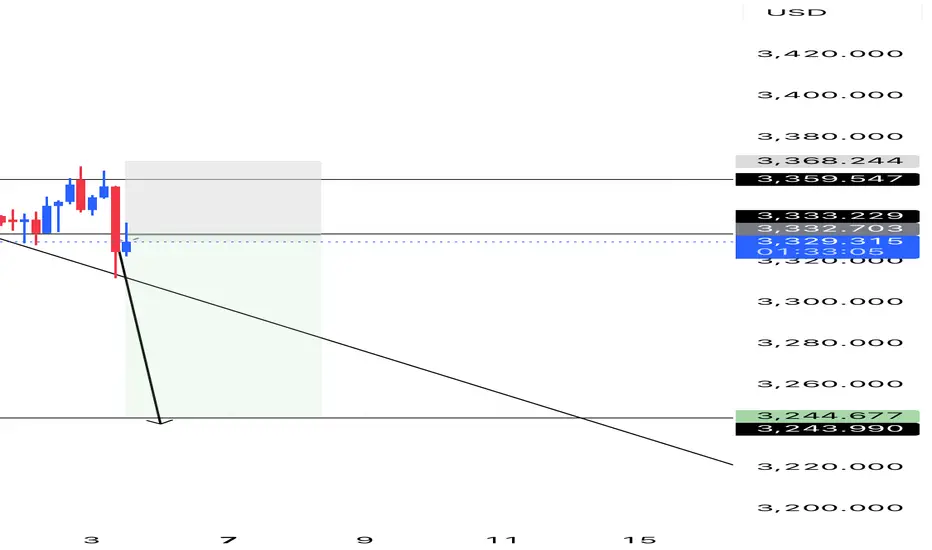
XAUUSD Weekly Analysis 30 June 4 July 2025Gold has formed a Head and Shoulders (H&S) pattern on the H4 timeframe. While the pattern is not perfectly symmetrical, it is still valid and clearly recognizable. The price has broken below the neckline, confirming a potential shift in market structure to the downside.
Analysis Insight:
The 3340–3350 area, previously a support zone, is now acting as resistance following the neckline break. A pullback to this zone may present a high-probability short opportunity for swing traders, especially if price shows rejection or bearish structure in that zone.
Trade Type: Swing
Trade Setup – Sell on Retracement:
Bias: Bearish on confirmation of retracement rejection
Entry Zone: 3340 – 3350
Stop Loss: 3376 (above right shoulder/high)
Take Profit: 3320/3300/3285/3260
Risk-Reward Ratio: Approximately 1:2
Kindly follow, share, like, support and comment.
