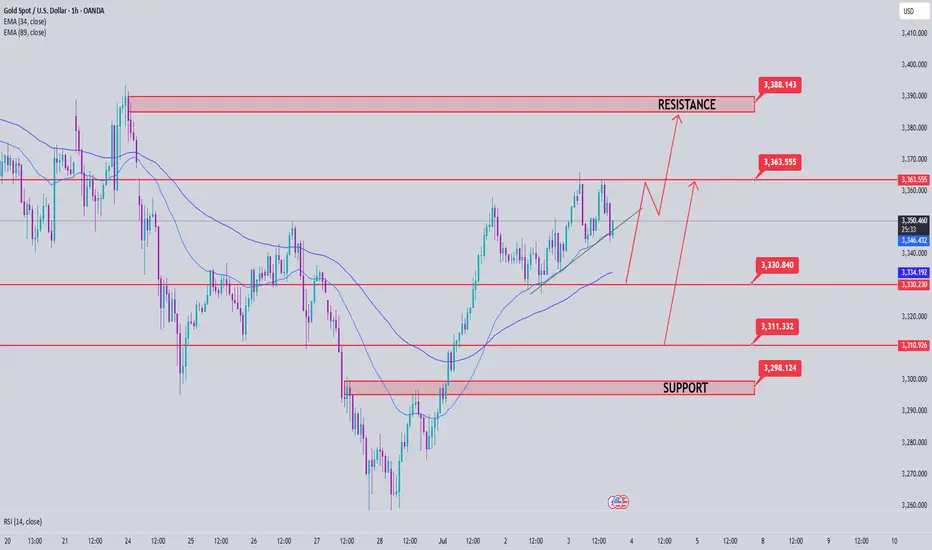
Gold Price Analysis July 3GOLD Technical Analysis - D1 Frame
On the D1 frame, the uptrend is still being maintained with momentum towards the price gap zone. During the European session, selling pressure started to appear around the resistance zone of 3365 - showing that this is the area where the sellers are making counter-moves.
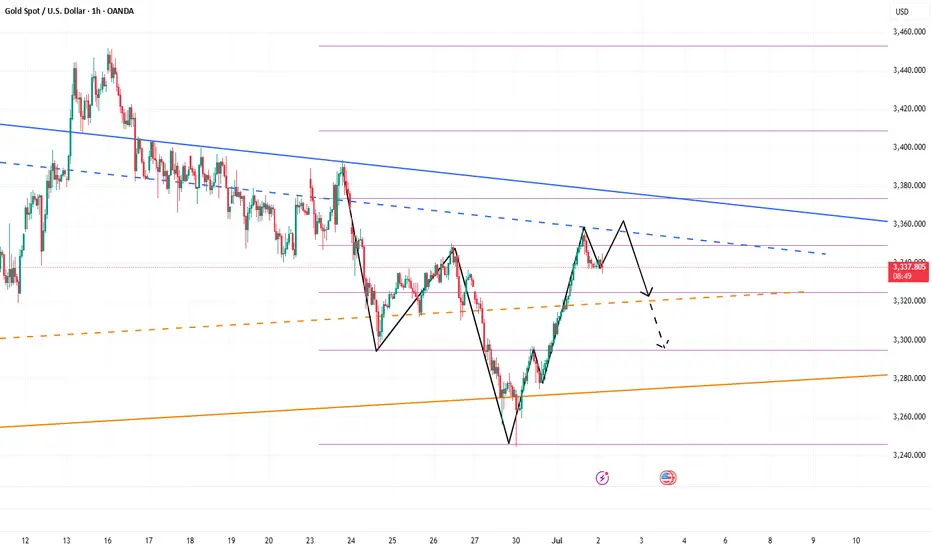
On the chart, the gold price is accumulating and forming a triangle pattern, indicating the possibility of a strong movement phase.
If the price breaks the upper border of the triangle (above the 3363 zone), it will likely open up an opportunity to approach the next resistance at 3388.
On the contrary, if it breaks the lower border (below the 3330 zone), the correction trend may be triggered, heading towards deeper support zones.
Important Zones:
Resistance: 3363 – 3388
Support: 3330 – 3311 – 3297 – 3277
Trading Strategy:
BUY Breakout: When price breaks above 3363
SELL Breakout: When price breaks below 3330
Xauusdshort
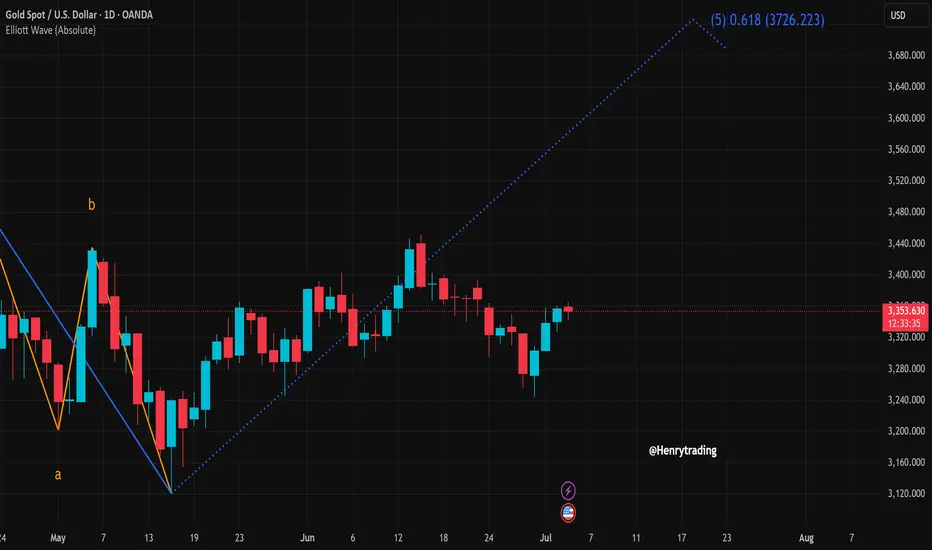
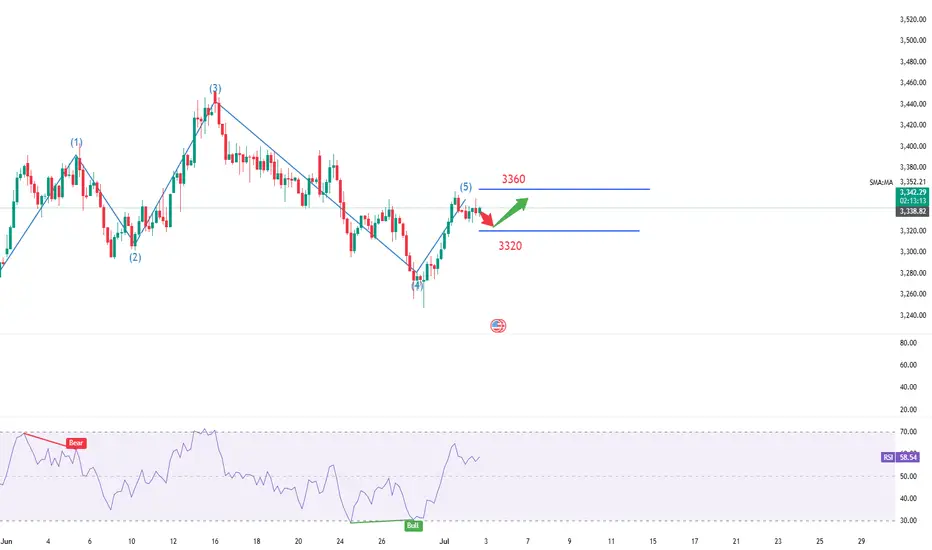
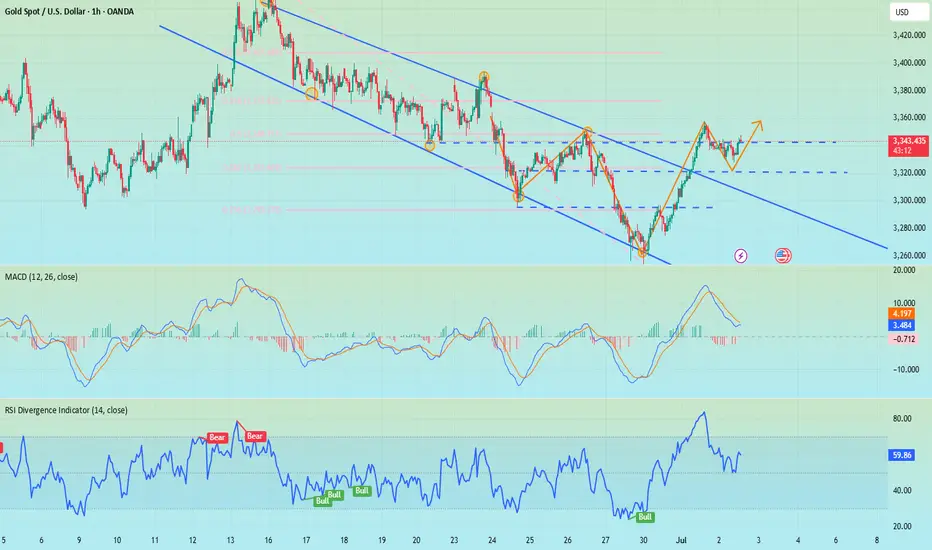
XAUUSD Set for Strong Bullish Wave – Targeting 3,726?Gold (XAUUSD) is showing signs of a bullish recovery after a recent correction between the 3,290–3,340 USD zone. On the daily chart, a clear Elliott Wave formation is unfolding, with the price potentially entering wave 5 aiming for the 0.618 Fibonacci extension at 3,726 USD.
Clear Wave Structure:
The a-b-c corrective wave appears to have completed in mid-May.
The price is now in wave 3 and preparing for a potential extension in wave 5.
Candlestick and Buying Momentum:
Recent candles show strong buying pressure with four consecutive bullish sessions.
The current upward momentum is testing the 3,352 resistance – a breakout could open the path to 3,450 and eventually 3,726 USD.
Support & Resistance Levels:
Immediate support: 3,320 – 3,330 USD
Key resistance: 3,450 USD (recent swing high)
Extended target: 3,726 USD (Fibonacci 0.618 from wave 2 low to wave 3 peak)
Suggested Trading Strategy:
Favor buy on dip strategy, waiting for a minor pullback to the 3,330–3,340 area before entering long.
Set stop-loss below 3,300, with targets at 3,450 and 3,726 USD respectively.
Conclusion:
The XAUUSD chart suggests a potential strong bullish wave according to the Elliott Wave framework, with a breakout likely leading to the 3,726 USD zone. Traders should closely monitor price action around the 3,350 level for confirmation of continued upward momentum.
What’s your view on this analysis? Drop a comment and let’s discuss your trading strategy together!
Gold trend analysis and layout before NFP data📰 News information:
1. Initial jobless claims and NFP data
2. The final decision of the Federal Reserve
📈 Technical Analysis:
Due to the Independence Day holiday this week, the NFP data was released ahead of schedule today, while the policy differences within the Federal Reserve have brought uncertainty to the market. Judging from the market trend, the 4H level shows that the gold price tested the upper track yesterday and then turned to high-level fluctuations after coming under pressure. In the short term, the structure still has bullish momentum after completing the accumulation of power. Although there was a correction in the US market yesterday, it stopped falling and rebounded near 3335, further confirming the strength. At present, the upper resistance in the European session is at 3365-3375, and the short-term support is at 3345-3335 below. Intraday trading still requires good SL to withstand market fluctuations. In terms of trading, it is recommended to mainly go long on callbacks
🎯 Trading Points:
SELL 3365-3375
TP 3350-3340-3335
BUY 3335-3330-3325
TP 3350-3360-3375
In addition to investment, life also includes poetry, distant places, and Allen. Facing the market is actually facing yourself, correcting your shortcomings, confronting your mistakes, and strictly disciplining yourself. I hope my analysis can help you🌐.
FXOPEN:XAUUSD PEPPERSTONE:XAUUSD FOREXCOM:XAUUSD FX:XAUUSD OANDA:XAUUSD TVC:GOLD
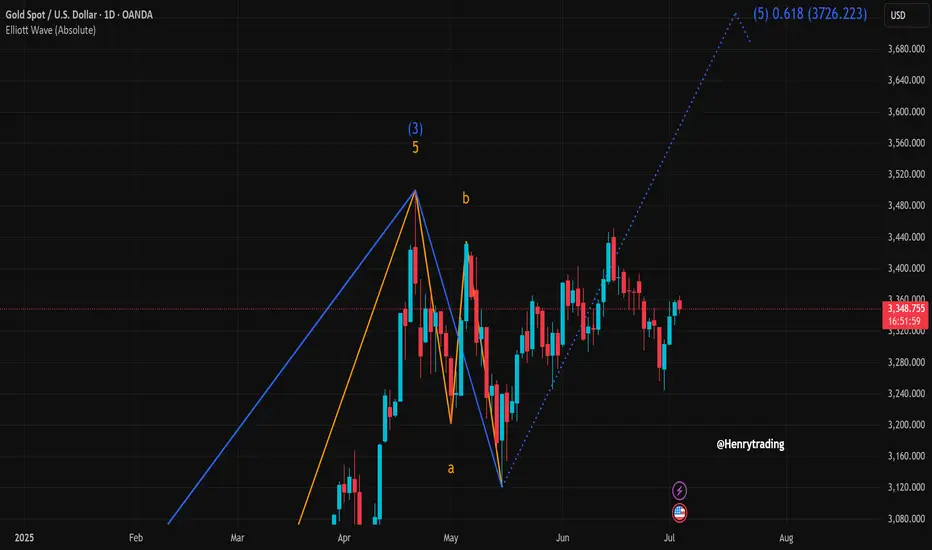
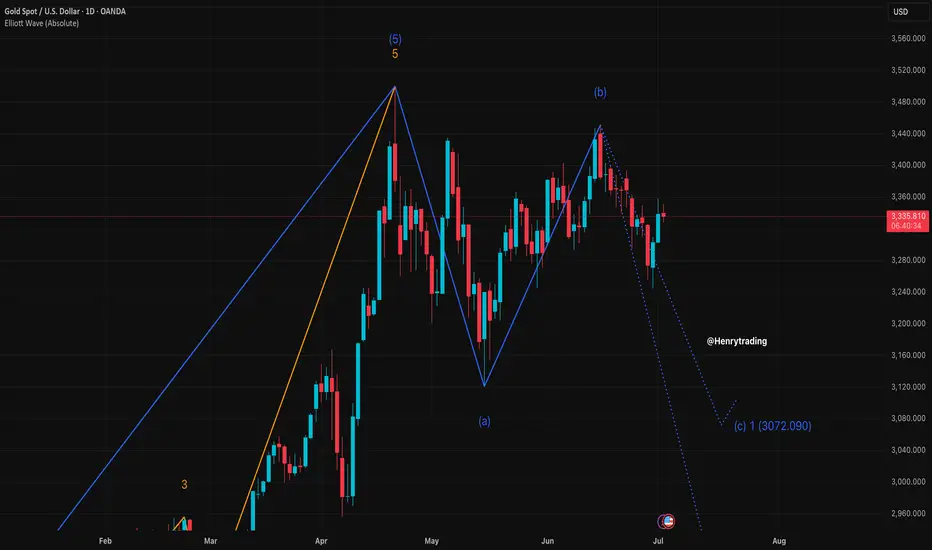
Elliott Wave Analysis of XAUUSDOn the daily chart of XAUUSD, we are witnessing a clearly defined Elliott Wave structure, with the potential formation of an extended wave (5) targeting the $3,726 region — aligned with the 0.618 Fibonacci extension. This is a key technical signal that could capture the attention of both long-term investors and strategic swing traders.
1. Elliott Wave Overview:
Wave (3) concluded at the peak around $3,365, followed by a textbook a-b-c corrective pattern.
Waves "a" and "b" are clearly identifiable, with wave "c" appearing to have completed.
The current price action suggests a rebound from the bottom of wave c — a strong indication of a possible start to wave (5).
2. Wave (5) Target Zone:
The Fibonacci 0.618 extension projects a target near $3,726 — a significant price level the market could approach if bullish momentum builds up.
This level also serves as a psychological resistance zone, so expect possible volatility as the price nears this area.
3. Price Behavior & Confirmation Signals:
Recent candlestick formations reveal renewed buying interest, with multiple bullish candles showing long bodies and lower wicks.
Holding above the key support around $3,300 is crucial for confirming the formation of an uptrend.
A breakout above the $3,365 high (wave (3) peak) would be a strong signal that wave (5) is in motion.
4. Suggested Trading Strategies:
Buy limit: Consider entries around the $3,310 – $3,320 support zone on a retest.
Buy breakout: Trigger entries if price breaks decisively above $3,365 with strong volume.
Take profit: Gradually scale out positions around the $3,680 – $3,726 area.
Stop loss: Place stops below the wave c bottom — under $3,245.
5. Conclusion:
XAUUSD is currently in a sensitive phase with a high probability of a bullish breakout. The Elliott Wave structure shows that there is still considerable upside potential. However, traders should maintain strict risk management, as wave (5) formations often involve significant price swings.
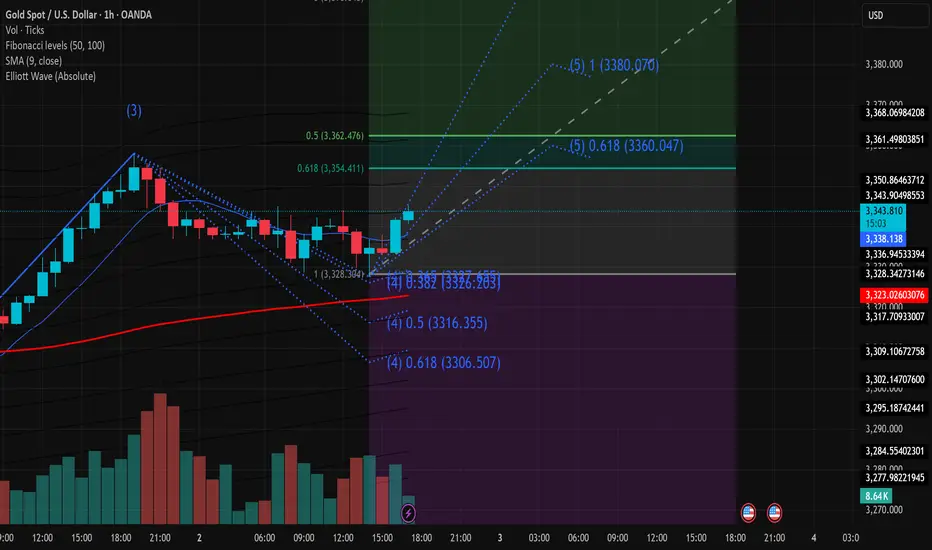
XAUUSD Technical Analysis – 02/07/2025On the 1-hour chart, Gold (XAUUSD) has just confirmed the completion of corrective wave (4) around the 3,328.3 zone, which aligns with the 1.0 Fibonacci level and EMA9 support. Currently, price is rebounding with increasing volume, signaling that buying momentum is returning.
Key Technical Highlights:
Elliott Wave Structure:
Wave (4) found support at 3,328.3.
Wave (5) targets are forming, with Fibonacci extensions pointing to:
0.618: 3,360.05
1.0: 3,380.07
=> These are critical resistance zones to watch.
Fibonacci Retracement Zones:
The current rebound is heading toward the 0.5 and 0.618 retracement levels of the previous down leg, located at 3,362.4 and 3,354.4 – short-term upside targets.
Volume Analysis:
Rising volume on bullish candles confirms a legitimate buying interest, supporting the upward movement.
EMA9 Breakout:
Price has broken above the EMA9 at 3,338.2, shifting short-term trend bias to bullish.
Suggested Trading Strategy:
Favor Buy on Dip entries near the 3,340–3,342 zone if a minor pullback occurs.
Short-term targets: 3,354 – 3,362
Extended target: 3,380
Suggested stop loss below 3,328.0 to manage risk.
Conclusion:
A bullish impulse is forming following the end of wave (4). If price holds above 3,340 and breaks through the nearby Fibonacci resistance levels, wave (5) could extend towards the 3,380 area. This is a pivotal moment to watch for a confirmed short-term uptrend.
I have shorted gold as expected and held on patientlyEven under the influence of the ADP data, which is bullish for the gold market, gold has not effectively broken through 3350, and even showed signs of falling back after rising several times. The resistance above is becoming more and more obvious, which may further weaken the market's bullish sentiment and confidence, thereby strengthening the dominance of the bears.
Although gold has not effectively fallen yet, from the perspective of the gold structure, even if gold wants to rise, it still needs to be backtested and support confirmed before rising, and the current retracement is far from enough, so gold still has a need for structural retracement; and before the NFP market, gold rose slowly but was far from enough to break upward, and there was no volume support, so the illusion of gold rising may be to lure and capture more bulls;
Therefore, out of caution, I try to avoid chasing gold at high levels; and I believe that shorting gold is still the first choice for short-term trading at present. And I have executed short trades in the 3340-3350 area according to the trading plan, and held it patiently. I hope that gold can retreat to the 3320-3310-3300 area as expected.
ADP data has been released, how to position gold in the future📰 News information:
1. ADP data, for reference of tomorrow's NFP data
2. Interest rate cuts and Powell's dovish comments
3. Geopolitical impact on the gold market
📈 Technical Analysis:
The ADP data was significantly bullish after it was released, but gold did not rise sharply in the short term. Instead, it touched the resistance of 3350 that we gave and then fell back. I also saw a lot of fake traders in the market who immediately told their brothers to go long and look towards 3380 after the ADP data was released. To be honest, I think these people are typical hindsight experts. If everyone is like this, then anyone can be called a trader, right?
Back to the topic, I still hold short orders at 3340-3350. In the short term, gold will fluctuate and be bearish to seek restorative support, so the best place to go long is to look at the retracement below, which will at least touch 3333-3323. If it falls below this support, it will go to 3315-3305. On the contrary, if it gets effective support at 3333-3323, then gold will rebound as expected to form a head and shoulders bottom.
🎯 Trading Points:
SELL 3340-3350-3355
TP 3333-3323-3315-3295
BUY 3335-3325
TP 3345-3355-3375
In addition to investment, life also includes poetry, distant places, and Allen. Facing the market is actually facing yourself, correcting your shortcomings, confronting your mistakes, and strictly disciplining yourself. I hope my analysis can help you🌐.
FXOPEN:XAUUSD PEPPERSTONE:XAUUSD FOREXCOM:XAUUSD FX:XAUUSD OANDA:XAUUSD TVC:GOLD

#XAUUSD: +2000 Swing Sell In Making! Get ReadyGold has dropped to the 3330 region but has now reversed and is currently trading at 3350. The next potential move could be at 3380, followed by 3400. Our sell entry is at 3400, where we believe the price will reverse. Our long-term view is that gold will head towards 3100, but our first target will be 3200. Please use accurate risk management when trading gold, as it can cause serious financial issues if not planned properly. This analysis does not guarantee any price movement.
Good luck and trade safely!
Team Setupsfx!
Gold is moving in a range-bound consolidation.The ADP employment data in the U.S. unexpectedly cooled down, with private sector employment dropping by 33,000 in June, far below the market expectation of an increase of 95,000. The previous value was revised down from 37,000 to 29,000, marking the largest single-month decline since March 2023. Meanwhile, the Challenger Enterprise Layoff Report showed that the number of layoffs in June was 48,000, with a monthly rate decrease of 48.84% and an annual rate decrease of 1.6%. Compared with the previous value of 93,800, it has significantly declined, indicating that the layoff pressure has eased. After the release of the ADP data, the U.S. Dollar Index fell sharply in the short term, and gold, as a safe-haven asset, rose rapidly. Gold showed a high-level consolidation trend. After repeatedly stabilizing in the 3,327 area, it rebounded and hit the resistance at around 3,351 U.S. dollars, lingering there. It is expected that the range consolidation of gold may face pressure.
you are currently struggling with losses,or are unsure which of the numerous trading strategies to follow,You have the option to join our VIP program. I will assist you and provide you with accurate trading signals, enabling you to navigate the financial markets with greater confidence and potentially achieve optimal trading results.
Trading Strategy:
buy@3330-3335
TP:3360-3365
Gold Trading Strategy February 7✏️As expected from the analysis, after the D1 candle showed buying pressure again, the price continued its uptrend yesterday and reached 3357.
Currently, the price is consolidating within a relatively wide sideways range, extending from 3328 to 3344.
A trend-following trading strategy will be set up when the price breaks out of this range.
The BUY signal is expected to bring good profits if the price retests the support.
The SELL signal at resistance is considered to look for rebound points in an uptrend.
📈 Key Levels
Breakout Range: 3344-3328
Support: 3310-3298
Resistance: 3368-3386
📊 Recommended Trade Setups
BUY: 3310-3308 | SL: 3305
SELL: 3368-3370 | SL: 3373
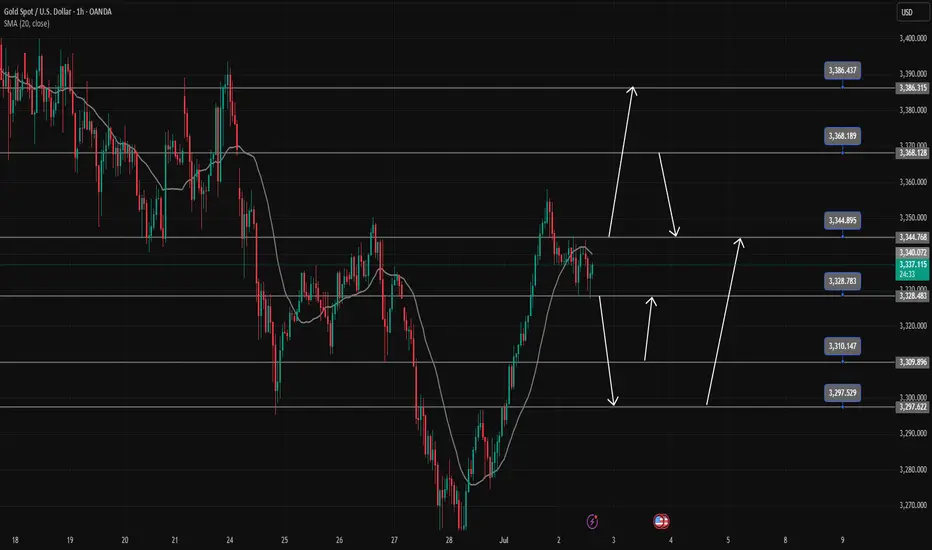
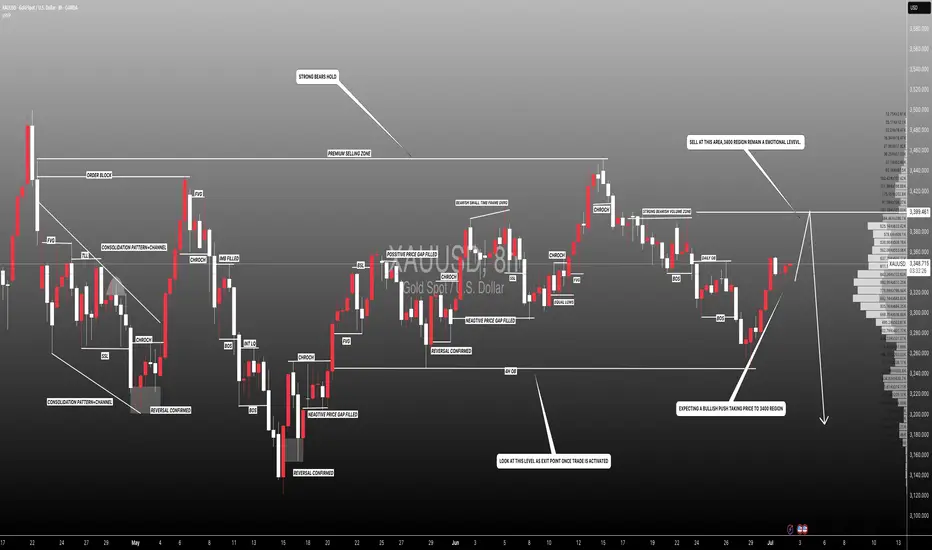
XAUUSD Analysis – July 2–3, 2025: Resistance Holds Gold is currently trading around 3,337 USD, having tested the 3,350 USD resistance zone without a successful breakout. The price remains under pressure from key macroeconomic factors:
- The Dollar Index (DXY) is stable above 106 – a sign of continued demand for the greenback, which weakens gold.
- U.S. 10-year Treasury yields hold around 4.35%, reinforcing the view that the Fed will keep interest rates high.
- The Core PCE report for June remains above the Fed’s 2% inflation target, decreasing expectations of a rate cut in Q3.
- Safe-haven demand is weak, as geopolitical tension in the Middle East and Eastern Europe remains subdued.
➡ Overall, these factors confirm that XAUUSD remains under bearish pressure in both the short and medium term, especially while key resistance remains intact.
1. Technical Analysis – XAUUSD on D1 Chart
- Price recently tested the 3,340 – 3,350 USD resistance zone, a confluence of:
Previous supply zone
- Fibonacci retracement 0.5–0.618 from 3,399 USD
- Key Change of Character (CHoCH) level
- RSI is forming a mild bearish divergence, signaling weakening bullish momentum.
- EMA20 and EMA50 are both sloping downward – confirming the prevailing bearish trend.
This setup is typical of a Sell on Rally pattern, with each retracement being rejected at strong resistance.
2. Key Technical Zones to Watch
Technical Role
- 3,350 – 3,340 Major resistance (Fibo 0.5–0.618 + supply + CHoCH)
- 3,294 – 3,285 Nearest support – previously a resistance-turned-support
- 3,255 – 3,235 Short-term target zone – June low
- 3,223 – 3,205 Strong medium-term support – April low + extended Fibo
3. Suggested Trade Setup
Preferred Scenario: SELL below 3,350
Entry: 3,345 – 3,347
Stop Loss: 3,351
Take Profit 1: 3,335
Take Profit 2: 3,330
Take Profit 3: 3,320
Ps : XAUUSD is retesting a major resistance zone without macro or technical catalysts for a sustained breakout. The best approach remains to sell at resistance and take profit near support, in alignment with the ongoing bearish trend.
The strategy will be updated regularly – don’t forget to save and follow to stay ahead of market opportunities.
The analysis was provided by @Henrybillion
As expected, it will fall and form a head and shoulders bottom📰 News information:
1. ADP data, for reference of tomorrow's NFP data
2. Interest rate cuts and Powell's dovish comments
3. Geopolitical impact on the gold market
📈 Technical Analysis:
Yesterday we expected gold to retreat to the 3330-3320 area. Today, gold hit a low of around 3328 during the Asian session, which is in line with our judgment of the market trend. In the short term, gold may still fall. First, it may test the 3323 support line. If it falls back to this position during the day, you can try to go long. In the short term, focus on the 3315-3305 long-short dividing line below. If gold gets effective support below, it is expected to form a head and shoulders bottom pattern. The short-term decline will accumulate momentum for the future rise. Pay attention to the ADP data during the NY period
🎯 Trading Points:
BUY 3323-3315-3305
TP 3340-3350-3360-3375
In addition to investment, life also includes poetry, distant places, and Allen. Facing the market is actually facing yourself, correcting your shortcomings, confronting your mistakes, and strictly disciplining yourself. I hope my analysis can help you🌐.
FXOPEN:XAUUSD PEPPERSTONE:XAUUSD FOREXCOM:XAUUSD FX:XAUUSD OANDA:XAUUSD TVC:GOLD
Exclusive trading strategy, short gold!From the current gold structure, we can see that gold still needs to continue to retest the 3320-3310, or even the 3305-3295 area; so in the short term, we can still seize the opportunity to consider shorting gold in batches in the 3340-3360 area.
Trading signal:
@3340-3360 Sell, TP:3325-3315-3305
A reliable trader must have an explanation for everything and respond to everything. I have always been committed to the market and insist on writing the most useful core strategies for traders. The transaction details can be seen in the channel!
How do we plan before ADP and NFP?📰 News information:
1. ADP data, for reference of tomorrow's NFP data
2. Interest rate cuts and Powell's dovish comments
3. Geopolitical impact on the gold market
📈 Technical Analysis:
The market will continue to fluctuate before the ADP data, and the market will continue to rise after the adjustment. In the 4H cycle, the upper rail of the pressure is temporarily suspended, and the Bollinger Bands also close. This is why I emphasize the need to pay attention to the 3323 support line below. At present, gold rebounded, I think it will touch 3348 at most, that is, it rebounded to 50%. Therefore, before the ADP data, I still hold the position of 3340-3350 for shorting, and find support for long at 3325-3315 below. I have marked the pattern of head and shoulders bottom in the figure. I have been engaged in spot, futures, foreign exchange and other transactions for many years. My analysis ideas can be referred to by brothers
🎯 Trading Points:
SELL 3340-3350
TP 3330-3325-3315-3295
BUY 3323-3315-3305
TP 3340-3350-3360-3375
In addition to investment, life also includes poetry, distant places, and Allen. Facing the market is actually facing yourself, correcting your shortcomings, confronting your mistakes, and strictly disciplining yourself. I hope my analysis can help you🌐.
TVC:GOLD OANDA:XAUUSD FX:XAUUSD FOREXCOM:XAUUSD PEPPERSTONE:XAUUSD FXOPEN:XAUUSD

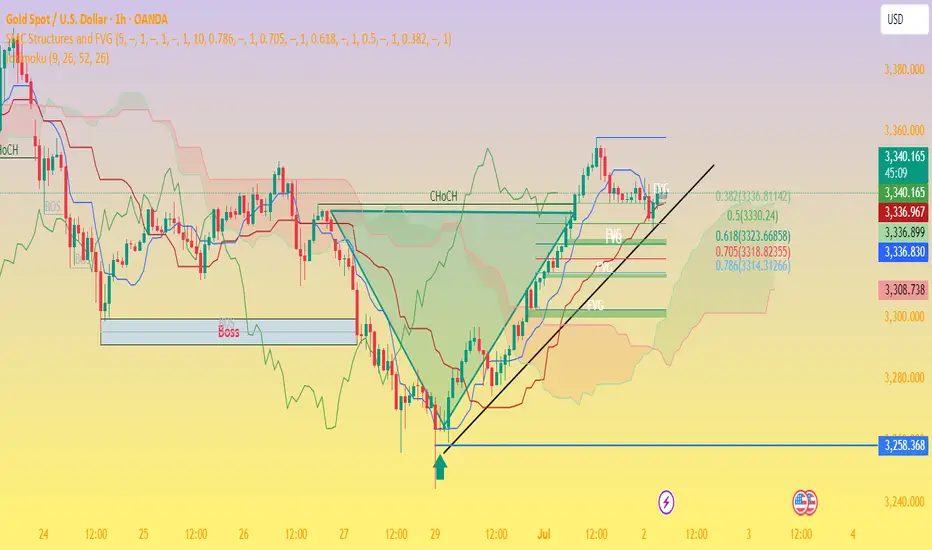
Gold Price Analysis – Bullish Momentum Holds Above FVGs🧠 Chart Breakdown:
Instrument: Gold Spot (XAU/USD)
Timeframe: 1H
Current Price: $3,340
Trend: Short-term uptrend intact
🔑 Key Observations:
Ch.o.Ch Confirmed (Change of Character):
The break above the previous structure high confirmed a bullish market structure shift.
Fair Value Gaps (FVG):
Multiple FVGs exist between $3,320 – $3,335, acting as potential demand zones and support levels.
Fibonacci Retracement:
Price is respecting the 0.382–0.5 levels ($3,336 – $3,330) well so far.
Below this, the 0.618 level at $3,325 is the next strong confluence zone.
Trendline Support:
The price is testing a rising trendline, adding dynamic support around the current level.
Ichimoku Cloud:
Price is above the cloud, which supports the bullish bias.
Conversion line (blue) and base line (red) are bullishly aligned.
📉 Possible Next Moves:
✅ Bullish Scenario:
Price bounces from current levels or slightly lower ($3,336–$3,330) and retests the recent high (~$3,355).
Breakout above $3,355 could open the door to $3,370+.
⚠️ Bearish Scenario:
If price breaks below $3,330 and the trendline, expect deeper pullbacks to:
$3,325 (0.618 Fib)
Then possibly $3,308 FVG support or $3,258 major demand zone.
📌 Conclusion:
Gold is still respecting bullish market structure with healthy pullbacks into support zones. As long as the price stays above $3,325, the bullish outlook remains valid. Watch for bullish reaction near the FVGs or a break above $3,355 to confirm upside continuation.
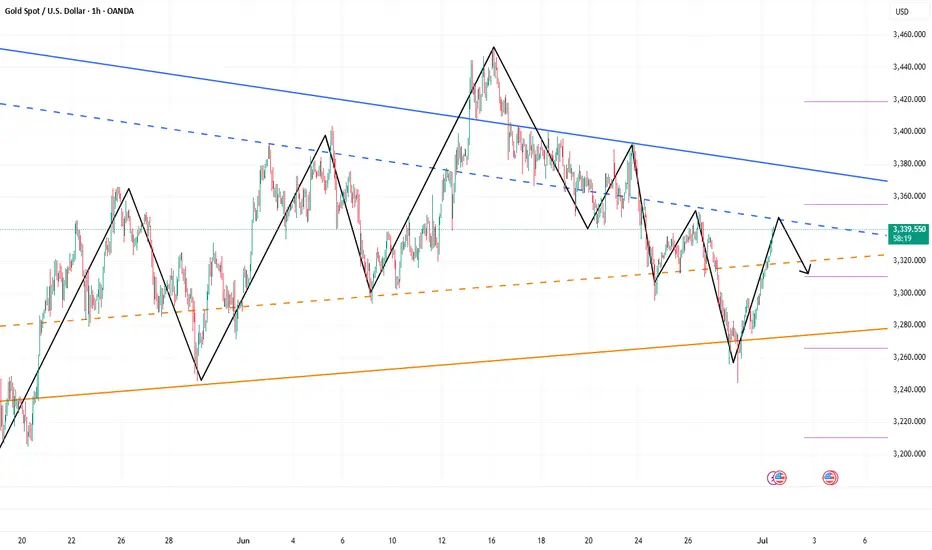
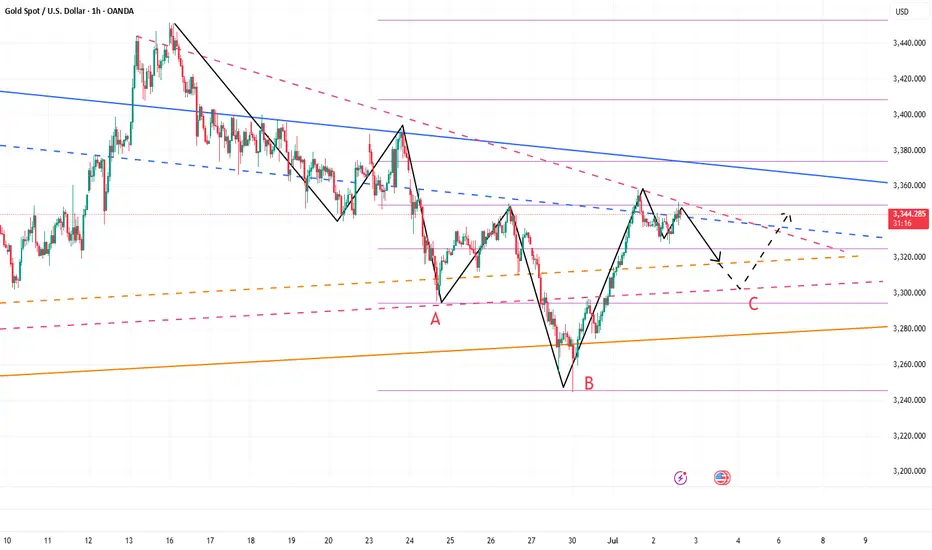
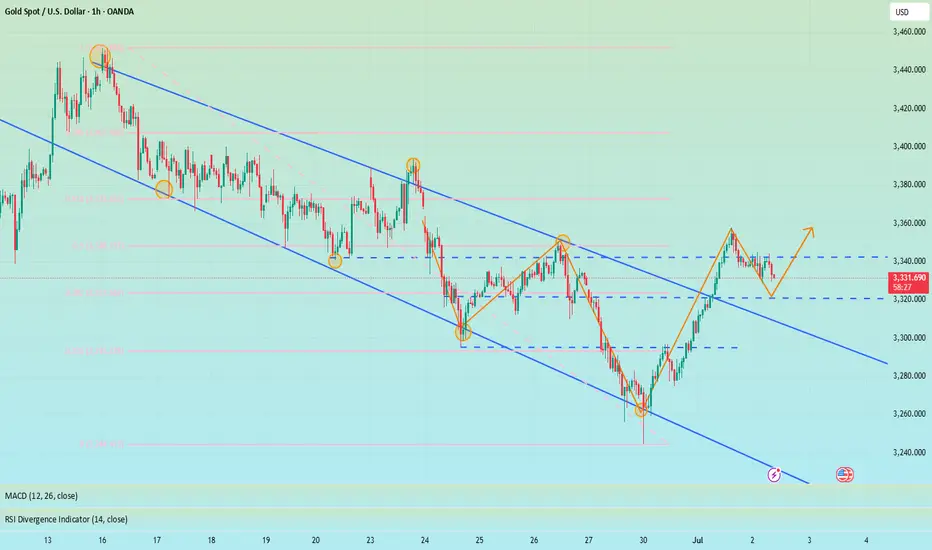
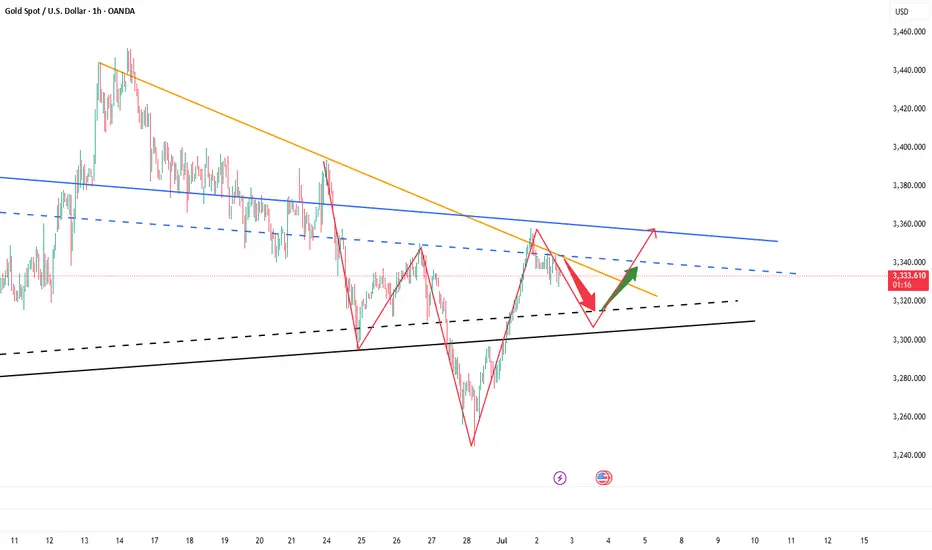
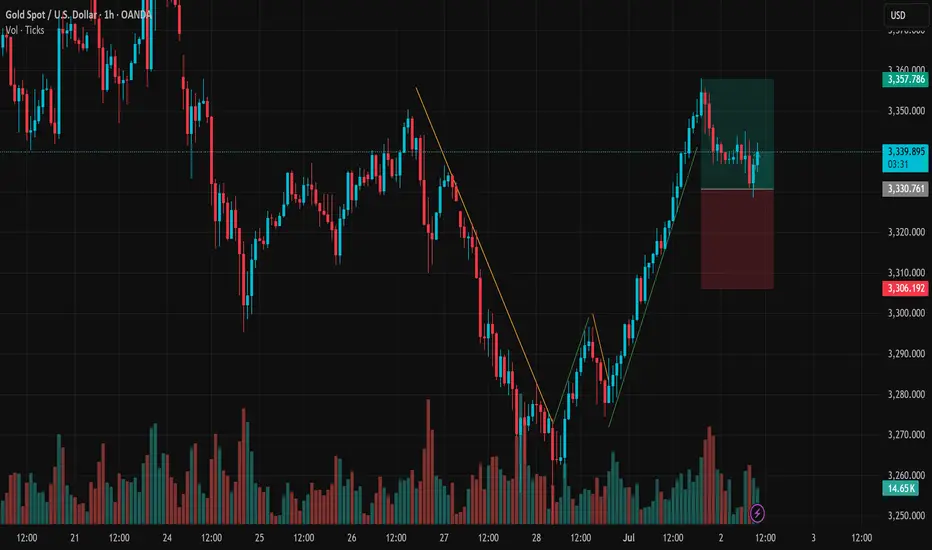
Gold breaks trend – bullish wave returnsIn the most recent trading session, gold (XAUUSD) has made a strong rebound from the key support zone around $3,263 and is now approaching a short-term resistance near $3,347 – signaling a potential continuation of the bullish momentum in the short term.
1. Price Structure & Market Behavior After reaching a local top around $3,347–$3,350, gold entered a clear downtrend.
However, the breakout of the descending trendline (yellow line) with solid bullish candles is a strong reversal signal.
The market has formed higher highs and higher lows with strong bullish candles, confirming a V-shape reversal pattern from the bottom zone.
2. Key Support & Resistance Levels Immediate resistance: $3,347–$3,350 – previous rejection zone.
Short-term support: $3,308 – newly broken resistance now acting as support.
Major support: $3,263 – previous low with strong bullish bounce, highlighting significant buyer interest.
3. Suggested Trading Strategy Given the strong breakout and bullish trend structure, traders may consider a buy-the-dip strategy around $3,308–$3,315 on potential pullbacks.
Stop-loss should be placed below $3,263 to protect against false breakouts.
Short-term take-profit targets can be set at $3,350–$3,360. If this level breaks, extended targets could reach $3,375.
Volume & Momentum Volume is increasing along with price, confirming strong buyer participation.
Bullish candles are closing near highs, showing weak selling pressure and suggesting the uptrend may continue.
Conclusion: Gold has resumed a short-term uptrend after breaking its previous downtrend. Traders should favor bullish setups and look for pullbacks to enter at better prices. Watch the $3,347 zone closely – if gold breaks and holds above it, further upside is likely.
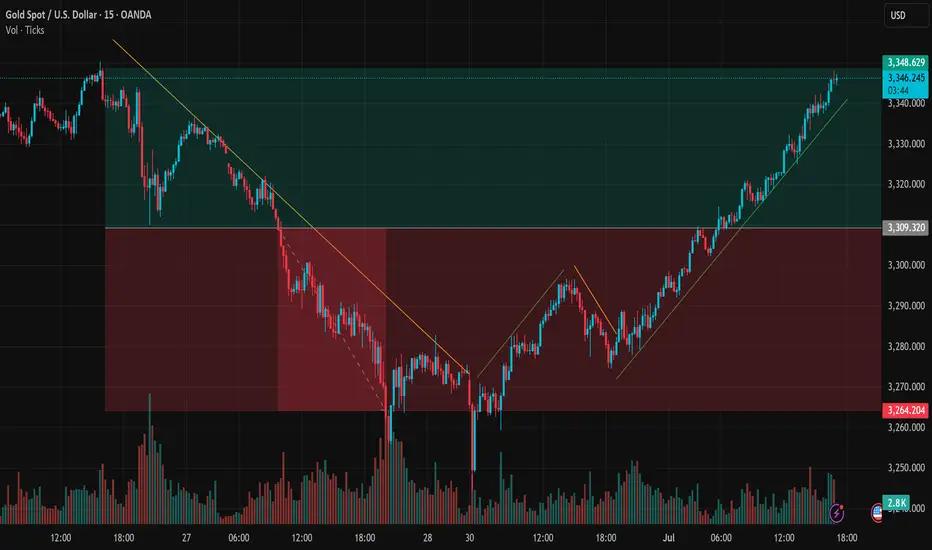
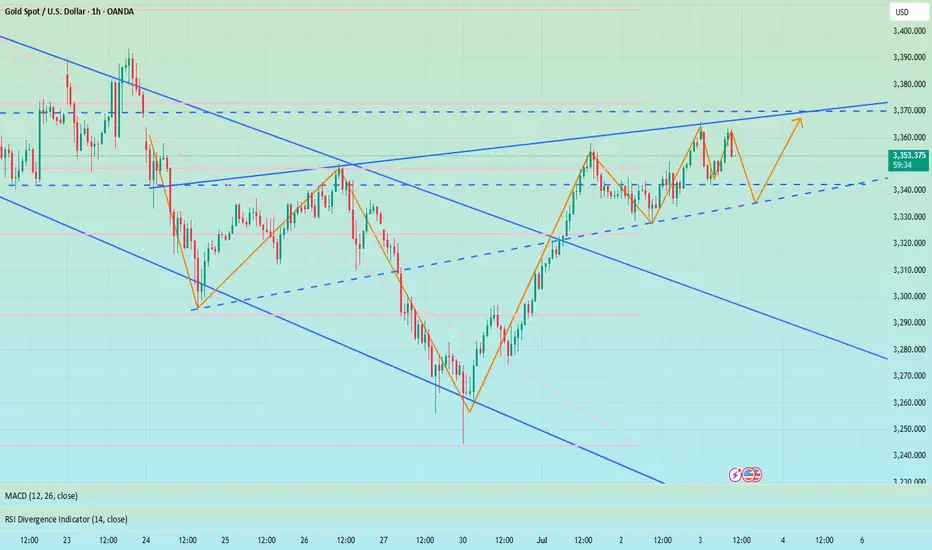
XAUUSD Consolidates Near Resistance After Strong RallyGold (XAUUSD) on the 1H timeframe has staged a solid bullish reversal from the 3,263 USD support zone, reaching a recent high of 3,357 USD. Now, the market is entering a consolidation phase just below this resistance. This price action may be setting the stage for the next directional move.
After breaking a clear descending trendline, XAUUSD formed a two-leg bullish structure with higher highs and higher lows – a classic signal of trend reversal. The rally paused around 3,357 USD, a previous swing high acting as short-term resistance. The price is currently ranging between 3,330–3,340 USD with decreasing volume, indicating a potential accumulation zone rather than distribution.
Resistance: 3,357 USD – breakout target
Support zone: 3,330–3,335 USD – short-term demand zone
Invalidation level: 3,306 USD – below this, bullish structure breaks
As long as price holds above 3,330 USD, a bullish continuation remains the primary scenario. Traders can look for pullbacks or bullish patterns within this zone for potential long entries. A break and close above 3,357 USD would confirm strength, opening the path toward 3,370 or even 3,390 USD.
Stop-loss should be placed below 3,306 USD to manage risk if the breakout fails. If price loses the 3,306 support decisively, the setup turns neutral to bearish short-term.
The breakout leg was supported by rising volume, validating real demand. Current low-volume sideways movement suggests the market is “cooling off” after the rally, often a precursor to the next breakout move. Watching for bullish engulfing candles or volume spikes near support can offer trade confirmation.
Conclusion:
Gold remains in a bullish technical structure on the 1H chart. The current range between 3,330–3,357 USD is key. If price breaks above resistance, we could see strong continuation toward higher levels. Traders should stay patient, manage risk carefully, and let price action confirm the next move.
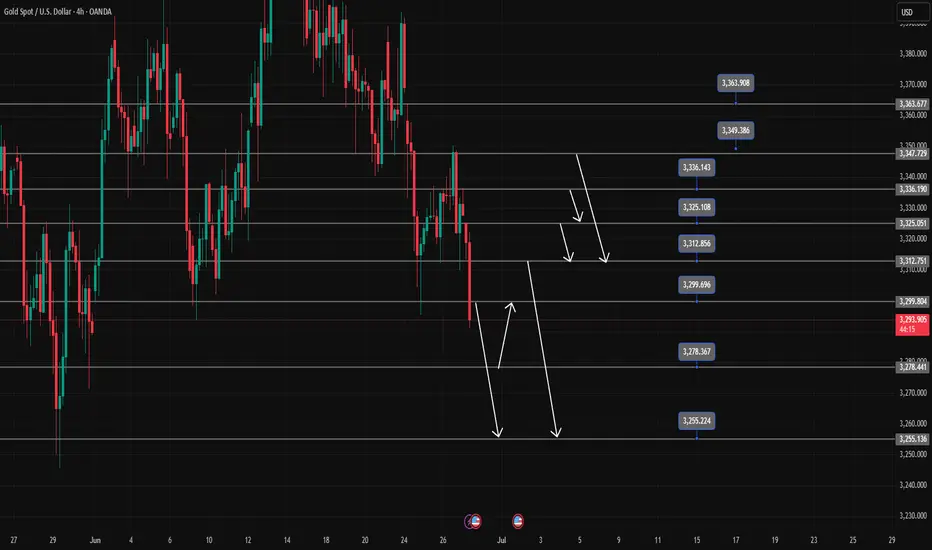
Gold Trading Strategy June 27✏️The price reaction at 3348 forms a sustainable bearish structure. 3296 is an important zone when broken, it will continue to fall deeply without any recovery on Friday.
Today the downtrend will encounter less resistance than the uptrend. Therefore, it is not difficult to touch the support zones of 3278 and 3255.
Any recovery in the price in the European session is considered a good opportunity for a Sell signal towards the target of 3278 and 3255.
As analyzed, the SELL zone today is noted at many resistance zones and consider the price reaction for the SELL signals.
📈 Key Levels
Break out: 3296
Support: 3278-3255
Resistance: 3300-3312-3325-3336-3348-3363
📊 Recommended Trade Setups
BUY 3278-3276 SL 3272
SELL 3325-3327 SL 3330
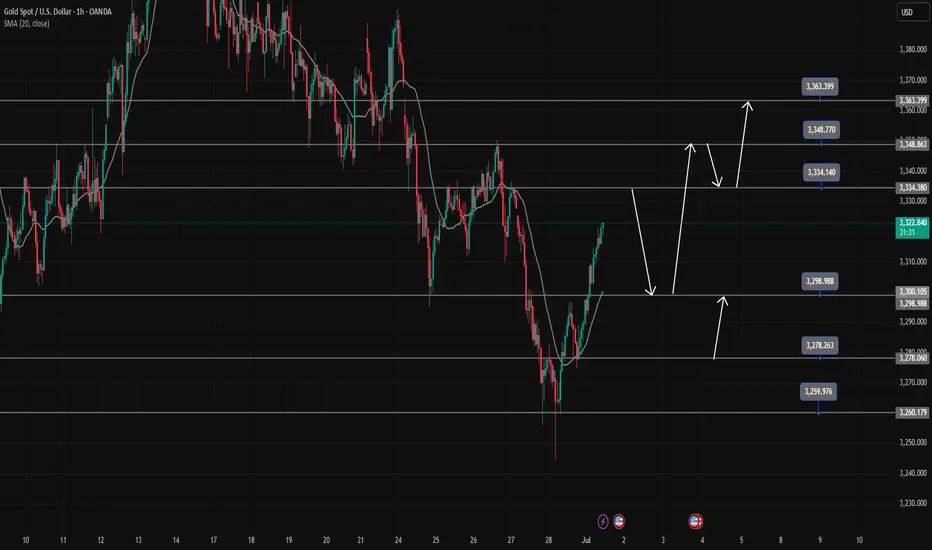
Gold Trading Strategy July 1✏️ D1 candle has a bullish recovery when closing above 50% of last Friday's decline.The bullish wave of Gold is forming, heading back to the GAP 3363 zone.Today's main strategy is to wait for BUY if there is a retest of 3300. Reaction sell strategy is focused on resistance zones with not too long expectations.
📈 Key Levels
Support 3300- 3379- 3360
Resistance 3334-3348-3363
📊 Recommended Trade Setups
BUY GOLD 3300-3298 Stoploss 3295
SELL GOLD 3348-3350 Stoploss 3353
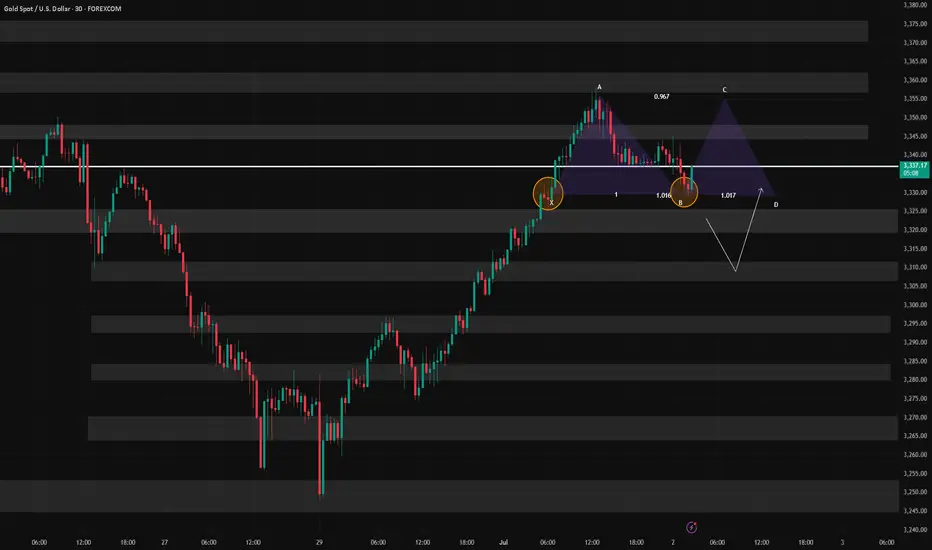
7/2 Trapped Orders from Yesterday Turned ProfitableGood morning, everyone!
Yesterday’s early-entry gold short position encountered some temporary drawdown, but thanks to flexible adjustments, the trade has now moved into profit overall.
Currently, the price is hovering near a key support area. Based on the 1H and 2H charts, there is still room for further downside. At this point, there are two strategic options:
Close the position to lock in current profits;
Hold the position and wait for further decline, keeping in mind that if support holds, the price may rebound back toward the 3350 level, introducing some risk.
You can decide whether to stay in the trade or exit, depending on your risk tolerance and trading plan.
Gold may collapse again, don't get buried in it!In the past two trading days, gold began to rebound from a low of around 3245, and has now rebounded to around 3358, with a rebound of up to $113. Moreover, there has been no significant retracement during this rebound, indicating that gold has little intention to fall, and may even continue to rise.
But for me, gold rebounded from 3245. Even if a double bottom structure with 3275 as the secondary low was constructed on the technical level, it should not be enough for gold to rebound more than $113 in just two days as it fell below many supports in the early stage and bullish confidence suffered a serious blow. Moreover, it happened before the uncertain news of the NFP market.
So I have to consider that the market did it deliberately, and its primary purpose was to kill a large number of short chips in the market and lure more attracted long chips; secondly, the sharp rise before the NFP market may be to reserve room for the NFP market to fall in advance; in addition, I have to consider that the US dollar has fallen to a three-year low. If it continues to fall, there may be a global crisis of confidence in the US dollar, and the oversold rebound demand for the US dollar will also suppress gold.
Therefore, I still will not advocate chasing the rise of gold for the time being; on the contrary, I will actively seek opportunities to short gold in the 3350-3370 area; and once gold turns to a downward trend again, it may at least test the 3325-3315-3305 area downward in the short term.
Short gold, it may retreat again after reaching 3340-3350Although the rebound in gold has exceeded my expectations to a certain extent, it is obviously not a good time to chase the rise in gold. The gold rebound mainly benefits from Trump's repeated requests for the Federal Reserve to cut interest rates, which has led to the continued weakness of the US dollar. In fact, we can clearly see that the gold rebound is not supported by trading volume, and the rebound without volume may face the risk of collapse again at any time. So I don't advocate chasing long gold at present.
Currently, gold has rebounded to around 3339, almost recovering most of the losses in the previous downward wave (the starting point of the previous wave was 3350), but gold is still under pressure in the 3340-3350-3355 area. In the absence of volume support, gold may fall again after touching this resistance area.
Therefore, shorting gold is still the first choice for short-term trading at present; at least make sure not to chase high!
You can consider shorting gold with the 3340-3350-3355 area as resistance, and look at the target: 3320-3310-3300