Gold Breaks Trendline – Deeper Correction Ahead?Gold (XAUUSD) has just broken below its short-term ascending trendline formed since mid-May. The candle closed around $3,333, confirming a bearish engulfing pattern and highlighting growing selling pressure after multiple failed attempts to reclaim the $3,383–$3,399 resistance zone (Fibonacci 0.5–0.618).
Key Levels to Watch:
- Immediate Support: $3,315 (tested twice before)
- Main Resistance: $3,383–$3,399 (Fibonacci zone)
- Major Resistance: $3,435–$3,451 (May high zone)
If $3,315 fails to hold, gold could retest $3,285–$3,270, with deeper downside toward $3,222.
Technical Overview:
- The ascending trendline is now broken.
- Bearish engulfing candlestick confirms momentum shift.
- Price rejected sharply from Fibonacci 0.618 – $3,399.
Trade Setups to Consider:
Sell Opportunity: Short near $3,360–$3,383; stop loss above $3,400; targets at $3,315 and $3,270.
Speculative Buy: Watch for reversal patterns near $3,315; stop loss below $3,300; short-term target $3,350–$3,365.
Caution: This week brings major U.S. economic events (GDP, PCE, Fed speeches). Trade reactively, manage risk tightly, and avoid overleveraging.
Xauusdshort
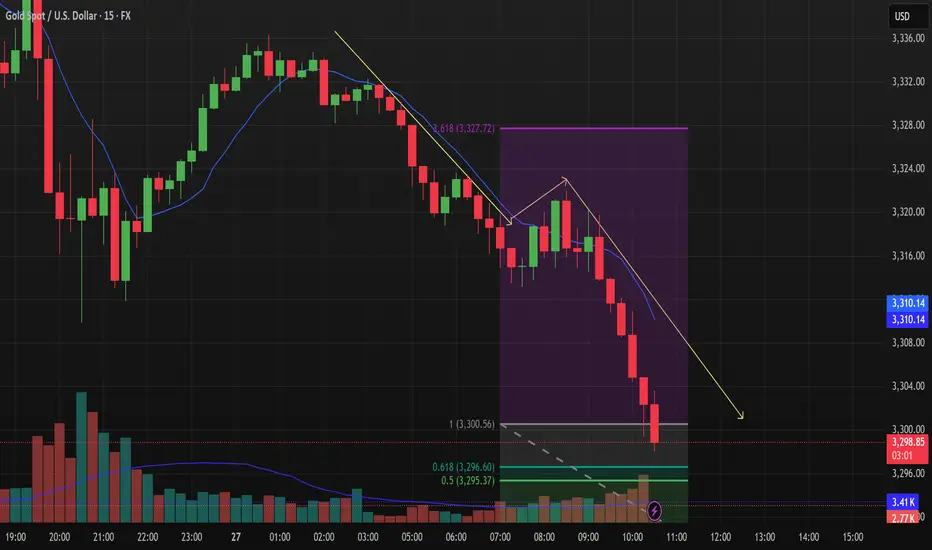
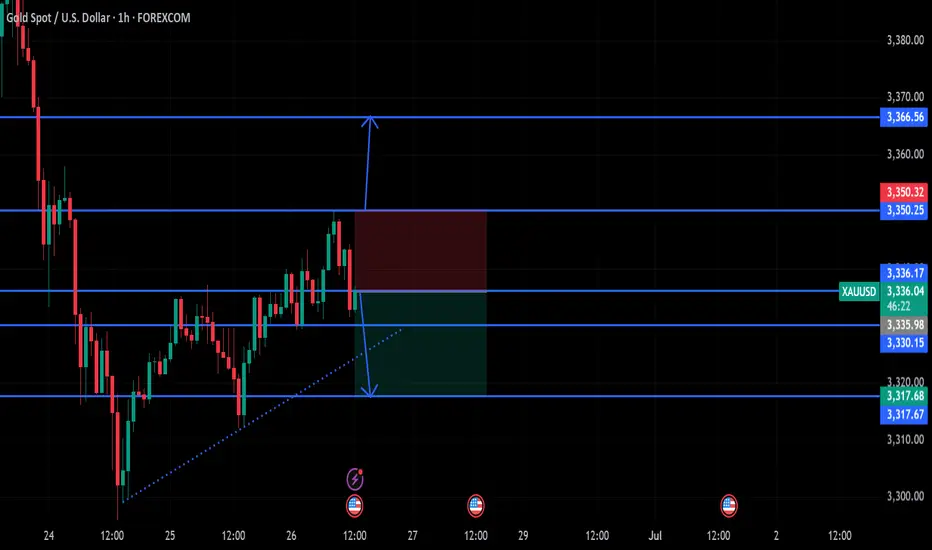
XAUUSD: Bearish Trend, Key Support at $3,295Market Overview
In today’s trading session (26/06/2025), XAUUSD shows continued downward momentum. Gold prices are currently hovering around $3,302.05, with a slight drop of 0.01%. The intraday price range has been tight, between $3,330.00 and $3,350.00, indicating a battle between the buyers and sellers around the short-term equilibrium zone.
Recent price action suggests that after a brief recovery, gold is once again encountering resistance at the $3,350.00 level. In the coming hours, a decisive breakout either above this resistance or below current support will dictate the market’s next move.
Key Technical Levels to Watch:
Support Levels: The first significant support is at the $3,295.37 level (50% Fibonacci retracement), with the next support at $3,296.60 (61.8% Fibonacci retracement), followed by a crucial level at $3,300.56.
Resistance Levels: The primary resistance area lies around $3,350.00, with the second resistance at $3,327.72, which coincides with the 3.618 extension of the previous price swing.
Price Action Analysis
As seen in the chart, XAUUSD is currently trading below both the 50-period (blue) and 200-period (yellow) moving averages, indicating a strong bearish trend. The price action is forming a series of lower lows and lower highs, reinforcing the downtrend.
Bearish Trend Continuation: A break below the support at $3,295.37 could signal further downside towards $3,290.00 or even $3,275.00. The yellow trendline indicates the overall bearish direction, and any failure to hold above $3,300.00 could trigger additional selling pressure.
Fibonacci Retracement Levels: Price is testing the 50% and 61.8% Fibonacci levels. A rejection at these levels could cause a pullback towards lower support zones, confirming the bearish outlook for the short term.
Volume Analysis
The volume chart shows relatively low volatility, with decreasing volume during the price pullbacks. This suggests that there is not enough buying interest to push the price higher, and the market may be more inclined towards bearish continuation in the near term.
Market Sentiment
Currently, the market is undecided. The recent price action suggests that traders are waiting for a confirmation of direction. The next few hours are critical in determining if the downtrend will continue or if we will see a short-term bounce at one of the key support levels.
Trading Strategy
Short Position: A break below $3,295.37 would be an excellent opportunity to short XAUUSD with a target at $3,290.00, and further down to $3,275.00.
Long Position: Only consider long positions if XAUUSD manages to break above $3,350.00 decisively, with the next target near $3,375.00.
Conclusion
XAUUSD remains under pressure, and unless there’s a strong reversal at support levels, the bearish momentum could continue in the short term. Traders should monitor the key levels mentioned above closely to adjust positions accordingly.
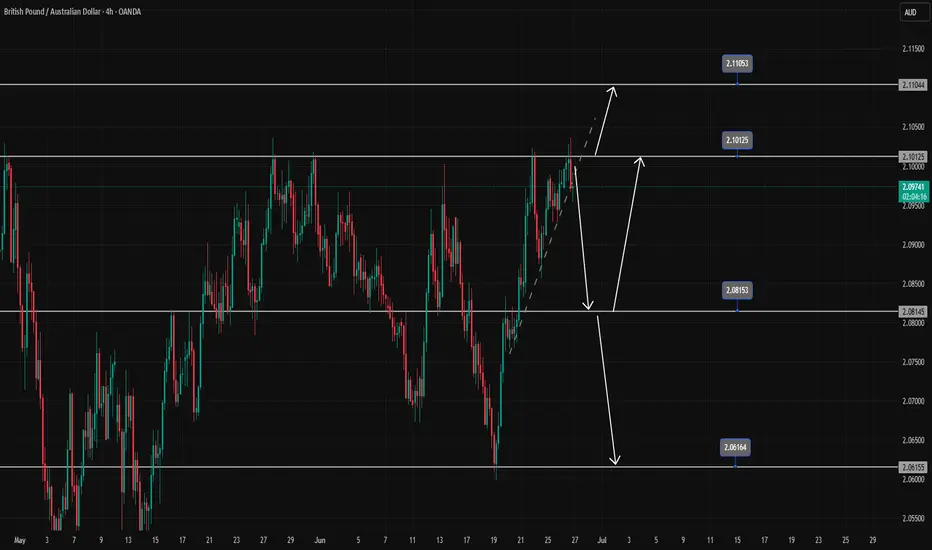
GBPAUD Refuses to Make New Weekly HighsFailed to trade above the resistance zone of 2.101
Currently, the weak reaction at the trendline suggests that it will be difficult for the pair to push higher.
If the trendline breaks, the downtrend may extend toward 2.08100 — a level where buyers are likely to step back into the market.
We are waiting for further price action around the 2.081 support zone to look for new trade signals.
If this level is broken, 2.061 will become the next target for all SELL positions.
On the contrary, if the price bounces from 2.081, strong buying momentum could emerge and potentially break through the 2.101 resistance, targeting 2.110.
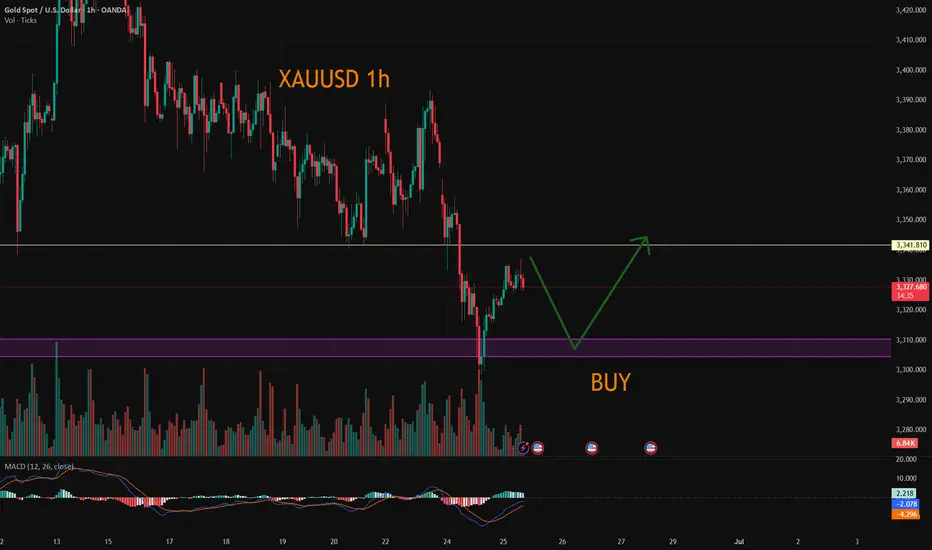
Bulls and bears are anxious? Rebound continues to empty📰 Impact of news:
1. Initial unemployment claims data
📈 Market analysis:
Gold is in a sideways consolidation near 3320 in the short term. The market has no clear direction for the time being, and the long and short positions are in a tug-of-war. The hourly line rebounded to 3328 and then fell back again, suggesting that there is still room for short-term retracement. The current operation needs to focus on key points: if it rebounds to the 3320-3330 resistance area, you can consider entering short positions again. If the market continues to decline, focus on the 3300-3290 support range. If it stabilizes, long orders can be arranged. The overall idea is to maintain a volatile market. Before effectively breaking through 3350 or falling below 3290, high-altitude and low-multiple is still the main strategy.
🏅 Trading strategies:
SELL 3320-3330
TP 3310-3300-3290
BUY 3310-3300
TP 3320-3330-3340
If you agree with this view, or have a better idea, please leave a message in the comment area. I look forward to hearing different voices.
OANDA:XAUUSD FX:XAUUSD FOREXCOM:XAUUSD FXOPEN:XAUUSD TVC:GOLD
6/25 Gold Analysis and Trading ViewGood morning, everyone!
Gold experienced a sharp decline yesterday. Technically, the conditions for a rebound are in place, but since a solid bottom structure has yet to form, a retest to the downside is likely during today’s session.
Key levels to watch:
Resistance zone: 3336–3348
Support zones: Primary support at 3313–3303, with additional support around 3296–3282
Today’s overall strategy remains buying on dips as the primary approach, with short opportunities near resistance as a secondary option.
Key scenario to monitor:
If the price drops to around 3280 but fails to rebound toward 3336, and the daily close ends below 3300, then the buy-on-dip strategy will likely continue into tomorrow.

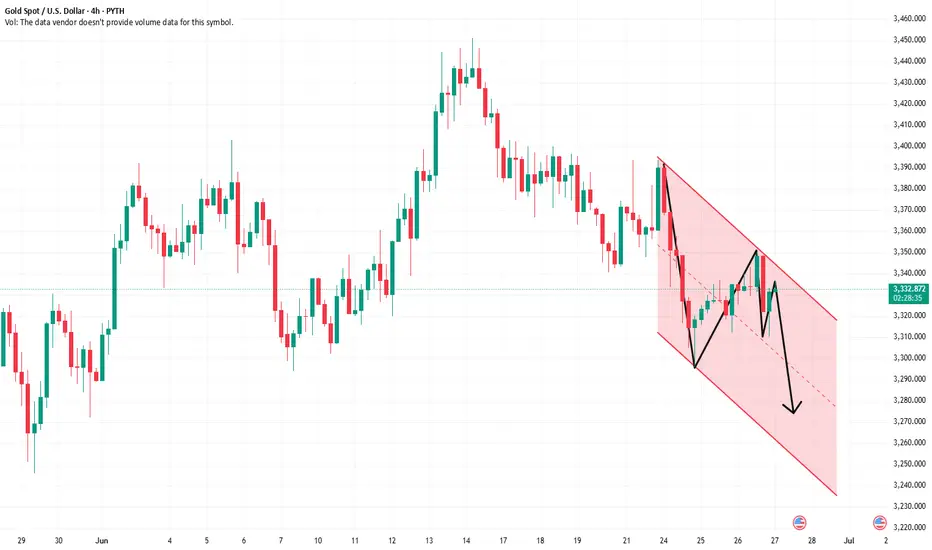
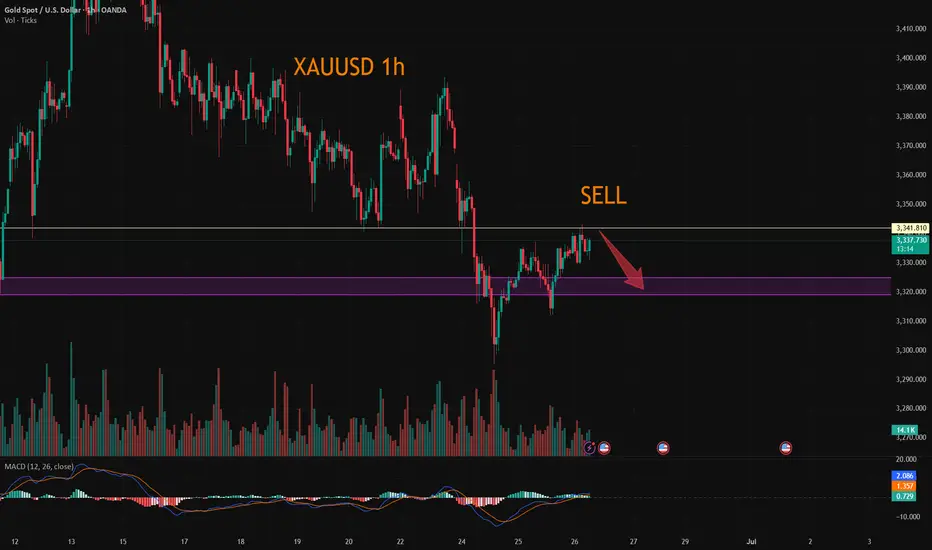
Gold: Resistance Validated, Short at 3340-3350 Tomorrow📈 Gold Trading Recap & Tomorrow's Strategy: Resistance Holds, Short Opportunities Persist
💎 Today's newly updated live short strategy hit the TP target successfully! As mentioned earlier, when gold failed to break the support level, we anticipated it to range around 3330—today's trades were precisely centered on this logic. The 3350 resistance was also validated firmly during the session.
💎 Expect further upside in tomorrow's Asian session—recommend continuing short positions within the 3340-3350 range 🚀
🚀 Sell@3350 - 3345
🚀 TP 3335 - 3325 - 3315
Accurate signals are updated every day 📈 If you encounter any problems during trading, these signals can serve as your reliable guide 🧭 Feel free to refer to them! I sincerely hope they'll be of great help to you 🌟 👇
Still bearish!If the short-term bull lifeline 3330 is lost, the trend will be bearish again. The first pressure point above is 3350-the secondary top 3345, and then the 3332-35 area. If the price bulls regain 3335 again, then the operation should be carried out in the range of 3350-3310. It is not recommended to enter the market at the halfway point because it is easy to be washed out. If the daily K line closes below 3340, then 3332-35 is the best position at present. At present, the price is bearish below 40, and it can rely on 3332-31 to continue to be bearish. The target is 3310 and 3924.
XAUUSD/GOLDThe bullish trend has opened. After the retracement is confirmed, continue to buy and wait for the market to rise and fill the gap.
XAUUSD:Today's trading strategy
On Tuesday, the news that Trump announced a ceasefire between Iran and Israel dampened the risk aversion sentiment. Subsequently, the news that expectations of interest rate cuts had slowed down led to a further decline in gold prices. During the trading session, it once fell below the 3,300 mark. After the impact of the news weakened, it eventually rebounded to around 3,323, approaching the position where we first entered the market yesterday. Currently, there is no logic in the market. From a technical perspective, The resistance level above is at 3340-45, and the support level below is at 3305-10. We can conduct transactions around this range
Trading strategy:
SELL@3340-45
TP:3310-04
BUY@3305-10
TP:3335-40
More detailed strategies and trading will be notified here ↗↗↗
Keep updated, come to "get" ↗↗↗
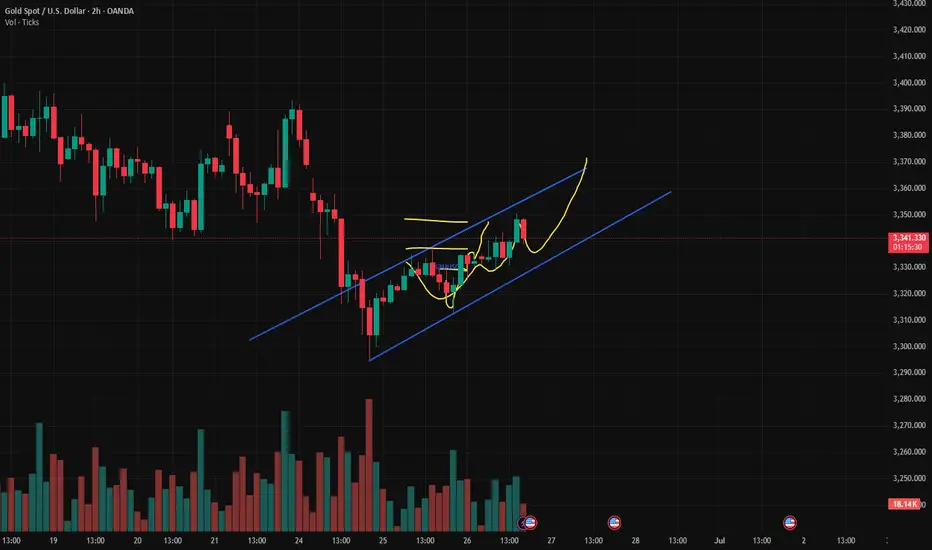
Seize the rebound opportunity and prepare to short goldGold continued to rebound as expected and has now extended to above 3340. In the short term, it tends to fluctuate and rise. In the previous trading idea overnight, I emphasized that everyone should not take the risk of shorting gold near 3330. Now it seems that this reminder is completely necessary. Although gold continues to rebound, the overall performance of the bulls is still not strong, and the upper side is still under pressure in the 3350-3360-3370 area. So I still advocate that you can consider shorting gold in the 3350-3360 area after the rebound.
The Premium privilege of my account will end in 10 hours. Friends in the channel have already made a lot of money by following my trading strategy. Friends who have not joined yet can join and receive the latest trading strategies and trading signals as soon as possible to escort your trading!
Gold rebounds under pressure, continue to go short.In the early morning, gold directly continued its bullish correction pattern. In the European session, it reached around 3336 at the highest, then continued to pull back in the US session, hitting around 3312 at the lowest and temporarily stopping there. It showed the intention to start a second rebound correction and closed at 3332. Opening at 3333, it rebounded and has oscillated near the highest of 3340 so far. The upper resistance to pay attention to is at 3342-48. If it fails to rebound, break through and stand firm above, the gold bears still have room for a pullback. The recent market trend is basically consistent - bottoming out and rebounding. In operation, continue to maintain the strategy of shorting when under pressure.
you are currently struggling with losses,or are unsure which of the numerous trading strategies to follow,You have the option to join our VIP program. I will assist you and provide you with accurate trading signals, enabling you to navigate the financial markets with greater confidence and potentially achieve optimal trading results.
Trading Strategy:
sell@3335-3340
TP:3300-3295
Gold fluctuates at high levels, intraday trading points📰 Impact of news:
1. Initial unemployment claims data
📈 Market analysis:
Gold has begun to show signs of bottoming out in the short term in the past two days. Since the daily line bottomed out and pulled up, the daily line closed positive yesterday, and the bulls began to counterattack, and the 1H low was rising. If it doesn't fall further in the short term, it will most likely bottom out and rebound. The upper pressure is at the Bollinger middle track of 3355, which is also the high point of Tuesday's decline. If gold breaks and stabilizes at this price, it will have a larger upward space, and the upper side will look at 3385. In the 4H chart, MACD temporarily forms a golden cross, which is a bullish signal; but the BOLL track pressure is still there, and gold bears still have momentum in the short term. Therefore, on the whole, in the short term, gold should pay attention to the 3350-3360 resistance above. If it encounters resistance under pressure here, it can consider shorting. Pay attention to the 3330-3320 support area below.
🏅 Trading strategies:
SELL 3350-3360
TP 3340-3330-3320
BUY 3330-3320
TP 3340-3350
If you agree with this view, or have a better idea, please leave a message in the comment area. I look forward to hearing different voices.
TVC:GOLD FXOPEN:XAUUSD FOREXCOM:XAUUSD FX:XAUUSD OANDA:XAUUSD
#XAUUSD #GOLD 30Min 📉📈 #XAUUSD 30m Analysis – Dual Setup Scenario
We’re monitoring two potential trade setups depending on how price reacts at key levels:
🔴 Sell Setup:
Price is entering a Sell-Side Order Block Zone between 3350–3360, aligned with a Fair Value Gap (FVG). This premium zone is likely to act as strong resistance, with potential rejection targeting downside liquidity near 3310 — an ideal area for short positions.
🟢 Buy Setup:
If price sweeps below and taps into the Liquidity Zone / Demand Area around 3305–3311, we’ll watch for a bullish reversal from this discount zone. This area offers a favorable setup for long entries, aligning with institutional buying levels.
📌 Be sure to mark these key zones on your chart for enhanced clarity and execution.
💬 What’s your outlook on Gold? Share your thoughts below 👇

XAUUSD:Short sell at 3340-45
Today's trading needs to narrow down the range. There are signs that the center of gravity below is gradually moving upward. During the Asian session, the highest point reached around 3343. Friends who have already bought short positions here can wait for 3320-25 to take profits and exit. Those who haven't bought can wait for 3340-45 to short, with the target also being 3320-25
Trading strategy:
SELL@3340-45
TP:3320-25
It can be considered to go long when it reaches around 3320-25
More detailed strategies and trading will be notified here ↗↗↗
Keep updated, come to "get" ↗↗↗
6/26 Gold Analysis and Trading ViewGood morning, everyone!
Yesterday, gold rose to around 3336 before pulling back, then revisited the same level again. The buy-on-dip strategy performed well, delivering solid profits.
At today’s open, prices have moved slightly higher but remain near resistance. Technically, there’s potential to test the 3350 area, and if the move is strong, a rally toward 3370 is also possible.
If gold reaches this zone, it may present a favorable short-term selling opportunity. Therefore, today's trading strategy should focus on range-based trading between 3326-3368, selling near resistance and buying near support.
Key levels to watch:
Resistance: 3348–3352
Support: 3326–3318
Lastly, be mindful: if a trending move emerges, adjust your strategy accordingly and avoid counter-trend trades. Stay flexible and manage risk wisely.

XAUUSD has been in a strong free fall following the sell strategXAUUSD has dropped sharply in a free fall, perfectly following the sell strategy from 3348–3350.
We have won.
Trading Strategy for XAUUSD OANDA:XAUUSD
Based on the current price structure and short-term bias, here are two tactical trade setups:
Sell Setup – If Price Rejects Resistance
Entry: 3,348 – 3,350 USD
Stop-loss: 3,357 USD
Take-Profit 1: 3,340 USD
Take-Profit 2: 3,335 USD
Take-Profit 3: 3,330 USD
Buy Setup – If Price Holds Support
Entry: 3,328 – 3,330 USD
Stop-loss: 3,320 USD
Take-Profit 1: 3,338 USD
Take-Profit 2: 3,340 USD
Take-Profit 3: 3,348 USD
Important: Always set a stop-loss in every trade to manage risk effectively.
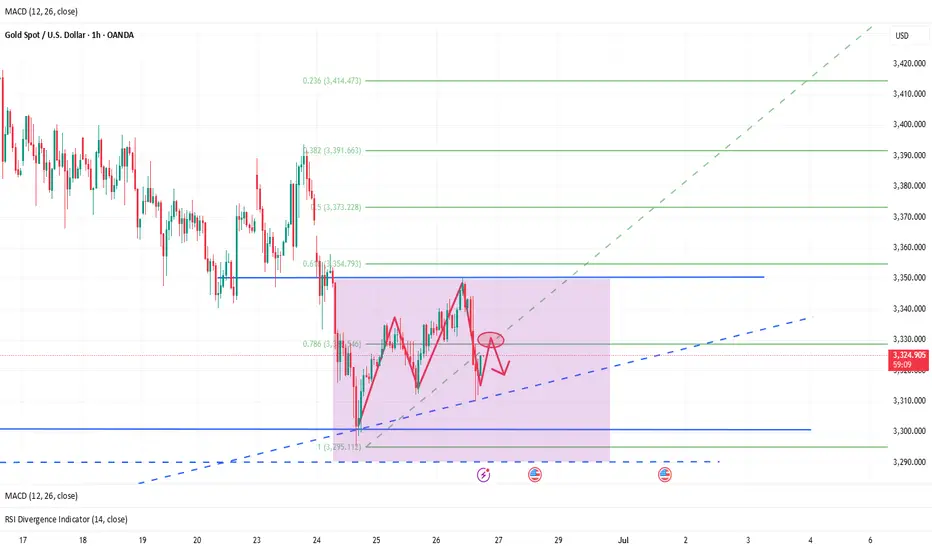
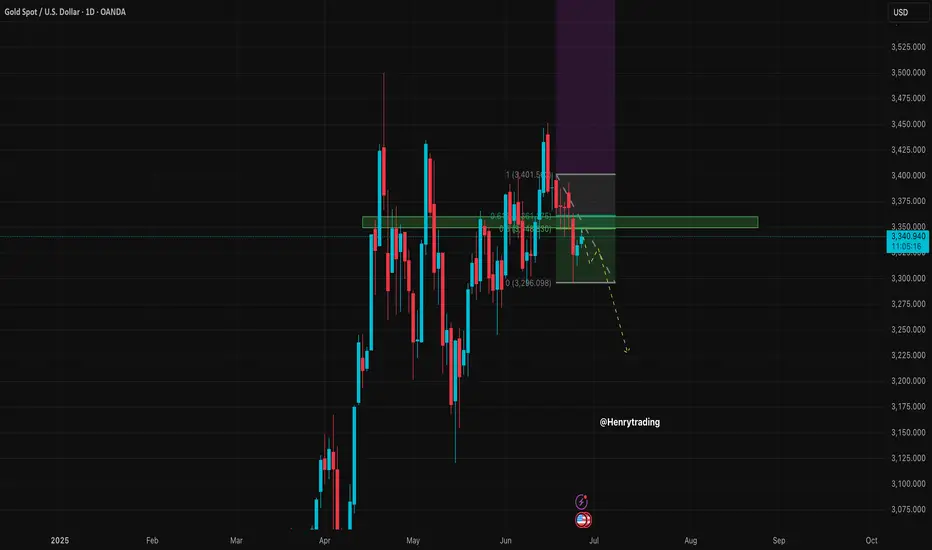
XAUUSD Trading Strategy for June 26–27, 20251. Market Overview
In today’s session (June 26, 2025), XAUUSD OANDA:XAUUSD (gold spot) is trading around 3,339.6 USD, posting a modest +0.22% gain compared to the previous day. The intraday range has been confined between 3,330 – 3,350 USD, reflecting a tug-of-war between buyers and sellers in this short-term equilibrium zone.
Following a recent corrective move, demand has reappeared around the 3,330 USD support. However, the recovery momentum is currently facing resistance near 3,350 USD, and the market will require a clear breakout to establish the next directional move.
2. Technical Analysis
Price Behavior
- Gold is moving sideways within the 3,330 – 3,350 USD range, which has acted as both support and resistance in recent sessions. It is also a high-liquidity zone, indicating indecision among market participants.
- The rebound from the 3,291 – 3,317 USD support zone is still ongoing, but there is no confirmation yet of a completed downtrend or trend reversal.
RSI Indicator
- The RSI (14) is currently fluctuating within the neutral zone (49–54), suggesting a lack of strong momentum in either direction.
- A sustained move above 55 could signal the return of bullish strength.
3. Key Technical Zones
Resistance:
- 3,350 USD: Frequently rejected intraday, immediate resistance to watch
- 3,373 – 3,392 USD: A major confluence of the Fibonacci 0.618 retracement and previous supply zone from last week
Support:
- 3,330 USD: Intraday support and equilibrium zone
- 3,291 – 3,317 USD: Strong structural support in case of further pullback
4. Trading Strategy for XAUUSD OANDA:XAUUSD
Based on the current price structure and short-term bias, here are two tactical trade setups:
Sell Setup – If Price Rejects Resistance
Entry: 3,348 – 3,350 USD
Stop-loss: 3,357 USD
Take-Profit 1: 3,340 USD
Take-Profit 2: 3,335 USD
Take-Profit 3: 3,330 USD
Buy Setup – If Price Holds Support
Entry: 3,328 – 3,330 USD
Stop-loss: 3,320 USD
Take-Profit 1: 3,338 USD
Take-Profit 2: 3,340 USD
Take-Profit 3: 3,348 USD
Important: Always set a stop-loss in every trade to manage risk effectively.
Ps: XAUUSD remains in a short-term consolidation phase, oscillating within a narrow range of 3,330 – 3,350 USD. A breakout beyond this range will likely define the market's direction heading into the New York session. Traders are advised to monitor price action closely within these levels and wait for clear confirmation before executing any positions.
Stay tuned for more daily gold strategies, and don’t forget to save this analysis if it helps refine your trading plan.
Analysis by @Henrybillion
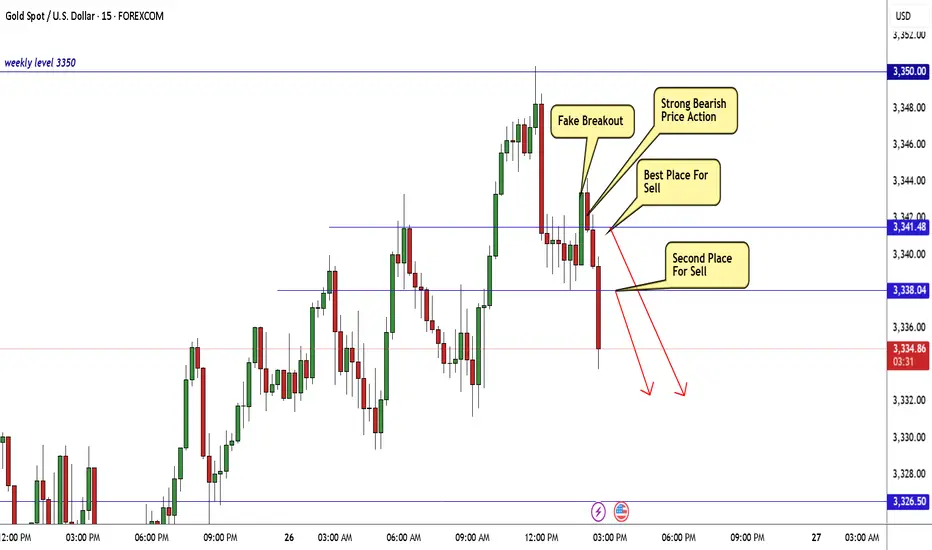
Gold Breakout Done New Short Entry Valid To Get 200 Pips !Here is my opinion on gold at he moment , in 15 mins T.F wr have a fake breakout but 3343.00 forced the price to go down which is a great res for this pair and we have avery good bearish price action and good closure below my res level 3341.00 so it`s my num 1 place to enter a sell trade if the price go back to retest it , and if not , 3383.00 will be my best place to sell it .
gold on bearish retest#XAUUSD price have retrace back 3350.2 which is retesting back below day low.
Below 3336 holds short sell which target 3330-3317, but main entry for selling 3330, SL 3346.
Breakout above 3350.2 holds strong buy which will reach 3366 for bearish reversal.
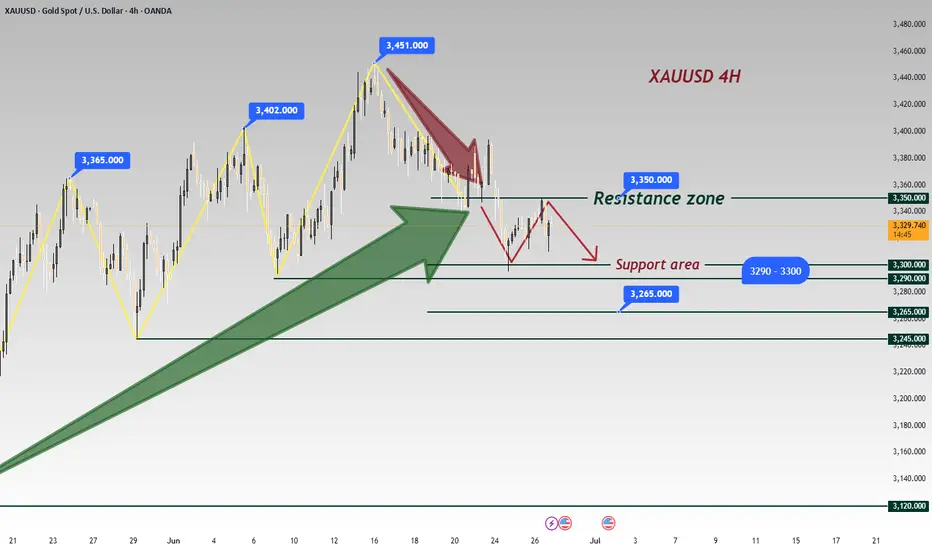
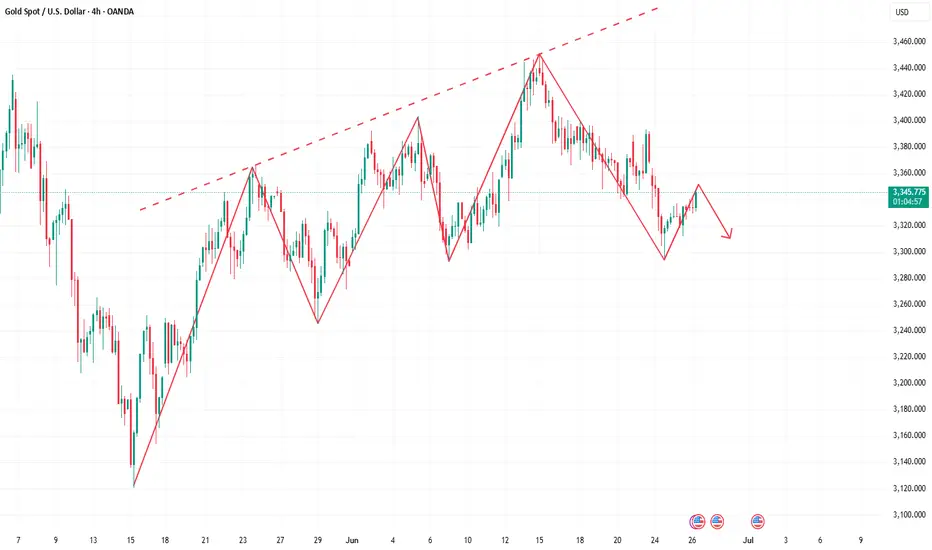
It’s the right time to short goldThe daily gold line presents a three-top gathering pattern. The historical trend shows that the 3290-3280 area has triggered technical pullbacks many times, all of which rebounded to around 3350. The current 4-hour chart trend line suppression level coincides with the Fibonacci 0.618 pullback resistance from the previous high of 3450 to 3300 in the 3350-3360 range. This area constitutes the core pressure zone. If the price fails to effectively break through and stand above 3360 when it probes this area again, it is highly likely to replicate the previous two resistance and fall patterns. At that time, short orders will be arranged based on the 3350 first-line resistance area, with the goal of breaking the key support of 3300 and further looking down at the 3280 and 3260 levels. The overall bearish tendency is maintained, and the resistance to rebound is a signal to enter the market and sell short.
Gold recommendation: Gold is short around 3345-3352, target 3330-3320
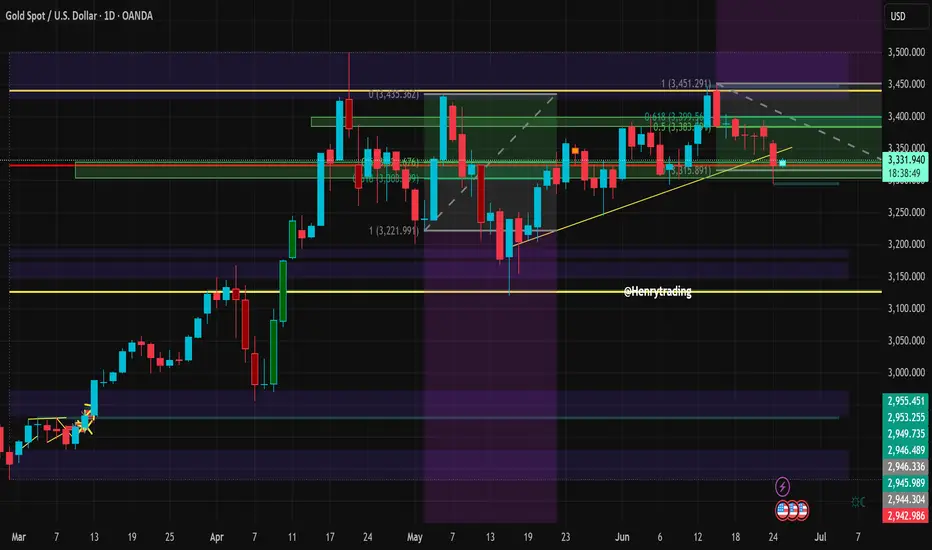
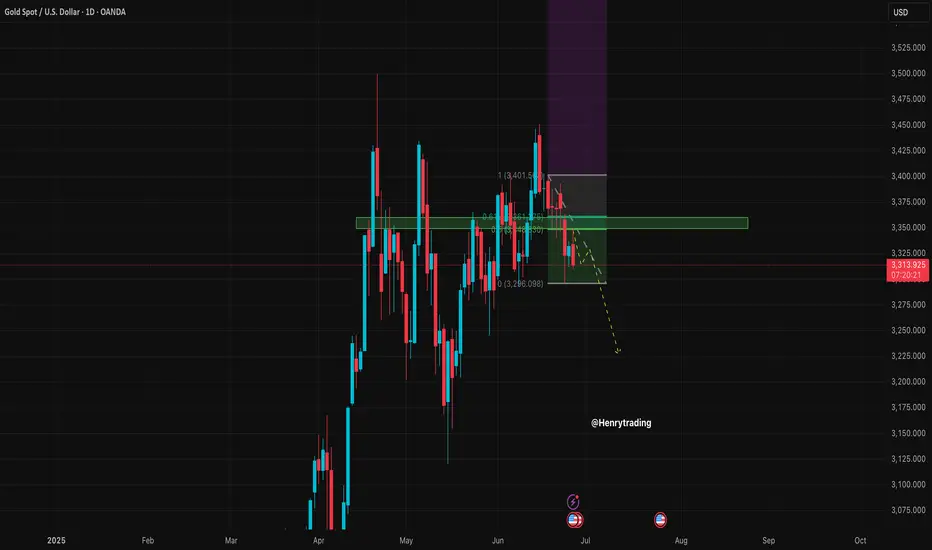
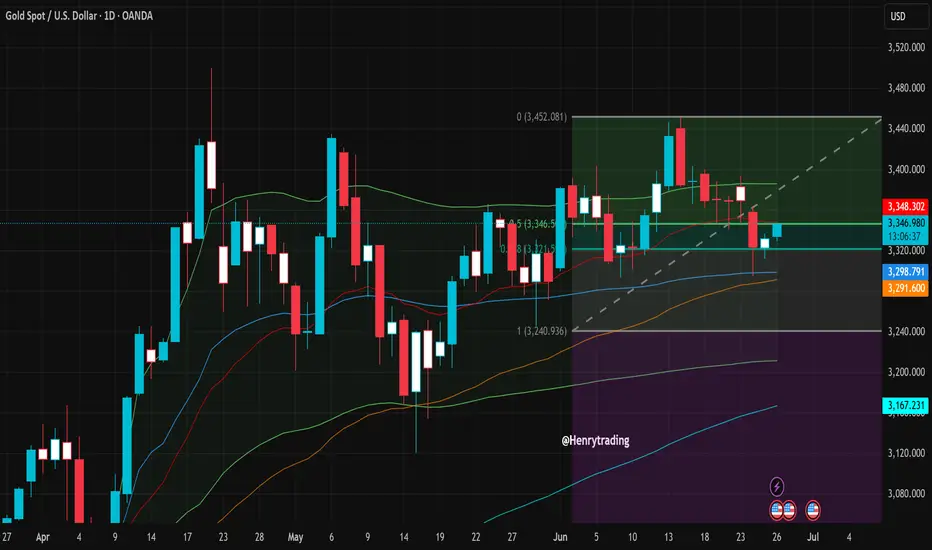
XAUUSD: Breakout or Bull Trap?Gold (XAUUSD) on the daily timeframe is showing signs of a temporary rebound after a sharp drop from the resistance zone at 3,452 USD. Specifically, the price has bounced back from the support area around 3,291 – 3,298 USD – a region aligned with dynamic EMA support and the 0.382 Fibonacci retracement of the previous bullish leg.
1. Key Technical Structure:
A clear reversal candlestick pattern has formed at a strong support zone, paving the way for a short-term technical rebound.
The 0.5 Fibonacci level at 3,346.5 is currently acting as the nearest resistance – aligning closely with today’s closing price.
EMA 20 and EMA 50 are beginning to converge, indicating market indecision on the next directional move.
2. Short-Term Price Scenarios:
Bullish Scenario: If price holds above the 3,291 – 3,298 support zone and breaks above 3,348, it could retest the 3,400 – 3,452 highs in the coming days. In this case, strengthening EMAs and bullish candle momentum would support this setup.
Bearish Scenario: Conversely, if the price fails to break through the 3,348 – 3,352 resistance zone and falls below 3,291 again, the market may head toward deeper support levels at 3,240 – or even as low as 3,167 USD.
3. Trading Recommendations:
Short-term Buy if there is a confirmed bullish candle closing above 3,348 with strong volume; stop loss below 3,291.
Sell on rally around 3,348 – 3,352 resistance if no clear breakout is confirmed.
Apply strict risk management, especially in a choppy market environment ahead of key macroeconomic data at the end of the month.
Conclusion:
XAUUSD is currently in a “trend re-evaluation zone.” Closely monitoring the 3,291 – 3,348 range will be the key to timing efficient entries in the short term.
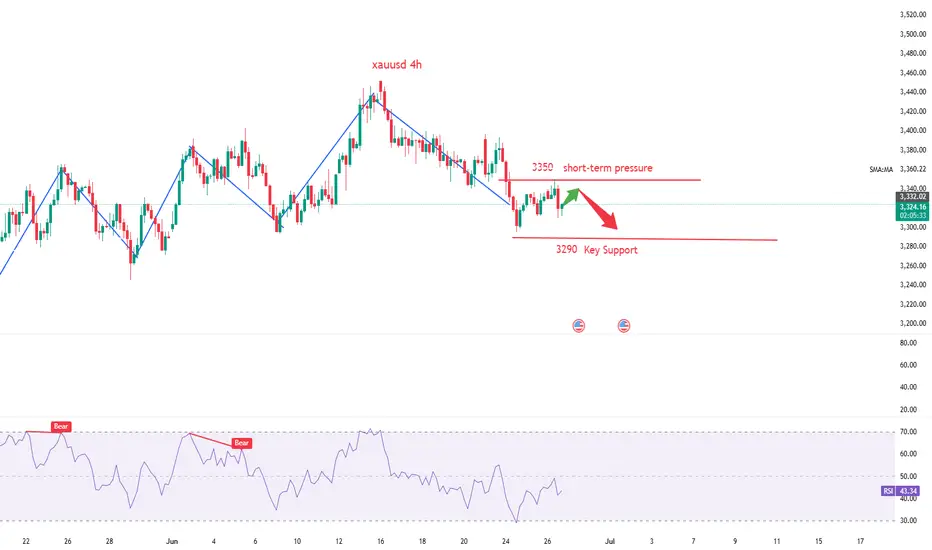
The Direction After Sideways Fluctuation at 3330Trump's announcement of an Israel-Iran ceasefire dented safe-haven sentiment, curbing safe-haven buying 🛑. Gold opened with a sharp plunge, then extended losses as Powell later stated that more time is needed before considering rate cuts—dovish expectations eased, sending gold further lower ⬇️. The price briefly fell below the 3,300 level, nearing 3,295 at its lowest, but failed to breach the 3,290-3,300 support zone 📊. As I indicated yesterday, traders could test rebound strength near support; once news impacts faded, gold rebounded to close at 3,323 🔄.
Currently trading sideways around 3,330, gold faces resistance at 3,350 while downside support remains at 3,290-3,300 📈📉. We therefore maintain a bearish stance
⚡️⚡️⚡️ XAUUSD ⚡️⚡️⚡️
🚀 Sell@3345 - 3335
🚀 TP 3325 - 3315 - 3305
Accurate signals are updated every day 📈 If you encounter any problems during trading, these signals can serve as your reliable guide 🧭 Feel free to refer to them! I sincerely hope they'll be of great help to you 🌟 👇
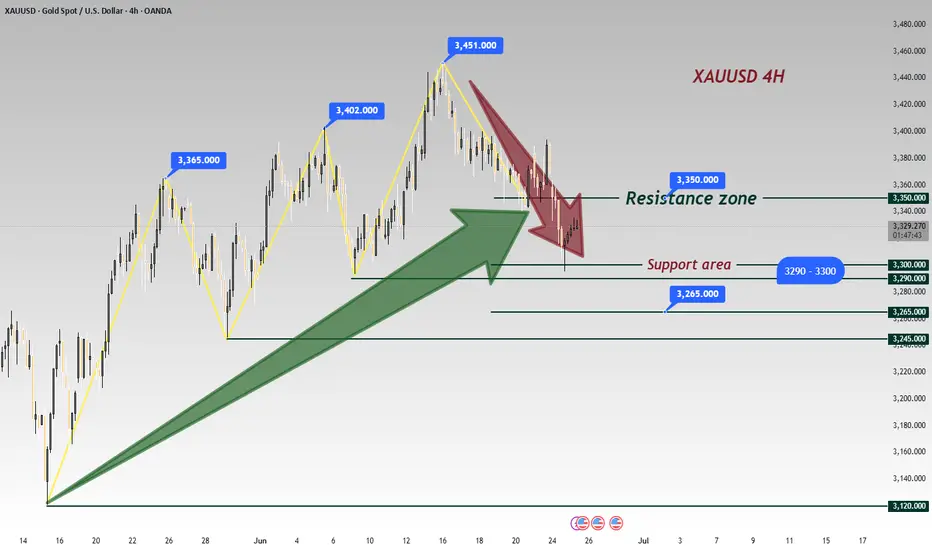
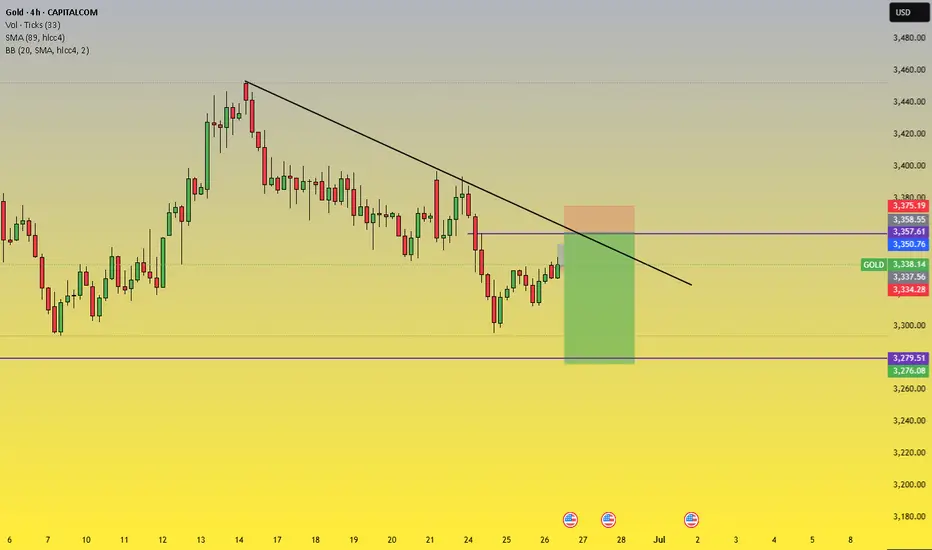
GOLD Trading: trategy: Look to SELL at resistance zone,downtrend🎯 Trade Setup:
Entry Zone (Sell Limit): 3,353 – 3,357 USD
Stop Loss (SL): 3,375 USD
Take Profit (TP): 3,280 – 3,283 USD
Risk-Reward Ratio: Approximately 1:3 → suitable for 2–4 session swing trades.
📊 Technical Analysis:
1. Overall Trend:
GOLD is clearly in a downtrend, confirmed by:
A descending trendline connecting recent lower highs.
Price consistently forming lower highs and lower lows.
2. Indicator-Based Analysis:
🔹 SMA 89 (Purple Line):
Price is trading below the 89-period SMA, confirming bearish momentum.
SMA89 acts as a dynamic resistance, and the 3,353–3,357 zone aligns with this resistance level.
🔹 BB20 (Bollinger Bands):
The upper band sits near 3,383, close to the SL zone → validating 3,375 as a proper stop.
Price is currently bouncing from the lower BB, so a rejection from the mid-to-upper band is likely, supporting a SELL setup.
🔹 Volume Analysis:
Volume is decreasing during this recent rebound, indicating:
Weak bullish pressure, typical of a corrective move.
The rally lacks conviction → strengthens the bearish case.