Xauusdshort

Gold bottomed out and rebounded, and gold is still rising!The latest news indicates that Trump has announced a 50% tariff on Brazilian products and a 25% tariff on Indian products, and has firmly stated that the tariffs will take effect on August 1st, with no further grace period. These positive factors will also support a rebound in gold.
As for tomorrow's big non-farm payrolls, considering that both the previous two times were negative and contrary to the ADP, it is very likely to be bullish for gold, which may help boost a steady rebound in gold, so there is no need to worry if you are stuck with gold.
Nothing rises forever, and nothing falls forever. Last week, the market rose in the first half, then fell in the second half. With the first half of this week's decline, the daily chart has already fallen to near the 100-day moving average. Be wary of a rebound in the second half. Gold is bearish today, but don't chase shorts. Focus on the 3300 resistance level. If it breaks above and stabilizes, expect a continued rebound to 3330-3345!
A real-time strategy is like a beacon guiding your investment journey. The market will never disappoint those who persevere and explore wisely. FX:XAUUSD VELOCITY:GOLD FXOPEN:XAUUSD ACTIVTRADES:GOLD PYTH:XAUUSD
Short position profit. Latest strategyYesterday's gold price fluctuated: it maintained sideways fluctuations in the morning and started a downward channel after the opening of the US market. The Federal Reserve's interest rate decision remained unchanged. In addition, Powell's speech suppressed expectations of a September rate cut. The gold price directly fell to around 3267 and closed the day with a negative line, which exceeded expectations.
Looking back at recent trends, gold prices saw a brief correction on Tuesday after four consecutive days of decline, but failed to sustain the upward trend, falling sharply again yesterday, demonstrating that the weak market remains intact. Judging from today's market, theoretically there is still room for further decline, but before yesterday's low is broken, we don't expect a big drop for the time being; if the support here is effective, the market may tend to correct.
Pay attention to the daily resistance near 3315, and try shorting with a light position; the hourly resistance is near 3301, which is also a good position for shorting; the intraday bull-bear watershed is near 3294. If the market falls weakly and rebounds here, there may be a decline. The target below will first look at 3275. If yesterday's low of 3267 is broken, look further to 3250: On the long side, pay attention to the 3249 support below. If it is close to broken, you can try short-term buying.
【Operation ideas】👇
The bearish strategy in the morning remains unchanged. The short position at 3315 was publicly set up in the morning. The market rebounded to 3314 and then went down directly. The idea of setting up short positions at 3301 in the morning session remains unchanged. Friends who did not follow up with the short positions at 3315 can now add short positions with a light position at 3300.
PEPPERSTONE:XAUUSD ACTIVTRADES:GOLD VANTAGE:XAUUSD ACTIVTRADES:GOLD ICMARKETS:XAUUSD VELOCITY:GOLD PYTH:XAUUSD
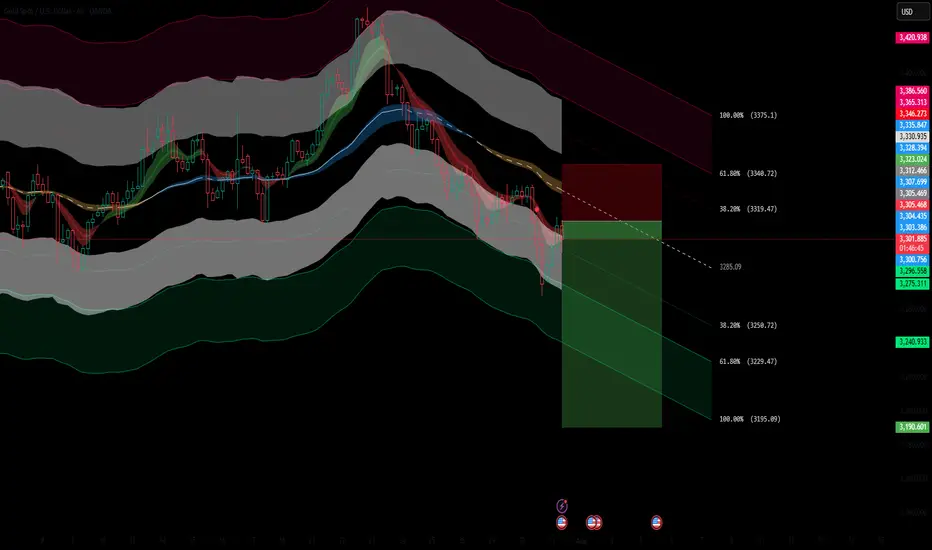
XAUUSD 4H AnalysisGold is currently in a clear downtrend after failing to hold above the mid-channel. Price is retracing into a potential short zone with confluence from the moving average bands.
Fibonacci Retracement: Price is reacting near the 38.2% level (3,318).
Downside Fibonacci Targets:
1️⃣ 3,249.36 (38.2%)
2️⃣ 3,228.11 (61.8%)
3️⃣ 3,193.73 (100%)
As long as the price stays below the red resistance zone, the bearish momentum is likely to continue toward the lower Fibonacci targets. A break above 3,339 would invalidate the short setup.
Short selling remains the main themeGold hit a low of around 3267 yesterday and fluctuated until closing at 3274. Gold fluctuated upward at the opening today. Currently, gold is fluctuating around yesterday's rebound point of 3305. This is the resistance we need to pay attention to in the short term.
From the 4H analysis, today's short-term resistance is around 3305-3315. If gold wants to rise, it needs to stabilize above 3315. Focus on the 3335 first-line pressure, and rebound to the 3305-3315 resistance area during the day. You can consider shorting and follow the trend to see the decline unchanged, looking towards 3290-3280. Rely on this range to maintain the main tone of high-altitude participation. For the middle position, watch more and do less, be cautious in chasing orders, and wait patiently for key points to enter the market.
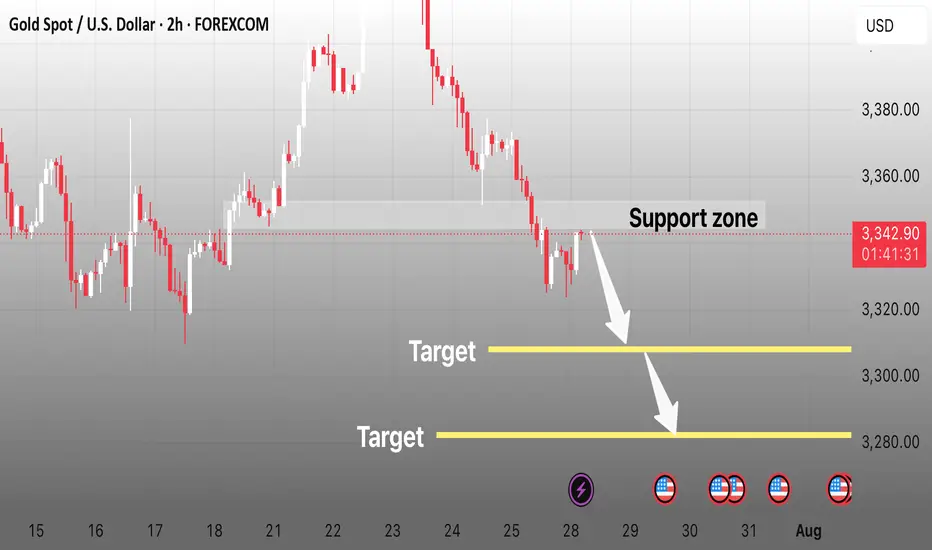
XAUUSD H2 | Downside Target 3270Gold (XAUUSD) recently rejected from a key resistance zone around 3300, showing strong bearish momentum on the 2H timeframe.
💡 Setup Idea:
• Price broke support → Retest as new resistance ✅
• Clean imbalance left behind → Fills expected 📉
• Target: 3270 zone (300 pips move) 🎯
• Risk-Reward potential is solid for intraday/swing entries.
Trade Plan:
If price holds below 3300, we expect continuation toward the 3270 zone. This area also aligns with previous structure and liquidity grab.
🕐 Timeframe: 2H
📌 Resistance: 3300
🎯 Target: 3270
📍 RR: 1:2+
#XAUUSD #GoldSetup #PriceAction #SmartMoney #FXTrading #TradingView #ForYou

GOLD Breakdown Setup | Clean Sell Targets Ahead!XAU/USD (Gold) Analysis – 2H Timeframe
After a clear rejection from higher levels, Gold has pulled back to retest the broken support zone around 3340–3350, which now acts as a resistance.
If the price sustains below this zone, we can expect a smooth move down toward clean liquidity areas below.
This is a textbook bearish continuation setup. 💥
🔻 Trade Idea – Short Setup:
• Sell Below: 3,340
• Target 1: 3,300
• Target 2: 3,280
• Stop Loss: 3,355 (above resistance zone)
🧠 Confluences:
• Bearish market structure
• Support zone retest
• Trend continuation
• High-impact USD news ahead (watch for volatility)
📅 Key Dates: July 30 – Aug 1
⚡ NY session could trigger the move!
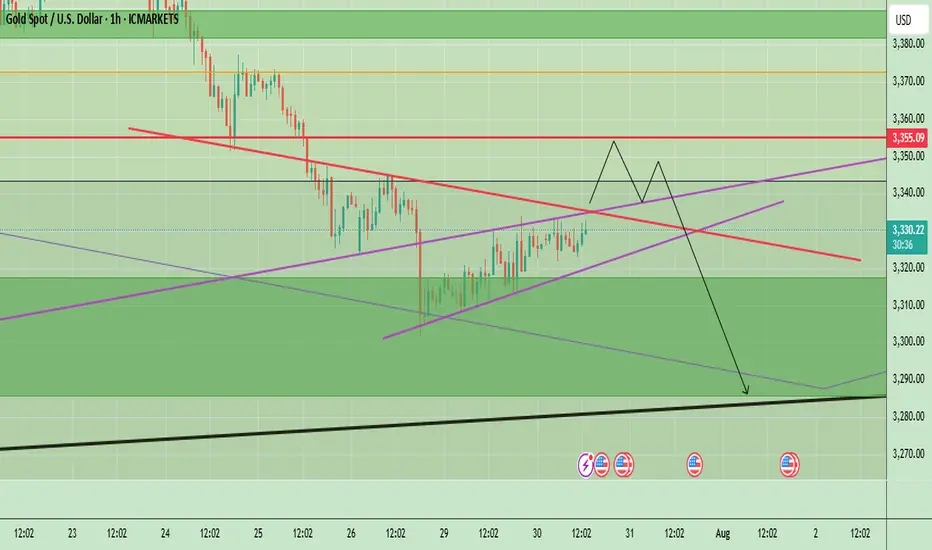
XAUUSD (Gold) Analysis – 1H Chart | July 31, 20251. Fakeout & Rejection from Supply
Price faced sharp rejection near the 3,332 resistance. The strong red candle indicates aggressive selling and liquidity grab.
2. Retest of Broken Demand Zone
Gold is now retesting the **3,298–3,305** yellow zone, which previously acted as demand but may now flip to resistance (supply).
3. Bearish Market Structure
The price formed a **lower high and lower low** pattern — a clear sign of downtrend resumption. Current bounce looks corrective.
4. Projection: Potential Drop Ahead
As per the drawn path, if price fails to reclaim above 3,305, a likely drop toward 3,282, then 3,268 is expected.
5. Key Levels to Watch
Resistance: 3,305 → 3,332
Support: 3,282 → 3,268 → 3,246
Bearish bias remains valid below 3,305.


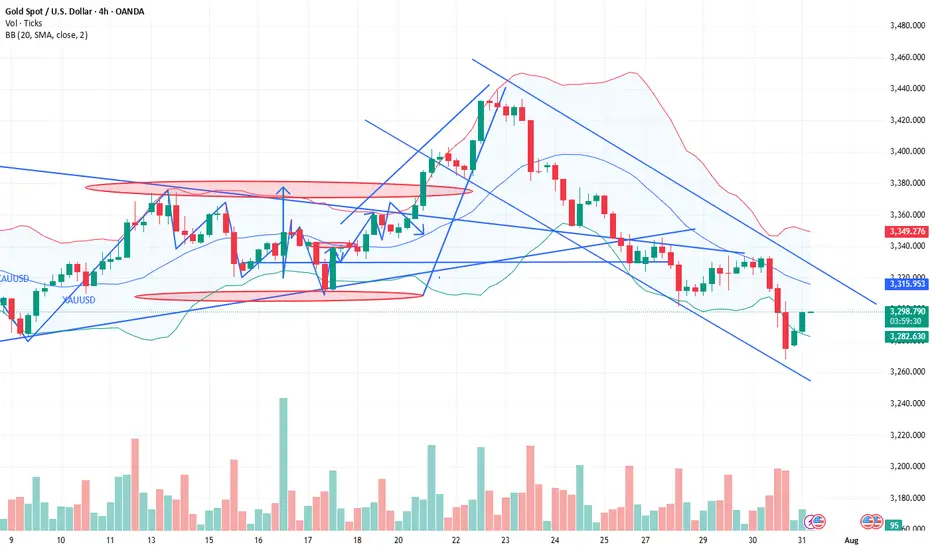
Gold Faces Strong Rejection Below $3,365 – Bearish Wave Ahead?Gold is currently trading around $3,359, showing signs of exhaustion after climbing from the $3,248 low. The chart illustrates a textbook scenario of channel rejection after testing the upper boundary of the descending wedge and failing to break above the $3,365–$3,392 resistance zone. Price is now hovering just below the diagonal black trendline, indicating a potential lower high formation and setting up for another bearish wave.
📌 Key Technical Highlights
Resistance Zone: $3,365–$3,392
This area marks the confluence of the black long-term trendline, the top of the descending purple channel, and the previous high at $3,392.
Price attempted a "Possible Retest" as annotated on the chart and is now starting to pull back—showing signs of bearish rejection.
Bearish Scenario (Blue Arrows):
Multiple downward arrows show likely bearish paths if the current resistance holds.
Key short-term targets:
$3,337, $3,320, $3,303, Strong support at $3,293–$3,248
Further downside may test extension levels toward $3,220–$3,200 by early August if momentum builds.
⚠️ Bearish Confirmation Criteria
Failure to close above $3,365 (black trendline)
Breakdown below $3,337 followed by $3,320
Strong selling pressure supported by fundamentals (e.g. USD strength, Fed hawkish stance)
✅ Invalidation / Bullish Outlook
A decisive breakout and close above $3,392.73 would invalidate the bearish structure.
In that case, targets would shift toward:
$3,412, $3,434, $3,490 (long-term trendline intersection)
However, today's U.S. CPI (Consumer Price Index) release adds a layer of volatility and potential trend disruption, making this a high-risk trading day.
📊 CPI News Impact – What to Watch
High CPI (Stronger than forecast):
- Increases expectations of further Fed tightening → strengthens USD → bearish for gold
- Likely scenario: sharp drop toward $3,337 → $3,320 → $3,293
Low CPI (Weaker than forecast):
- Signals disinflation → weakens USD → bullish for gold
- Possible breakout above $3,365 → retest of $3,392 → if broken, target $3,412 and $3,434
Neutral or as expected CPI:
- Likely leads to whipsaw — fakeout on both sides
- Caution advised — wait for candle close confirmations post-news
Note
Please risk management in trading is a Key so use your money accordingly. If you like the idea then please like and boost. Thank you and Good Luck!

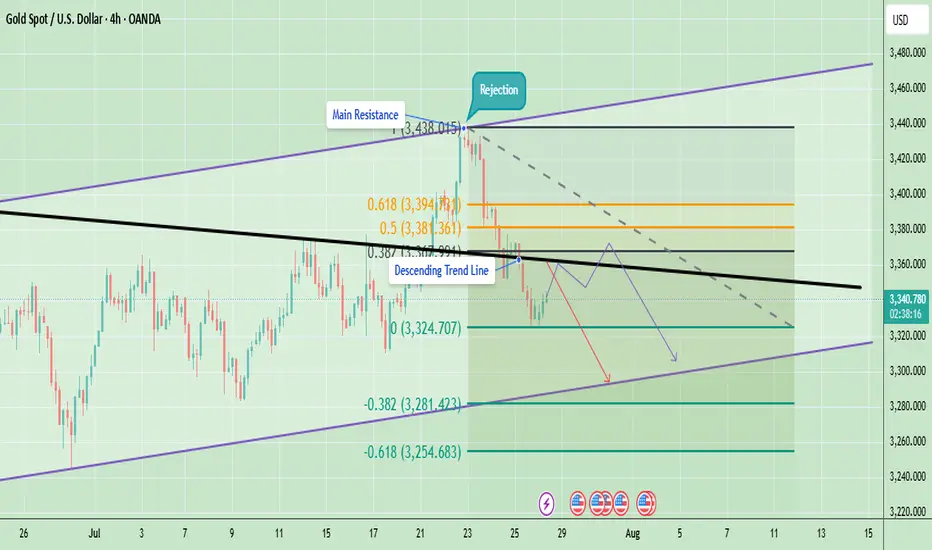
Technical Analysis - Gold Rejected at ResistanceGold is currently trading around $3,341 after facing a strong rejection from the $3,438 resistance area. This rejection coincided with the upper boundary of the trend channel and the main resistance zone, which also aligns with the Fibonacci 0.5–0.618 retracement levels. After the rejection, price fell below the descending trendline, indicating that short-term sellers have taken control.
On the downside, the immediate support sits at $3,324, which has acted as a short-term bounce level. A break below this could push gold lower toward $3,281 and potentially $3,254, which are key Fibonacci extension support levels. On the upside, the immediate hurdle is at $3,355–$3,360 (descending trendline). A breakout above this area will be critical for any bullish recovery attempt toward $3,381–$3,394 and eventually $3,420–$3,438.
At the moment, the short-term trend remains bearish because gold is trading below the descending resistance and showing lower highs. However, as long as gold holds above the $3,254 support zone, the medium-term structure remains neutral to bullish, giving bulls a chance if momentum shifts again.
Last week candle is pin bar bearish candle which is showing bearish momentum at the moment. The candle shows rejection near $3,400–$3,450, aligning with the triangle’s upper resistance trendline. If gold cannot reclaim and hold above last week’s high, price may drift lower to retest support zones around $3,248–$3,150 before another breakout attempt.
Note
Please risk management in trading is a Key so use your money accordingly. If you like the idea then please like and boost. Thank you and Good Luck!
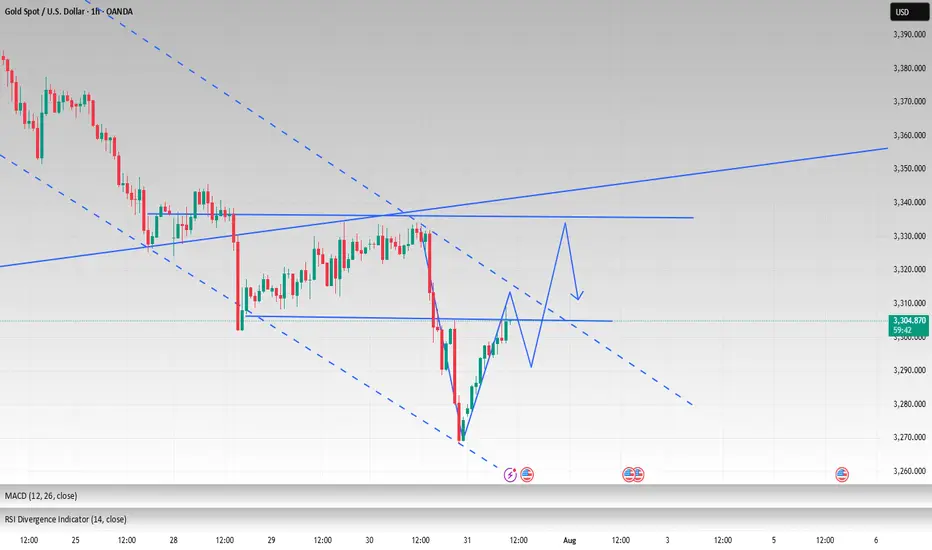
Gold Awaits Fed Rate Decision – Key Levels & Volatility AheadGold is currently trading near $3,332, showing a minor recovery after recent downward momentum. The price action on the 1-hour chart highlights a short-term ascending structure, which often acts as a corrective move rather than a strong bullish trend. The market previously saw significant selling pressure from above $3,355–$3,360, creating a short-term supply zone. Unless the price breaks and holds above this zone, the overall momentum remains bearish.
The chart also shows a projected price path where gold could push slightly higher toward $3,355, meet resistance, and potentially reverse downward again. Key support lies at $3,320, and if this breaks, we could see gold testing $3,290–$3,280 levels, aligning with the black trend line support. However, if bulls manage to break above $3,360, it would signal potential upside continuation toward $3,380–$3,400.
Key Points
- Key Resistance Levels: $3,355 and $3,360 (critical supply zone).
- Key Support Levels: $3,320 (short-term), followed by $3,290–$3,280 (major trendline support).
- Expected Short-Term Move: Possible push toward $3,355 → rejection → decline back toward $3,320 and possibly $3,290.
Bullish Breakout Scenario: A strong close above $3,360 could push price toward $3,380–$3,400.
Overall Bias: Bearish while trading below $3,360.
4hr Chart
Price remains under pressure below the descending trendline. A small pullback toward $3,345–$3,350 is possible, but as long as price stays under this resistance, the bias remains bearish with potential downside targets around $3,300–$3,280.
Key Levels:
- Resistance: $3,350 → $3,381 → $3,394
- Support: $3,324 → $3,281 → $3,254
Today’s FOMC interest rate decision is a key driver for Gold. Here’s the quick analysis:
- If Fed Hikes Rates or Maintains Hawkish Tone:
- Strong USD likely → Gold could face more selling pressure.
- Key support zones: $3,324 – $3,300, then $3,281 and $3,254.
- If Fed Pauses or Turns Dovish:
- Dollar weakens → Gold may bounce toward resistance zones.
- Upside levels: $3,355 – $3,360 and higher toward $3,381 – $3,394 (Fib levels).
Expect high volatility; $3,300 is a critical support to watch. A dovish Fed may give Gold short-term relief, but a hawkish stance could accelerate the downtrend.
Note
Please risk management in trading is a Key so use your money accordingly. If you like the idea then please like and boost. Thank you and Good Luck!
Gold Price Update – Bearish Flag Signals Possible Drop AheadGold is currently trading around $3,324, showing consolidation after a recent decline from the $3,345 region. The chart shows a bearish flag pattern forming after the sharp drop, indicating potential continuation of the downtrend. If gold fails to break above this region, sellers may push the price lower towards $3,301 and possibly $3,275.
The descending trend line adds further bearish pressure, limiting upside momentum unless gold decisively breaks and holds above $3,345. Overall, gold remains under short-term bearish sentiment, with the focus on support retests. Any bullish momentum will only be confirmed if the price closes above the flag and trendline resistance.
Key Points
Resistance Zones: $3,328 (0.618 Fib), $3,345 (flag top).
Support Zones: $3,301 (Fib base), $3,284, and $3,275 (bearish extension).
Trend Outlook: Short-term bearish unless price breaks above $3,345 with volume.
Bearish Targets: $3,301 → $3,284 → $3,275.
Bullish Invalidations: Break and close above $3,345 may shift bias to bullish.
Note
Please risk management in trading is a Key so use your money accordingly. If you like the idea then please like and boost. Thank you and Good Luck!

The Federal Reserve maintains a neutral stanceAs the Federal Reserve maintains its neutral monetary policy stance despite acknowledging slowing economic growth, the gold market is attempting to reclaim the $3,300 per ounce mark.
As expected, the Fed kept interest rates unchanged, maintaining them within a range of 4.25% to 4.50%. The most notable change in the Fed's monetary policy statement was a slight downward revision of its assessment of the economy, noting that growth in the first half of the year slowed from the "solid pace" seen in June.
In its monetary policy statement, the Fed stated: "While volatility in net exports continues to impact the data, recent indicators suggest that the growth of economic activity has moderated somewhat in the first half of the year."
The market's initial reaction to the Fed's statement was renewed volatility in gold prices. On Wednesday (July 30), spot gold closed at $3,274.88, down $51.47, or 1.55%, with an intraday low of $3,268.02. In early Asian trading on Thursday, spot gold rebounded to around $3,296, putting it within reach of the previous support level of $3,300.
While the Federal Reserve maintained its neutral monetary policy stance, dissent began to emerge within the committee. Fed Governors Bowman and Waller both voted in favor of a rate cut at this meeting.
However, analysts noted that the split vote was unsurprising, as both committee members had been outspoken about their dovish views.
With the Fed's decision unsurprising, Michael Brown, senior market analyst at Pepperstone, predicts the Fed will be slightly more hawkish this year than the market currently anticipates.
Despite the Fed's current neutral stance, the market still expects the Fed to cut interest rates twice this year, starting as early as September.
"My baseline forecast remains that the resilient nature of the labor market and continued tariff-induced price pressures will keep the Fed on the sidelines for now," Brown said. "My view remains that only one 25 basis point rate cut is likely this year, likely at the December meeting." OANDA:XAUUSD ACTIVTRADES:GOLD EIGHTCAP:XAUUSD FOREXCOM:GOLD EIGHTCAP:XAUUSD
Is the gold correction over?✏️Yesterday's D1 candle closed above the Breakout 3363 zone. This shows that the buyers in the US session are still strong. There is a possibility of a liquidity sweep in the Tokyo and London sessions, then in the New York session, Gold will recover and increase again. The uptrend is really broken when Gold confirms a close below 3345. In this case, we have to wait for 3320 to confirm the BUY point. The gold uptrend at this time also needs new momentum to be able to move towards ATH 3500.
📉 Key Levels
Support: 3345-3320
Resistance: 3373-3418
Buy zone: 3345 (bullish wave structure maintained); BUY DCA break 3373
Buy zone: 3320 (Strong support zone)
Target: 3417
Leave your comments on the idea. I am happy to read your views.

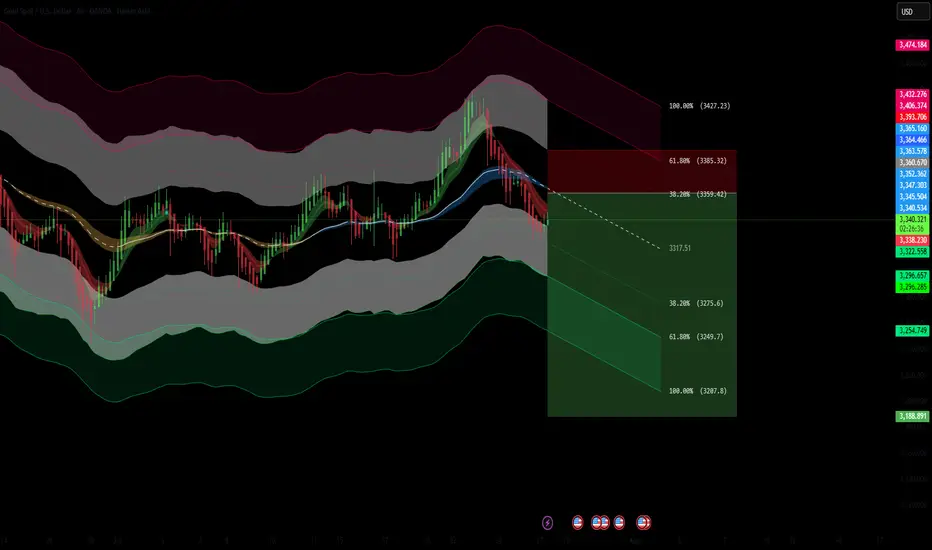
XAUUSD – 4H Short Setup AnalysisGold (XAUUSD) has broken below the dynamic support zone of the Keltner Channel structure and is currently trading beneath the 200 EMA zone, signaling bearish momentum. Price has rejected the upper resistance band near 3385, forming a lower high and triggering a short entry at the 38.2% Fibonacci retracement zone.
📉 Trade Idea (Short Bias)
Entry: Around 3360
TP1: 3317 (key support zone)
TP2: 3275 (38.2% Fib ext)
TP3: 3208 (100% extension target)
SL: 3385 (61.8% Fib retracement)
Confluences:
Price rejection from upper channel
200 EMA trend resistance
Clean bearish structure with momentum confirmation
Fib confluence adds precision to entry and target levels
If momentum sustains below 3360, further downside is likely toward the 3200 zone.
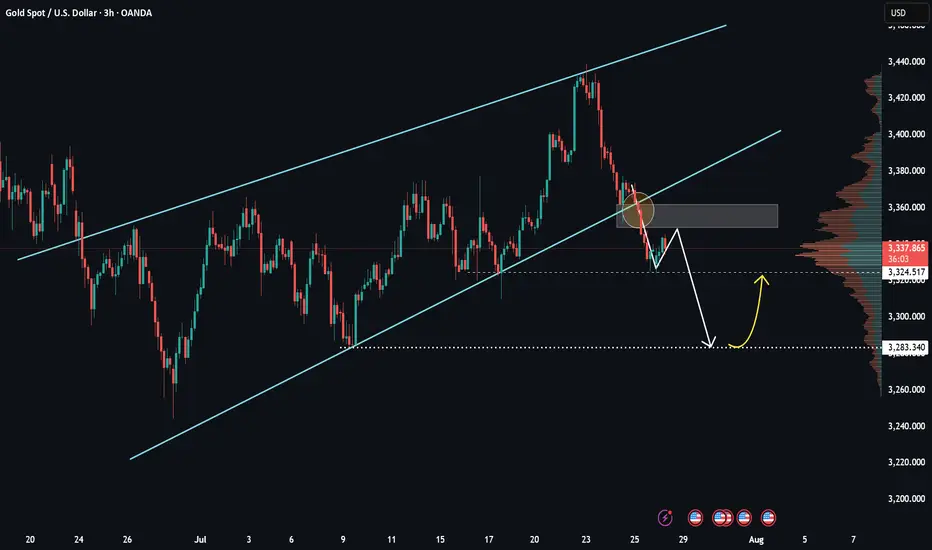
XAUUSD – Weak recovery, selling pressure still dominatesHello everyone! What do you think – is it time to buy or sell gold?
After clearly breaking the ascending trendline late last week, gold made a slight rebound from the 3,325 zone. However, in my view, this bounce was relatively weak and mostly technical in nature.
Currently, price is retesting a key confluence area around 3,345–3,355, which includes the previous trendline and a nearby resistance zone.
If we see a clear rejection candle form at this level, there's a high chance the price may reverse and continue its downward trend. The short-term target I’m watching is 3,300 USD – and if that level doesn’t hold, we could see stronger reactions near 3,283.
According to the VRVP indicator, volume is concentrated around lower price levels, suggesting that liquidity is still sitting near previous lows. Structurally, the market continues to form lower highs and lower lows, and with the EMA sloping downward, my primary bias remains to SELL on rallies within the trend.
Gold - The diligent top formation!🏆Gold ( TVC:GOLD ) finished the bullrun:
🔎Analysis summary:
For the past 10 years, Gold has been trading in a very strong expected bullrun. Just like we witnessed it in 2011, a 10 year bullrun is followed by a shorter term bearmarket. Gold is starting to lose its strength, which is a clear sign of weakness and the beginning of a bearish reversal.
📝Levels to watch:
$2.800
SwingTraderPhil
SwingTrading.Simplified. | Investing.Simplified. | #LONGTERMVISION

Be cautious with the numerous news and short sell on rebound#XAUUSD
The market is fluctuating sideways, and whether it can achieve a V-shaped reversal still needs to wait for information such as ADP and the Federal Reserve's decision.🗞 Invest lightly today and avoid letting emotions dictate your thinking.⚖️
⚠️Although the market currently predicts that the news information is bullish for gold, and most of the trading voices are centered around bulls, we still need to be wary of the resistance area above 3345-3350.
📉Judging from the daily chart, I have clearly stated in the figure before that the current trend is a converging triangle. If the price hits the triangle boundary, coupled with the interference of external news, it may trigger panic selling, killing a wave of long buyers first🐂, and then trigger an upward trend when it retreats to near the 3300 support level, and may even test the support level of 3285. 🩳
The 4H chart shows that although the rebound momentum is still continuing📈, the gold price is still below the short-term moving average and has only recovered the lower support level. It is necessary to wait for a second retracement confirmation to determine whether a true trend reversal has been achieved. 📈
In addition, the price on the hourly chart continues to run in a downward channel. Combined with the previous trend pattern, after the rebound correction at the 4H level is completed, it is highly likely that the downward trend will continue to return to the lower support level of the daily level.🐻
If resistance is encountered at 3345-3350 for the first time today, consider shorting.💡
If the price currently retreats to around 3320-3315, consider a short-term long position. Long positions held yesterday can be manually closed at around 3330.💡
🚀 SELL 3340-3350
🚀 TP 3330-3320-3300
🚀 BUY 3320-3315
🚀 TP 3330-3340

Bearish Gold Outlook — Potential Flash Crash Imminent🔻 Technical Structure – Bearish Breakdown Brewing
Lower highs and lower lows forming on the daily and 4H timeframes — classic downtrend mechanics.
Price has rejected multiple times near $3,400–3,430, forming a strong resistance ceiling.
Support at $3,280–3,300 has been tested too many times— and each bounce is weaker. When support holds with less conviction, it's often about to break.
Volume spikes on red candles show smart money is exiting on down moves — signs of institutional distribution.
The **tightening consolidation range** looks like a **descending triangle** — usually resolves downward.
If $3,280 breaks, expect a **liquidity event**. Stops get swept, leading to a **sudden acceleration — possibly a flash crash** to $3,200 or lower.
🌍 **Fundamental Drivers – Macro Picture Is Turning Hostile for Gold**
1. Real Yields Are Climbing
U.S. real yields are up as inflation fades and the Fed stays hawkish.
Gold, being yieldless, suffers when investors can get positive returns from bonds.
2.The Dollar Is Gaining Strength
DXY is pushing higher, fueled by strong U.S. data and weak peers (euro, yen).
Gold priced in USD becomes more expensive globally — this suppresses demand.
3. **Rate Cuts Are Off the Table — or Delayed**
Market is pricing fewer and later rate cuts from the Fed.
This removes one of gold’s biggest bullish catalysts from earlier in the year.
4. Geopolitical Fear Is Cooling
No major escalation in Ukraine, Middle East, or Taiwan.
Without fear, gold loses its safe-haven premium.
5. Central Bank Buying May Have Peaked
Recent data from WGC shows some slowing in central bank accumulation.
If this institutional bid softens, gold could drop hard — few natural buyers remain above $3,300.
⚠️Conclusion: Gold Is Walking a Tightrope
The chart is a staircase down.
Macro fundamentals are no longer supportive.
A clean breakdown below $3,280 could trigger a **chain reaction** of automated selling and margin calls — **a flash crash is on the table**.
This isn’t just a correction — this feels like the calm before the storm.

Interest rates unchanged, sticking to my bearish idea.Look at my other posts and you''ll understand as to why, I was telling everyone to sell. There was a small sellers trap, we pushed up, at that moment I already had closed my positions. Now we go down to the other key levels. I'm done till the end of August. Will still post my setups, but won't take any trades. Stay safe and keep your funds safe. Hella Love!
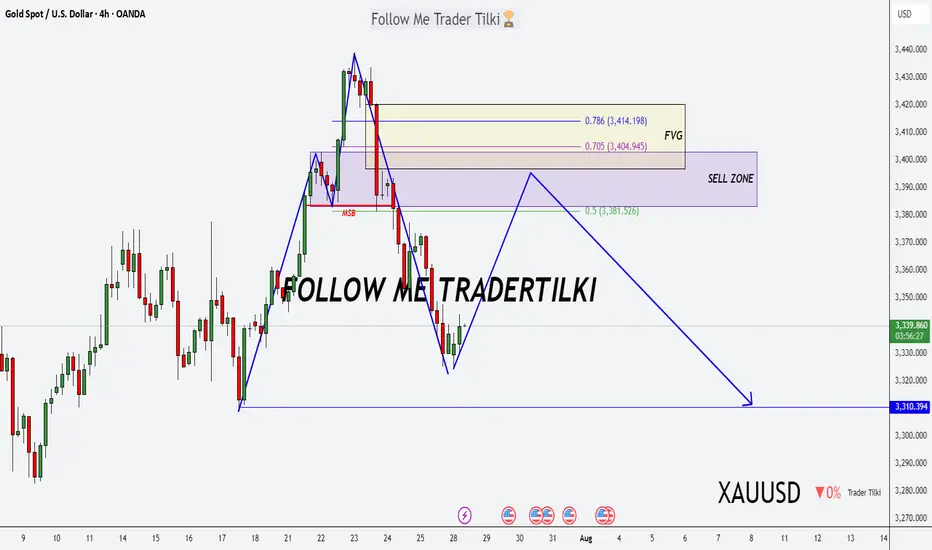
Gold Alert: Key Levels for Potential Sell Setup!Good morning, my friends 🌞
Here’s today’s gold analysis. I'm expecting a decline in gold prices, specifically from the 3,383–3,420 level.
Once a correction starts around that zone, my target will be 3,310. Gold has been riding a strong uptrend, and if we reach those levels, I’ll be expecting a pullback and opening a sell position accordingly.
Please set your stop loss based on your personal margin preferences.
Your likes and support are my biggest motivation for continuing to share these analyses. Thank you to everyone showing appreciation 🙏
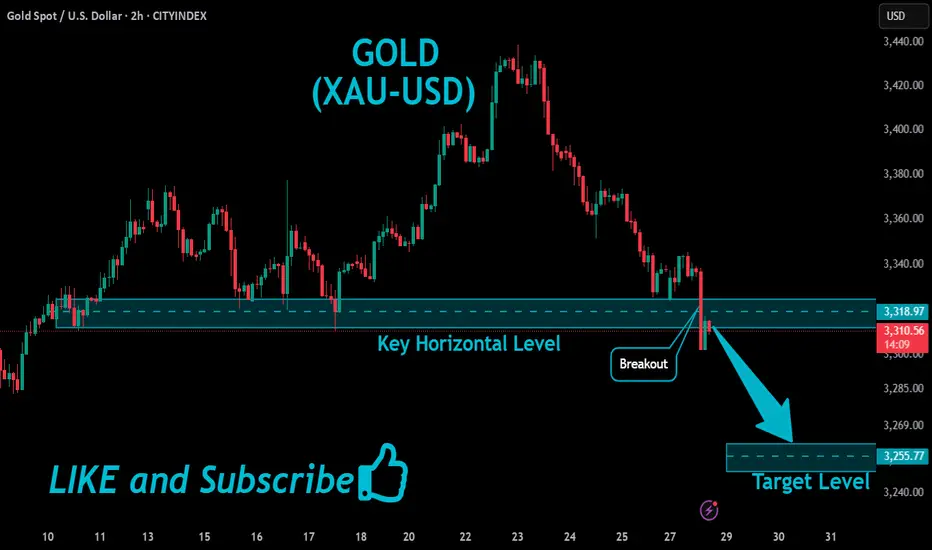
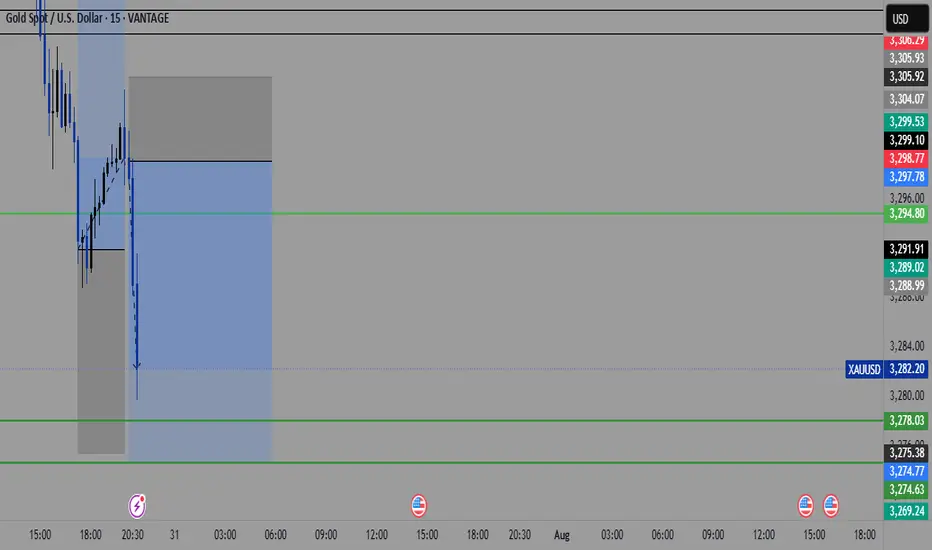
GOLD Bearish Breakout!
HI,Traders !
#GOLD is trading in a strong
Downtrend and the pair
Broke the key horizontal
Level around 3318.97 which
Reinforces our bearish
Bias and we will be
Expecting a further
Bearish move down !
Comment and subscribe to help us grow !