XAUUSD and USOILHesitation Geopolitical factors have led to the escalation of relations between several countries. The Middle East is in chaos. Although this is a trading market, the relationship between the two is too close. This is why the Asian market XAUUSD reached a high of 3400.
But it is not stable. Because after the news that stimulated the rise in gold prices over the weekend, there were some negative news. For example, peace talks, time differences, negotiations and other factors have eased the tense atmosphere. Then the gold price fell with the trend, reaching a low of 3347.
From the overall situation, the market still has the momentum to rise in the short term. But this depends on Iran's response. Including the impact of the Strait of Hormuz. This is the key factor in the rise or fall of oil prices. Investors with larger funds can arrange long orders in advance.
The view on XAUUSD is to buy at low levels. The impact of geopolitics is too huge. On the basis of interest rate cuts, buying is the key to profit. But everyone's financial situation is different, so when trading, remember to control the position ratio. Prevent trading errors from leading to account liquidation.
Xauusdshort
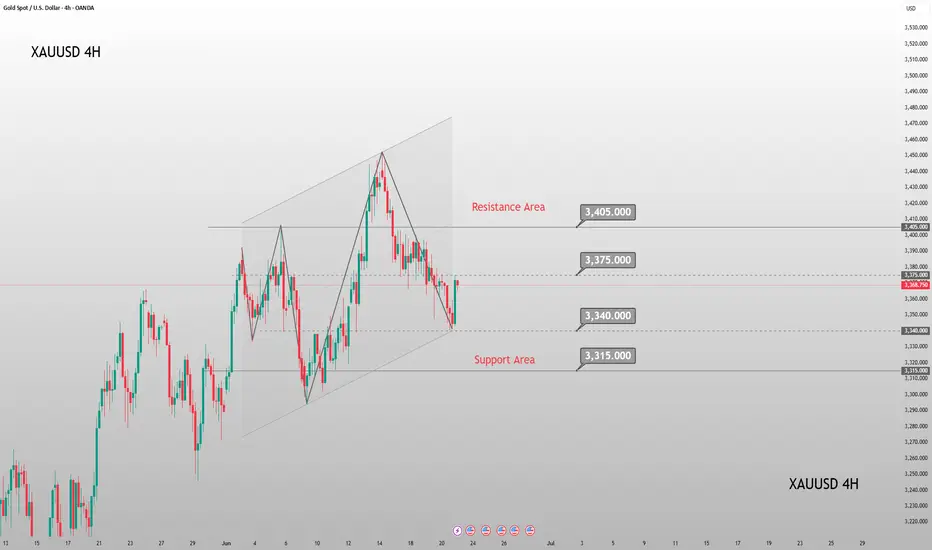
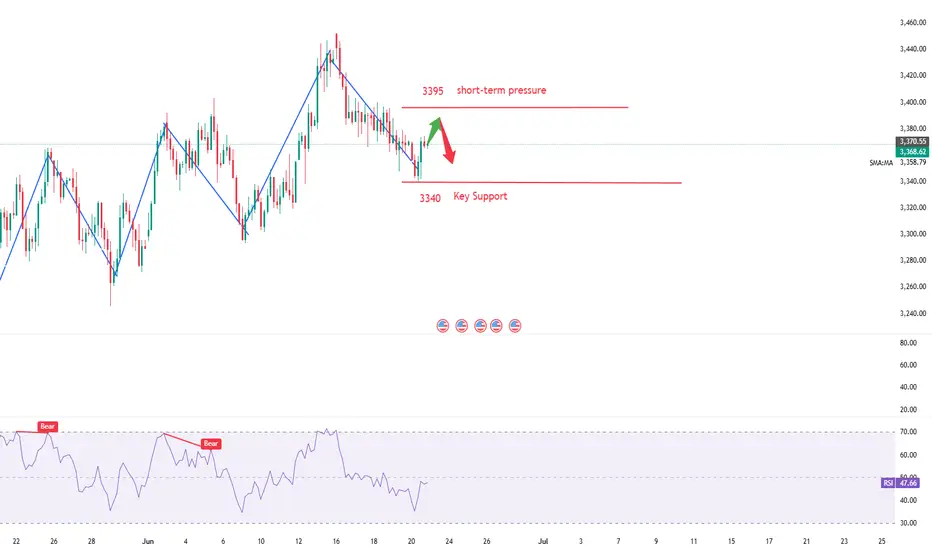
Next Week Gold Trend Forecast & Trading TipsDuring this round, the price was sold off sharply from the historical high of 3,500 to 3,120 before rebounding. After consecutive rallies, it faced pressure and fell back to 3,452 due to the fading of market risk aversion. On Friday, it rebounded from a low of 3,340. The daily chart recorded a consolidative bearish candle, with the K-line combination leaning bearish, while the 4H chart showed signs of stopping the decline.
In the short term, it is expected to consolidate below 3,400 next week. For the medium term, attention should be paid to the geopolitical crisis and the Federal Reserve's July interest rate decision. A breakthrough node will be ushered in after confirming the resistance above 3,400.
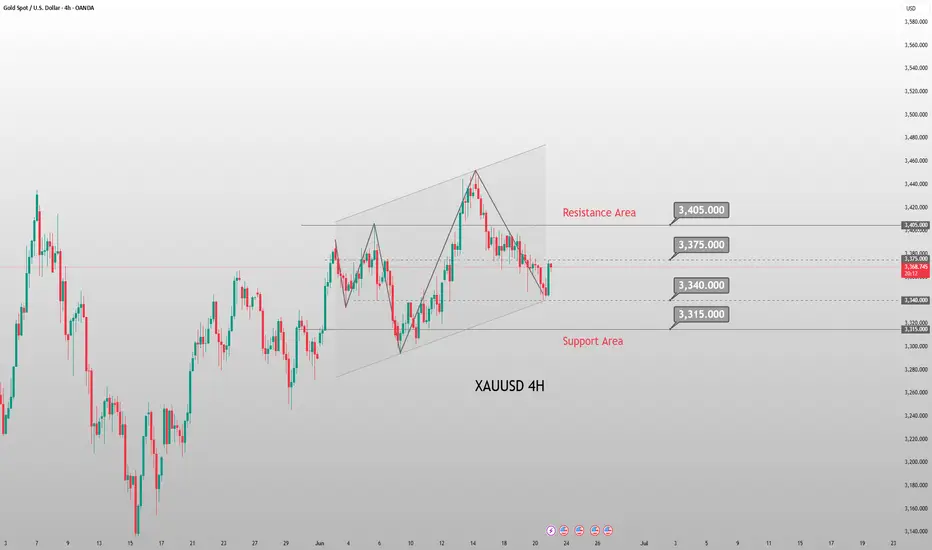
On the short-term 4-hour chart, the support below is focused around 3,340-45, and the short-term resistance above is around 3,380-85. The key focus is on the suppression at the 3,400-05 level. The overall strategy of going long on pullbacks within this range remains unchanged. For medium-term positions, it is advisable to stay on the sidelines, avoid chasing orders, and patiently wait for entry at key levels.
Investment itself is not the source of risk; it is only when investment behavior escapes rational control that risks lie in wait. In the trading process, always bear in mind that restraining impulsiveness is the primary criterion for success. I share trading signals daily, and all signals have been accurate without error for a full month. Regardless of your past profits or losses, with my assistance, you have the hope to achieve a breakthrough in your investment.
XAUUSD – Is Gold About to Break Out of Balance? Market Overview As the U.S. dollar maintains its upward momentum fueled by expectations that the Federal Reserve will keep interest rates elevated for an extended period, gold (XAUUSD) is currently trading near the key Point of Control (POC) for June. The consolidation around the $3,350–$3,360 zone indicates a temporary balance of supply and demand, and the market appears to be gearing up for a strong directional breakout in the upcoming sessions.
Detailed Technical Analysis ✅ Volume Profile & Price Structure
POC (highest volume level): $3,360 – the central volume area for the week/month
Current price: $3,353 – just below the POC, reflecting selling pressure dominance
Price is reacting to the demand zone at $3,343–$3,345, with significant volume support below
Short-term reversal signals from ParLE and ParSE indicators suggest a potential market shift
🔍 Key Resistance Levels:
$3,360 – POC and immediate resistance zone
$3,398 – previous supply zone with strong rejection history
$3,451 – Fibonacci extension high and the strongest resistance for the month
🔍 Key Support Levels:
$3,345 – high-volume support cluster
$3,343 – Fibonacci and dynamic support zone
$3,276 – final support before mid-term structure breakdown
🎯 XAUUSD Trading Strategy for Today (June 23, 2025) 🔻 Primary Scenario: SHORT based on short-term bearish structure
Entry: $3,358–$3,360 (on POC retest + bearish rejection candle)
Stop Loss: $3,370
Take Profits:
TP1: $3,345
TP2: $3,343
TP3: $3,327
Probability: High, if price remains below POC
🔺 Alternative Scenario: LONG if price holds $3,343 support
Entry: $3,343–$3,345 (strong bullish candlestick setup in demand zone)
Stop Loss: $3,330
Take Profits:
TP1: $3,360 (POC)
TP2: $3,383
TP3: $3,398
⚠️ Risk Warning & Macro Factors to Watch
The USD Index is surging – applying downward pressure on gold
Fed's short-term rate projections (FedWatch Tool) reflect “no cut” expectations through Q3
Traders should maintain tight risk management within high-volume zones to avoid false breakouts
Follow @Henrybillion ” to stay updated with the most accurate and actionable XAUUSD trading ideas every day!

GOLD Intraday H1 Chart Update For 23 June 25 GOLD Intraday Chart show mid term Bearish move for now
For Today keep an eyes on 3368 level Breakout for Buy Scalping for long trade we may wait for dip around 3330-3340 zone SL remains possibly 100 pips
As long as market sustains below 3400 Psychological Level it will remains Bearish and will try to move towards 3200-30 Psychological
6/23 Gold Analysis and Trading ViewsGood morning, everyone!
Over the weekend, former President Trump announced and carried out an attack on Iran's nuclear facilities, triggering a renewed wave of risk-off sentiment in the markets. At today’s open, gold surged to around 3394. Driven by geopolitical tensions, the bearish technical structure has temporarily been disrupted.
Whether the bullish momentum can sustain will depend on how the situation continues to unfold.
Key technical levels to watch today:
Resistance: 3389 / 3407 / 3423 / 3432
Support: 3372 / 3365 / 3356 / 3348
Trading strategy: Given the current news-driven market, a buy-on-dip approach is preferred, with short positions as a secondary option depending on price reaction near resistance zones.
Also, pay close attention to today’s daily close (1D chart). If the price closes below 3355, it could signal profit-taking from the bulls, potentially pulling gold back into a bearish technical trend.
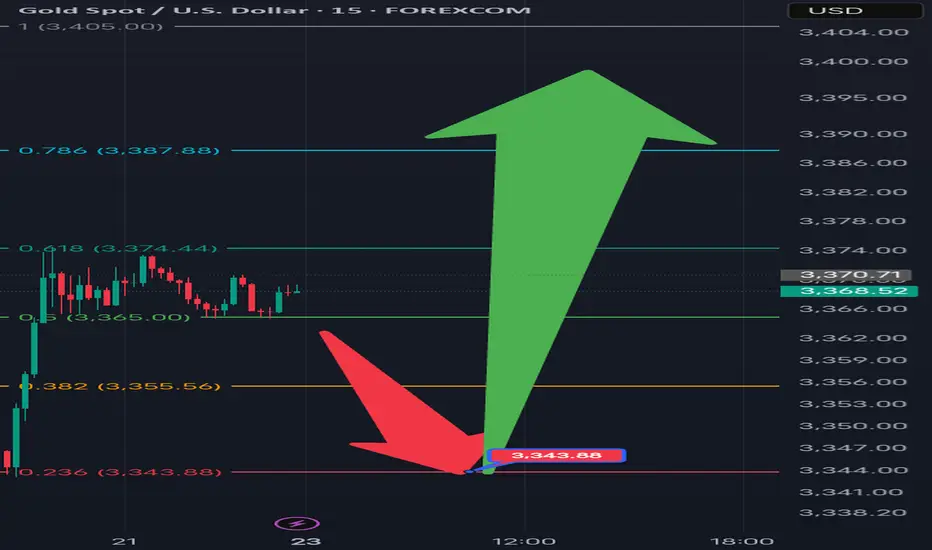
[XAUSD] Potential Bearish Move During Asian SessionAlthough sentiment going into Monday is broadly bullish , driven by escalating geopolitical tension and anticipation of a breakout, XAU/USD may still open with a brief pullback , not because traders are ignoring the situation, but because markets often test the conviction of retail and early-positioned bulls before making a decisive move.
When gold opens during the Asian session, a wave of participants—already leaning bullish—may rush in with early long entries. However, smart money and institutional traders often prefer to buy on value , not at the highs. So instead of chasing price above $3,368–$3,370 immediately, they may allow or even trigger a short-term flush— pushing price down to retest key support at $3,343.88 . This level aligns with prior structure and psychological comfort: it offers an opportunity for a cleaner re-entry , or for those who missed the move on Friday to establish positions.
This decline isn't a breakdown, but a strategic sweep of weak hands and stop losses —a classic fake-out move. Once that level is tagged and buyers step back in, the market quickly finds footing. With news-driven urgency and broader sentiment tilting toward risk aversion, gold recovers fast. By late Asia or early London hours, price grinds back toward the $3,385–$3,390 zone , right below the known bullish breakout ceiling.
This kind of "bearish tap then bullish reclaim" sequence builds the technical base necessary for a stronger breakout attempt later in the session—shaking out early longs and inviting smarter buying near support rather than resistance.
Analysis of Gold's Trend for Next WeekThe gold price peaked at the all-time high of 3,500 and then corrected to 3,120. After consecutive rallies, it faced resistance again at 3,452 due to the fading of market risk aversion. The week opened at around 3,433, hit a low of 3,340 on Friday, rebounded, and closed at around 3,368. The weekly candlestick closed bearish, but still above the 5-week moving average. The daily chart formed a doji star, with the candlestick pattern leaning bearish, while holding the middle 轨 (middle Bollinger Band) support. The 4-hour chart maintains an upward channel. As the market failed to break below the lower channel line this week, the downside space was not further opened. The price rebounded near the lower channel support at 3,340, showing temporary signs of stabilization. The short-term trend may continue to rebound, with key resistances at 3,380 and 3,404. If these resistances cannot be broken, the market will remain range-bound with a bearish bias. If broken upward, the bullish momentum of gold will truly emerge. Next week, if the opening strongly breaks through 3,380, we will go long on pullbacks. If there is no obvious change and it remains pressured at 3,380, we will continue to expect a decline.
you are currently struggling with losses,or are unsure which of the numerous trading strategies to follow,You have the option to join our VIP program. I will assist you and provide you with accurate trading signals, enabling you to navigate the financial markets with greater confidence and potentially achieve optimal trading results.
Trading Strategy:
sell@3390-3380
TP:3340-3350
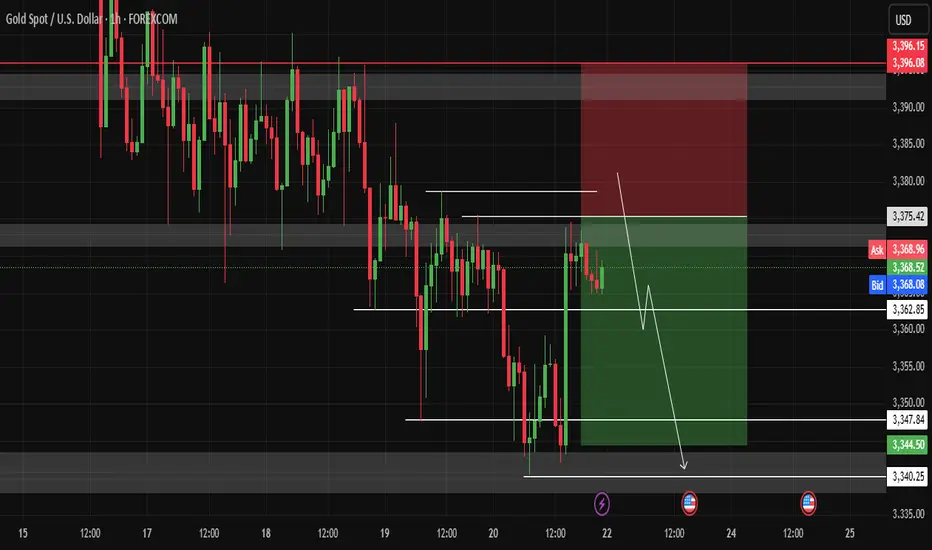
Geopolitical Hedging vs Monetary Policy: Gold Trading TipsGold prices continued this week's correction trend during Friday's Asian trading session, once falling near the one-week low. Although there was a slight rebound afterward, the overall trend remained in a weak adjustment pattern. This correction was mainly affected by the hawkish attitude of the Federal Reserve. At this week's policy meeting, the Fed kept interest rates unchanged, and the dot plot showed that only two rate cuts are expected by the end of 2025, while the rate cut expectations for 2026 and 2027 have been postponed. Even so, the US Dollar Index fell after hitting a weekly high, which provided some support for gold prices. In addition, growing trade concerns and escalating tensions in the Middle East have enhanced safe-haven demand, limiting the decline in gold prices.
From the 4-hour chart of gold, the current bullish momentum is dominant, and the resistance near 3375-3380 is clear. The pullback of gold prices has not broken through the upward channel for the time being, and the medium-to-long-term upward structure remains intact. If the Middle East conflict escalates or trade risks intensify, it may trigger a rebound and repair rally in gold prices. The daily chart closed in a doji star pattern, with prices retesting the middle 轨 of the Bollinger Bands, maintaining a volatile downward rhythm. The hourly chart shows significant downward characteristics, and a bearish strategy can be maintained before the resistance is broken. The resistance range is 3375-3380, and the support range is 3340-3345.
XAUUSD
sell@3070-3075
tp:3360-3350
Investment itself is not the source of risk; it is only when investment behavior escapes rational control that risks lie in wait. In the trading process, always bear in mind that restraining impulsiveness is the primary criterion for success. I share trading signals daily, and all signals have been accurate without error for a full month. Regardless of your past profits or losses, with my assistance, you have the hope to achieve a breakthrough in your investment.
USDJPY ANalysis week 26Fundamental analysis
The Fed kept interest rates unchanged and forecast only a small cut in 2026-2027 due to concerns about high inflation. The number of officials opposing a rate cut this year increased. The Israel-Iran conflict escalated, the US may attack Iran but is waiting for Tehran's response, causing the Japanese Yen to appreciate thanks to its safe-haven role.
Japan and the US have not reached a trade deal, the risk of higher tariffs before the July 9 deadline. The US dollar is near a one-week high, supporting the USD/JPY pair, but investors remain cautious due to the lack of new economic data.
Technical analysis
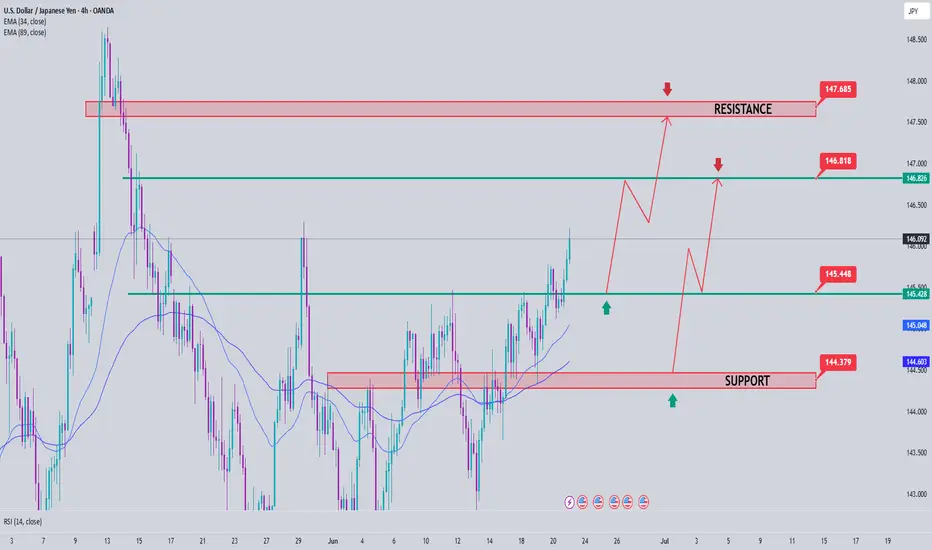
USDJPY is rising quite strongly and reacting at the resistance zone of 146.200. There is a possibility of a price gap next week, so trading early will be quite risky. The trading range is expected to be clearer at the resistance and support zones. 146,800 and 147,700 are noted as the two important upper boundary zones. 145,400 and 144,400 will be important support zones with a very strong buyer force waiting.
Trading Signals
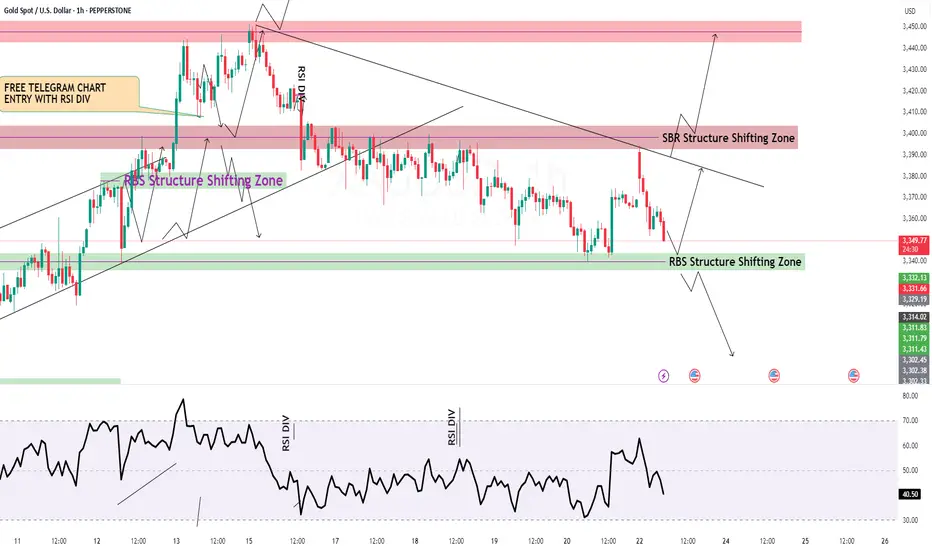
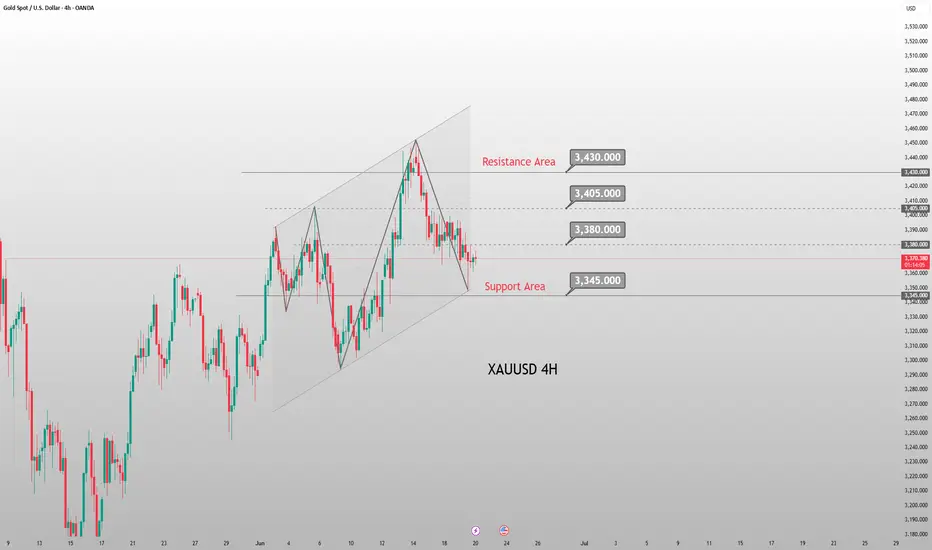
XAU/USD Bearish Pattern Analysis XAU/USD Bearish Pattern Analysis 📉
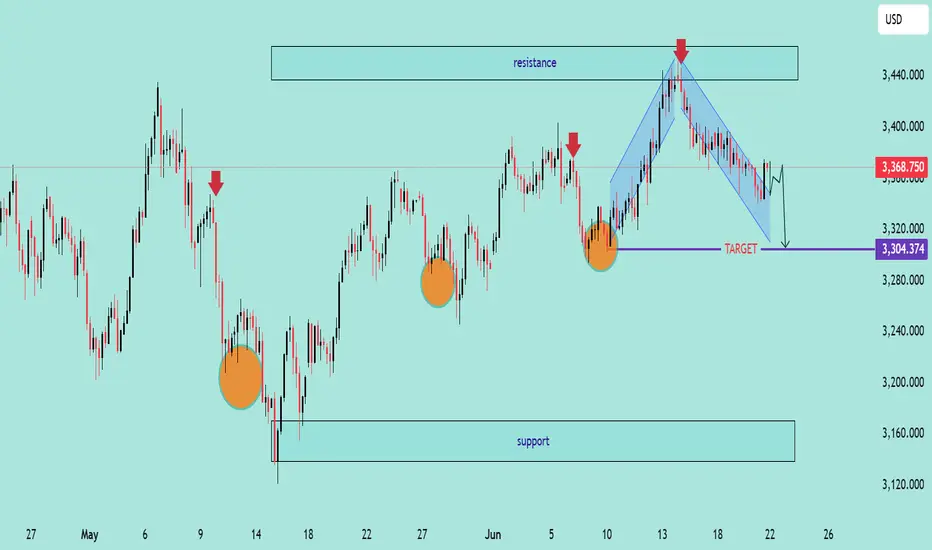
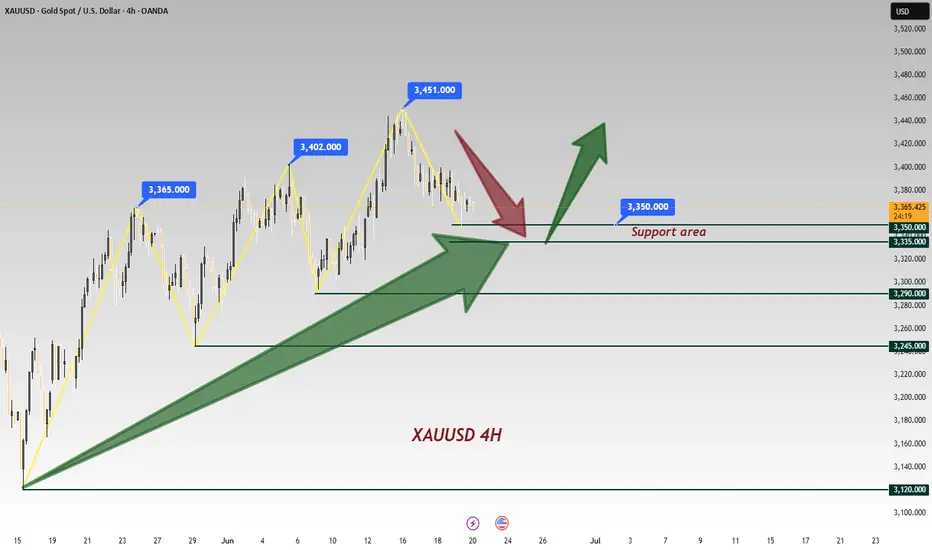
The chart presents a potential bearish continuation setup in the XAU/USD pair, highlighted by technical structures and key price levels:
📊 Technical Breakdown:
🔸 Bearish Rejection from Resistance
Price rejected strongly from the 3,440.000 resistance zone, marked with a red arrow.
This area has acted as a historical supply zone, triggering repeated reversals.
🔸 Descending Channel Formation 📉
A clear bearish flag/channel structure is visible post-rejection.
Price action broke down from the channel, signaling potential trend continuation.
🔸 Target Level 🎯
The expected target is around 3,304.374, aligning with previous support zones and structure lows.
This level coincides with a measured move from the channel breakdown.
🔸 Higher Lows Pattern Before Reversal ⭕
Prior to the current decline, the market formed a series of higher lows, highlighted with orange circles — suggesting a buildup before reversal.
🧭 Key Levels to Watch:
Resistance: 3,440.000 – 3,420.000 🔼
Current Price: 3,368.750
Short-Term Target: 3,304.374 🎯
Major Support: 3,140.000 – 3,160.000 🛡️
📌 Outlook:
The rejection from resistance coupled with the descending channel breakdown indicates bearish momentum. If the market maintains below the recent high, further downside towards 3,304 is expected. Break below this may expose deeper support zones.
📉 Bias: Bearish
⏳ Short-term Action: Watch for breakdown confirmation and momentum continuation.
XAUUSD Trading Signals: Buy Dips at 3335-3345 Amid Bear Trap💡 Trading Framework In-Depth Analysis:
The Fed's policy statement failed to stir volatility (markets had fully priced in dovish expectations 💨);
Weekly market pattern: Asian sessions consistently saw rallies 📈, followed by profit-taking pullbacks in subsequent sessions 📉;
Tactical entry logic: Use intraday highs in Asian trading as resistance references for long positions 🎯.
📊 Technical Validation & Risk Anchors
⚠️ Key Warning: Geopolitical bullish signals ignored → classic "bear trap" characteristics (bear trap 🚫);
⏳ Timing Strategy: Asian session highs form ideal resistance levels—recommend entering on pullbacks to the 38.2% Fibonacci support level 🎯.
⚡️⚡️⚡️ XAUUSD Precision Trading Signals ⚡️⚡️⚡️
🚀 Long Entry Range: 3335-3345 (stop loss can be set below 3325)
🚀 Take-Profit Target Range: 3360-3370 (partial profit-taking at first target 3360 recommended)
📢 Service Value-Added Notes
✅ Core trading signals updated daily in the morning (validated across 4-hour/daily double-timeframes);
✅ Refer to signal logic at any time during trading for sudden situations 🧭 (with historical win-rate statistics attached);
🌟 Wishing you smooth trading Next week — seize pullback opportunities to position 👇
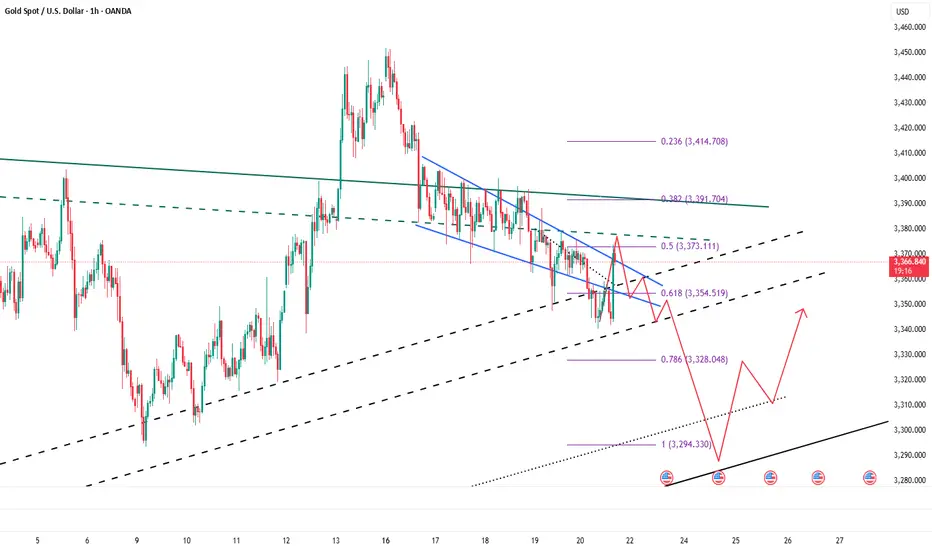
XAUUSD POSSIBLE TRADE SETUPPotential Trade Setup on XAUUSD
Overview:
Gold (XAUUSD) has shown consistent bullish momentum for over 16 months. Recently, we’ve seen a continuation of that strength, especially after breaking above the key $2,320 resistance zone. While there has been some temporary consolidation, the overall bullish structure remains intact, supported by ongoing geopolitical tensions and inflation hedging.
That said, I am still anticipating a possible continuation of the bullish momentum that has been in play for quite some time. Moving forward, I will be looking for a clear break above the 3380 region — followed by a successful retest of the breakout zone — before entering a long position.
Alternatively, a short opportunity may arise if the 3350 intraday resistance holds and the price fails to break above it. In that case, I will look for signs of further downward momentum toward the 3300 region.
🧭 Trading Plan:
✅ BUY:
Look for a break and retest of the 3355 region on the 4H timeframe.
🔻 SELL: Bias (Alternative Scenario):
If the price stays below the 3350 zone, then look for a potential short opportunity moving forward.
🎯 Targets & Risk Management: Targeting 1:2 R:R on both setups.
Gold Weekly Friday Trend Analysis and Trading RecommendationsOn Thursday, gold maintained a sideways trend, currently trading near $3,370. It hit a low of $3,347 and then rebounded immediately, while yesterday's Federal Reserve interest rate decision had little impact on market volatility. Since Monday, when bearish forces were stronger than bullish ones, the gold market has been seeing equalized bullish and bearish forces, consolidating as it waits for the next stimulus direction.
Once it stabilizes above $3,400 again, there is likely to be an inflection point, and it will gradually rise to test the upper track at $3,460–3,470. At the 4-hour level, it is currently under pressure at the middle track of $3,405, with support at $3,345.
Gold may break out of the current range on Friday. Intraday trading can focus on range operations between the support of $3,345 and the resistance of $3,400: when the gold price stabilizes above $3,360, you can lightly go long, with targets sequentially at $3,375 and $3,395; if it is resisted below $3,395, you can try to lightly go short.
XAUUSD
buy@3350-3360
tp:3380-3390-3400
Investment itself is not the source of risk; it is only when investment behavior escapes rational control that risks lie in wait. In the trading process, always bear in mind that restraining impulsiveness is the primary criterion for success. I share trading signals daily, and all signals have been accurate without error for a full month. Regardless of your past profits or losses, with my assistance, you have the hope to achieve a breakthrough in your investment.
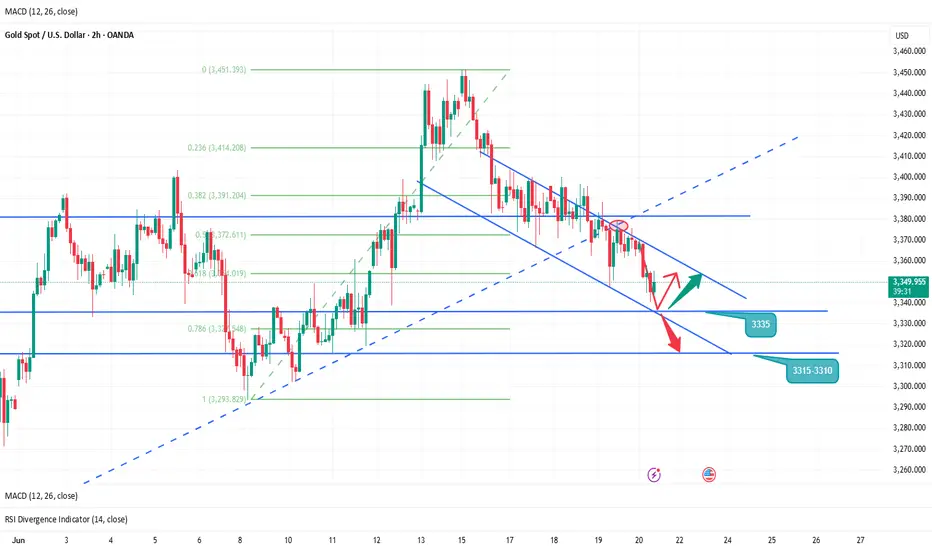
The rebound is weak, is it expected to continue to decline? 📰 Impact of news:
1. Geopolitical situation
2. Pay attention to the impact of short-term trends of the US dollar and silver on gold
📈 Market analysis:
The weekly level large range sweep is still going on, with a focus on the space defense dividing line area of the 10-day moving average and the 3315-3310 area. After falling back to the lifeline in four hours, it continued to bend downward under pressure. During the sweeping decline, the suppression became more obvious. Whether there will be a wave of large-volume market, the pattern is expected to further open and guide the direction. In this process, note that the lifeline 3375 is also the resistance point determined by the last rebound last night. Use this as suppression to sweep the range below. On the whole, for the future gold, if it can maintain the rhythm of defending highs and breaking lows, and successfully closes at a low level today, then next week it is expected to further switch downwards to sweep space. Therefore, we will continue to focus on two support areas, one is 3345-3335, and the other is 3315-3310 after breaking
🏅 Trading strategies:
BUY 3345-3335
TP 3355-3365
SELL 3365-3375
TP 3345-3335-3315
If you agree with this view, or have a better idea, please leave a message in the comment area. I look forward to hearing different voices.
TVC:GOLD FXOPEN:XAUUSD FOREXCOM:XAUUSD FX:XAUUSD OANDA:XAUUSD
XAUUSD:Go long before you go short
Yesterday's market is relatively fast, we pay attention to the stop profit point, today's Asian plate fell, technical point of view, this week after the big Yin, there is little strength of the rebound, often after the reverse draw will be recovered, the same down after the rapid counterattack, short-term overall performance for the shock downward trend, the center of gravity moving down.
The trading space is also gradually shrinking, within the day can be around 3340-3370 range to operate.
Trading Strategy:
BUY@3344-49
TP:3365-70
Consider going short at 3370-75
More detailed strategies and trading will be notified here ↗↗↗
Keep updated, come to "get" ↗↗↗

Stick to shorting gold and holding itAlthough gold has risen sharply to around 3375 in the short term due to the dovish remarks of Fed officials, it has not made an effective breakthrough. Therefore, gold has not reversed its trend due to the short-term rebound. Gold is still in an obvious short trend. In the short term, gold is obviously under pressure in the 3365-3375 area. If gold fails to break through this resistance area, then after gold consumes a certain amount of long energy, gold shorts will counterattack again and are expected to retreat to the 3350-3340 area again.
In the case that good news cannot support the continued rebound of gold, the market's bullish confidence will be hit again, and the short confidence will be further strengthened, stimulating gold to accelerate its decline, and it is even expected to fall below the 3350-3340 area. Therefore, in short-term trading, I still advocate shorting gold, and I am currently holding a short position in gold, and I look forward to the accelerated decline of gold as expected!
Gold Pullback: Bear Trap or Buy Dip?📊 Chart Analysis: A clear pullback within the established uptrend is visible, testing key support at —a healthy correction that reinforces the bullish structure.
🔍 News Contradiction🌍: Despite escalating Middle East tensions (typically a gold-positive catalyst), prices are trending lower—a classic bear trap scenario 🚫📉. This divergence underscores the importance of buying dips amid emotional sell-offs.
💡 Trading Framework:
Fed policy statement yesterday failed to spark volatility, as markets had already priced in dovish expectations 💨;
Weekly pattern: Asian sessions have consistently seen rallies 📈, followed by profit-taking pullbacks in later sessions 📉;
Tactical entry: Use intraday highs from Asian trading as resistance references for long positions 🎯.
Technical Confirmations:
Risk Warning: Geopolitical bullish signals being ignored suggests deliberate bearish manipulation (bear trap 🚫);
Timing Strategy: Asian session highs serve as ideal resistance markers—look to enter on retracements to 38.2% Fib levels 🎯
⚡️⚡️⚡️ XAUUSD ⚡️⚡️⚡️
🚀 Buy@ 3335 - 3345
🚀 TP 3360 - 3370
Accurate signals are updated every day 📈 If you encounter any problems during trading, these signals can serve as your reliable guide 🧭 Feel free to refer to them! I sincerely hope they'll be of great help to you 🌟 👇
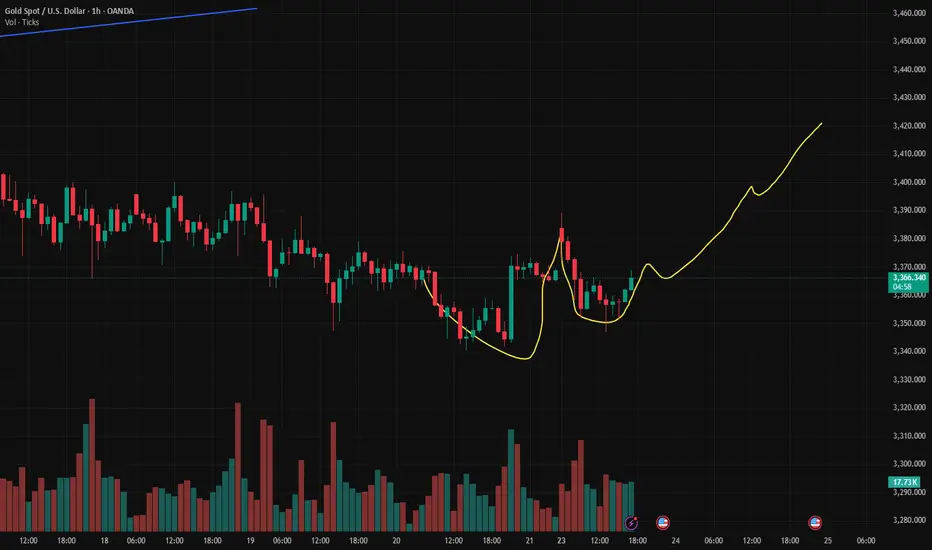
Gold Trading Strategy June 20Daily candle continues to show a struggle while the Sellers are dominating. Today there may be a deep sweep and then a recovery at the end of the day.
Yesterday's 3343 zone is reacting 5 prices in the direction of profit. Next support around 3323 pay attention to the next sweep. Pay attention to additional daily support at 3296 for today's buy strategy.
3362 gives a SELL Break out signal in the Asia-Europe session. If Gold closes back above 3362, then BUY to 3400 target the two upper resistance zones remain the same as yesterday at 3415 and 3443
Resistance: 3400-3415-3443
Support: 3323-3296
Break out: 3362
6/20 Gold Analysis and Trading SignalsGood evening, everyone!
After gold rallied to around 3388 yesterday, it began to retrace gradually, providing solid returns for our sell-side strategy.
As of now, gold has dipped to a session low near 3339. On the 30-minute chart, the MACD has formed a bullish crossover, and price has broken above the Bollinger mid-band, indicating short-term bullish momentum. The candle structure supports a potential rebound, but strong overhead resistance remains.
Key resistance comes from the 1H MA60 around 3371, and gold still trades within a broader bearish trend on the daily timeframe. While bulls may attempt a recovery, a complete trend reversal remains unlikely unless significant bullish catalysts emerge.
Hence, our strategy continues to favor selling near resistance levels, while cautiously considering long entries near well-defined supports.
📌 Trading Plan (VIP Focus):
✅ Sell Zone: 3370–3383
✅ Buy Zone: 3338–3321
✅ Flexible Trade Range: 3366-3349
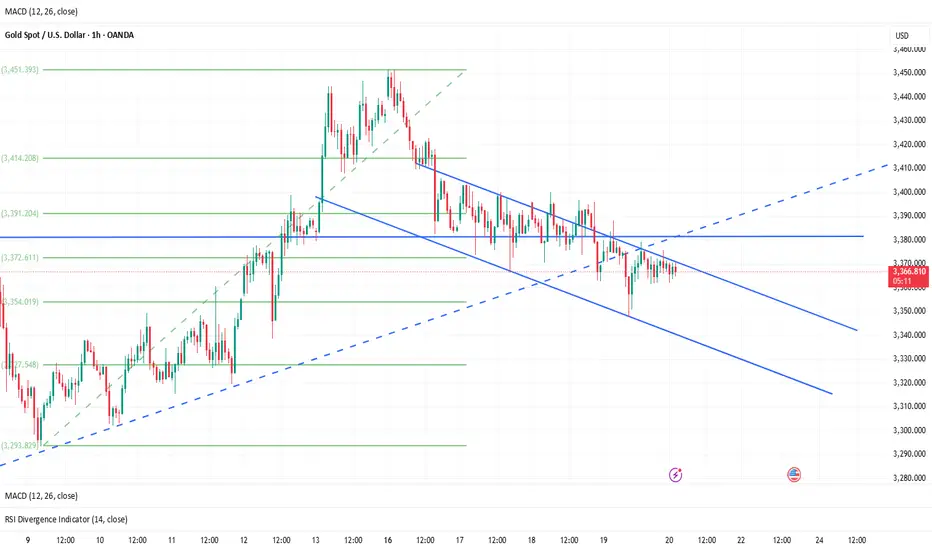
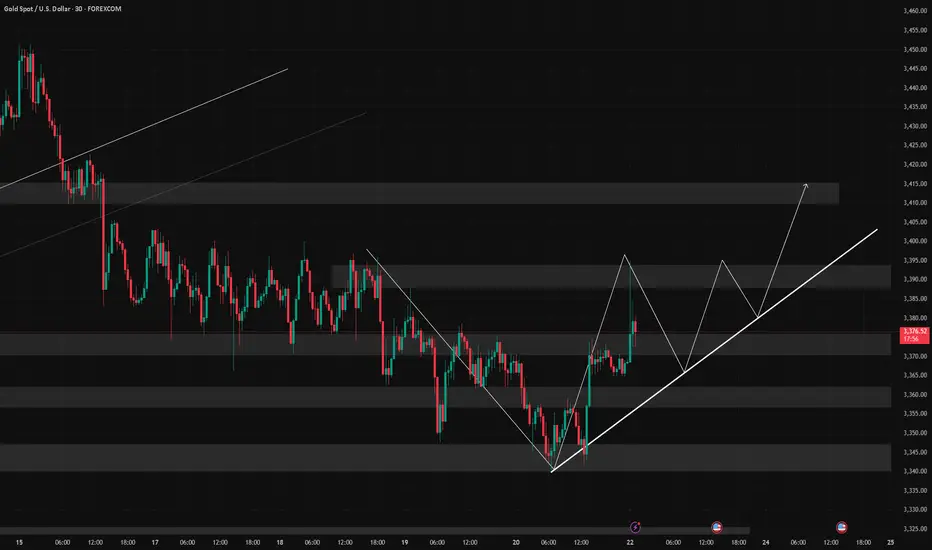
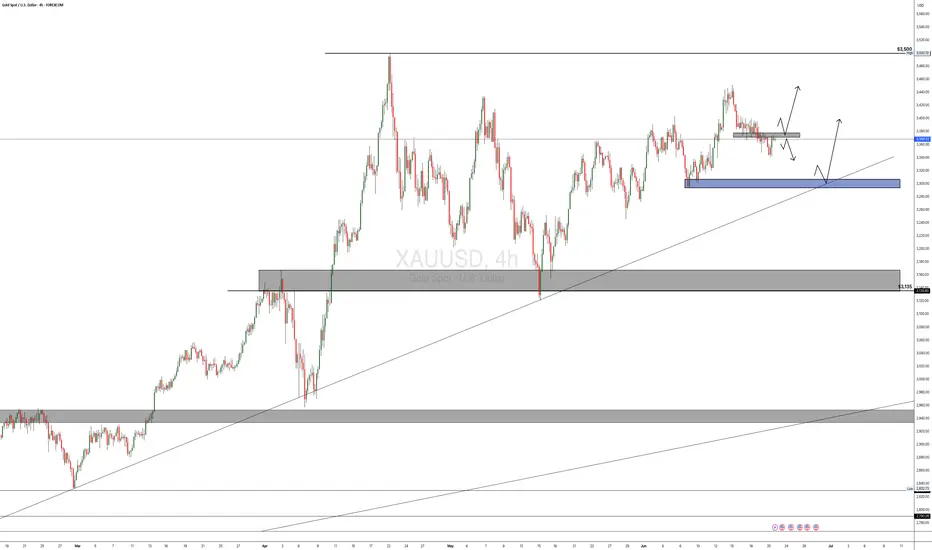
Gold Eyes Breakout from Ascending Channel Toward $3,500📈 Chart Analysis
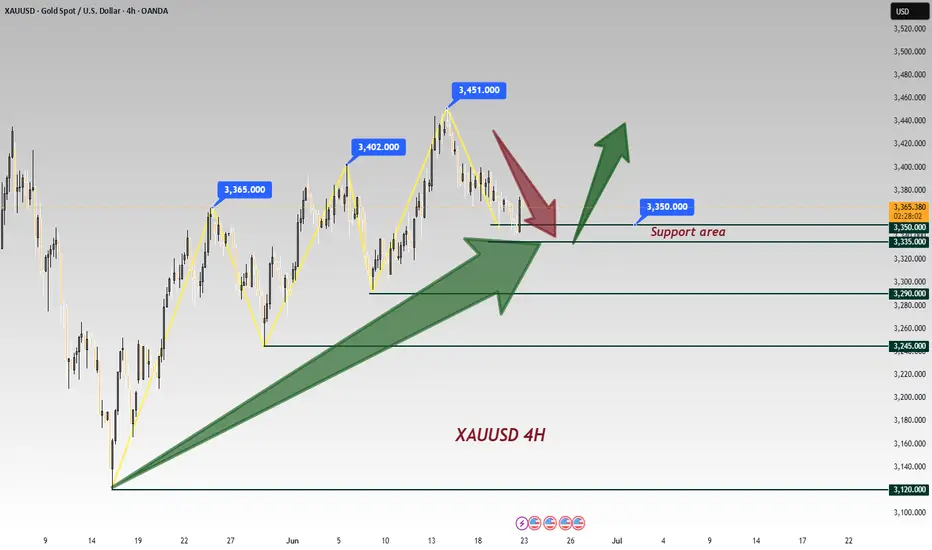
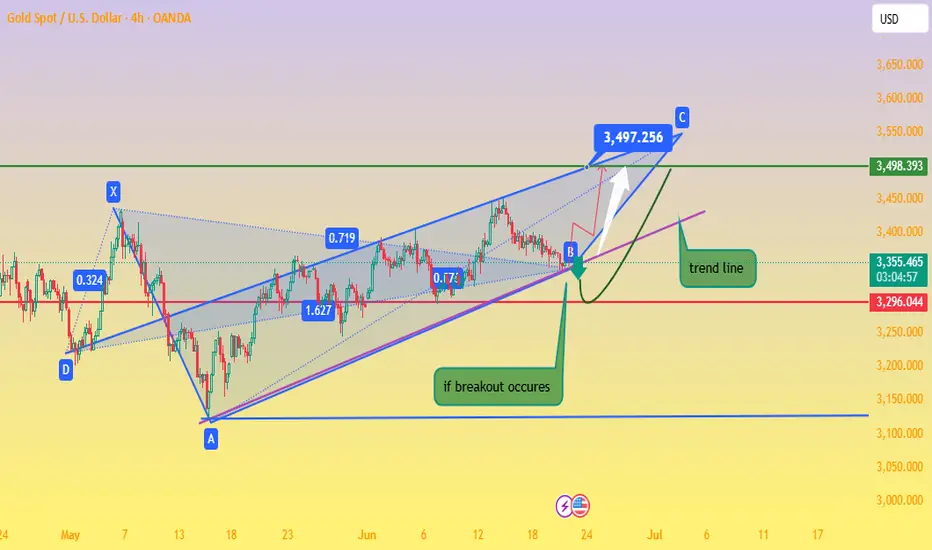
1. Rising Channel Structure
Gold (XAU/USD) has been trading within an upward-sloping channel, marked by the blue trendlines connecting interior lows and highs, culminating at point C (~$3,497). The latest bounce off the lower channel near “B” reinforces bullish bias – if this trendline holds, another leg higher toward resistance around $3,497–$3,500 is likely.
2. Support & Resistance Confluence
The purple trendline and the dotted horizontal green level (~$3,498) converge near the projected breakout point. This synergy provides a strong pivot zone — a successful breakout would validate targets near channel highs.
3. Harmonic Pattern in Play
The chart displays a bullish harmonic structure (likely a Bat or Gartley formation), with retracement ratios (0.719, 1.627) anchoring reversal areas. These reinforce the bounce at B and the potential move toward point C.
4. Trade Scenarios
Bullish Scenario (primary): A bounce off the trendline triggers a rally to the channel top and resistance zone ($3,497–$3,500).
Bearish Caution: A drop below the trendline invalidates the pattern, potentially bringing prices back to horizontal support around $3,296 or even $3,120, as indicated at point A.
🛠️ Technical & Market Context
Technicals: Daily trend remains bullish as long as price holds above ~$3,340–$3,350, with resistance forming in the $3,380–$3,400 range
Fundamentals: Geopolitical tension (e.g., Middle East conflict) and safe-haven inflows continue to underpin gold — though Citi expects prices to eventually correct toward $3,300–$3,500 mid‑term
.
Sentiment: Some analysts advocate “selling the rallies,” especially into the $3,450–$3,500 zone . But central banks’ ongoing buying and potential Fed rate cuts support a stronger floor
.
✅ Trade Strategy
Scenario Entry Zone Target Stop Loss Placement
Play the Bounce ~$3,350–$3,360 $3,497–$3,500 Below trendline near B zone (~$3,320)
Breakout Trade On momentum above $3,400 $3,497–$3,550 Below breakout (sub-$3,380)
Bearish Trigger Break & close below trendline Back to $3,296 / 3,120 Just above trendline ($3,360)
🔍 Summary
Gold remains in a structurally bullish setup inside an ascending channel. The confluence of harmonic reversal, strong trendline support, and pending fundamental catalysts presents a high-probability opportunity to push toward the $3,500 area—provided the trendline and $3,340–$3,350 support hold. A drop below would invalidate the bullish outlook and favor deeper retracement.
XAUUSD Analysis todayHello traders, this is a complete multiple timeframe analysis of this pair. We see could find significant trading opportunities as per analysis upon price action confirmation we may take this trade. Smash the like button if you find value in this analysis and drop a comment if you have any questions or let me know which pair to cover in my next analysis.

The bear market is over? Short at high and long at low📰 Impact of news:
1. The interest rate remains unchanged and leads to new lows in the short term
2. Geopolitical tensions provide support for risk aversion
📈 Market analysis:
Due to the early closing yesterday, the volatility of the US market was limited and the market seemed relatively flat. From a technical perspective and the current trend, 3340 is a key defensive support level. If it retreats to this level, you can consider going long. If the gold price continues to rise and reaches 3375, from the perspective of trading strategy, you can choose to place a short order here. Focus on the resistance line of 3370-3375 during the day, and pay attention to the support of 3345-3335 below.
🏅 Trading strategies:
SELL 3370-3375
TP 3360-3355-3345
BUY 3345-3335
TP 3360-3370
If you agree with this view, or have a better idea, please leave a message in the comment area. I look forward to hearing different voices.
OANDA:XAUUSD FX:XAUUSD FOREXCOM:XAUUSD FXOPEN:XAUUSD TVC:GOLD