Gold Broke Out – Another Drop Loading?OANDA:XAUUSD TVC:GOLD Gold is attempting a rebound but faces strong resistance near $3,364–$3,368, where previous support converges with the descending trendline (TL1). A clear rejection here could resume the bearish momentum.
Technically, the price is hovering just below the TL1 resistance. The zone around $3,368 is critical — if bulls fail to reclaim this area, we could see a move back toward the $3,326 support, with a deeper target near weekly support at $3,310.
📉 A rejection around current levels = high probability drop
📈 Break and hold above TL1 = potential short-term reversal
🧠 Macro Check:
Despite intensifying Middle East tensions (Israel-Iran conflict escalating, Trump weighing intervention), gold remains under pressure. The Fed’s hawkish hold, persistent inflation, and a strong dollar continue to weigh on bullion in the near term.
🔍 Key Levels:
Resistance: $3,364–$3,368 (structure + TL1)
Support: $3,326 / $3,310
Bias: Bearish below $3,368
Setup Idea: Watch for rejection near resistance for short setups toward $3,326 and $3,310
Xauusdshort

Gold Pullback in Uptrend Amid Middle East Tensions: Buy the Dip?📊 Clearly visible on the chart: current pullback within an uptrend.
🔍 News paradox: Despite escalating Middle East tensions 🌍, gold is trending lower—a key reason to emphasize buying the dip recently (watch out for bear trap scenarios 🚫📉).
💡 Trading logic breakdown:
Fed statement yesterday caused minimal volatility (market expectations priced in 💨);
This week’s pattern: Asian session rallies 📈 followed by post-Asian pullbacks 📉;
Entry strategy: Use Asian session highs as resistance reference for entries 🎯.
Technical reinforcement:
Risk alert: Geopolitical bullishness ignored → classic bear trap signal (bear trap 🚫);
Timing: Asian session highs form intraday resistance 🎯—look to enter on retracement.
Chart says it all—normal pullback in an uptrend 📊. Ironically, while Middle East conflicts should be gold-positive 🌍, prices are moving lower—a textbook 'buy the panic' setup 🚀. Following this week’s playbook 📅 (Asian session highs followed by dips), focus on Asian session highs as a resistance anchor for entries
⚡️⚡️⚡️ XAUUSD ⚡️⚡️⚡️
🚀 Buy@ 3345 - 3355
🚀 TP 3370 - 3380
Accurate signals are updated every day 📈 If you encounter any problems during trading, these signals can serve as your reliable guide 🧭 Feel free to refer to them! I sincerely hope they'll be of great help to you 🌟 👇

The market is closed today. How to arrange gold in the evening?📰 Impact of news:
1. The interest rate remains unchanged and leads to new lows in the short term
2. Geopolitical tensions provide support for risk aversion
📈 Market analysis:
The market is expected to not fluctuate much today. Generally speaking, it is difficult to stand on one foot to form a short-term bottom. There should be a second wave of bottom exploration, a secondary low point, and then the bottom is explored and pulled up to break through the previous high point. Only then can the turning point be officially established and the decline end. Moreover, the 1H moving average is spreading downward. Therefore, in the short term, we still pay attention to the 3375-3385 line of resistance and the 3360-3355 line of support below.
🏅 Trading strategies:
SELL 3375-3385
TP 3365-3360-3355
BUY 3360-3355
TP 3370-3380-3405-3420
If you agree with this view, or have a better idea, please leave a message in the comment area. I look forward to hearing different voices.
TVC:GOLD FXOPEN:XAUUSD FOREXCOM:XAUUSD FX:XAUUSD OANDA:XAUUSD
Continue to short gold after the reboundGold has currently hit a low of around 3347, and rebounded after slightly breaking through 3350. It has now rebounded to around 3370. Will gold continue to rebound and hit 3400 again?
I think it is unlikely that gold will continue to rebound and hit 3400 in the short term. From a fundamental perspective, many of the news leaked out about the situation in the Middle East are untrue, and the conflict has not escalated further, so gold has not reacted much to this; and as market expectations for interest rate cuts decrease, the impact of news supporting gold's upward trend is gradually weakening;
From the current structure, since gold fell below 3370, bears have completely taken the upper hand. Although gold has rebounded from around 3347, it is only a short-term technical repair and oversold rebound from a structural perspective, and it cannot be said that it is a restart of bulls. So I think gold still has the risk of a second decline after the rebound, and once gold falls again, it may trigger a large number of profit-taking orders and a large number of short-sellers to enter the market.
As the center of gravity of gold shifts downward, the short-term resistance area moves down to 3380-3390; the current support area below is near 3350, followed by 3335. So for short-term trading, I still prefer gold short trading, and we can continue to short gold with this short-term resistance area.
GOLD Finally Breakout , Short Setup Valid To Get 200 Pips !Here is my opinion , after this amazing 4H / Daily Breakout , we should sell Gold From Area Between 3377.00 / 3375.00 And Targeting 250 Pips At Least .
Fed Rate Decision: Gold's 3,400 Threshold as Bull-Bear DivideToday, the market has consolidated in a range throughout the day, with neither price direction nor volatility breaking through the range. However, our trading approach proved accurate: short positions were initiated near 3,400 during rebounds, and long positions were entered near the key level of 3,370 during pullbacks. Investors following our strategy have achieved profits from both directions. With limited price movement currently, the Fed's interest rate decision due to land in an hour will become the core variable dominating the market trend for the rest of the month.
Currently, gold prices continue to trade below the 3,400 threshold, maintaining a weak market structure. The 3,400 level serves as a key watershed between bulls and bears, and the validity of its breakthrough will determine the trend inflection point: if prices effectively hold above 3,400 after the data release, it indicates that gold will break out of its weak pattern, with the potential for an accelerated rally ahead. Conversely, if prices remain suppressed below 3,400, it is highly likely to trigger further downward exploration. It is recommended to closely monitor the breakthrough signal at the 3,400 threshold after the data release, using this as the operational basis for trend switching.
XAUUSD
buy@3370-3380
tp:3400-3420-3450
Investment itself is not the source of risk; it is only when investment behavior escapes rational control that risks lie in wait. In the trading process, always bear in mind that restraining impulsiveness is the primary criterion for success. I share trading signals daily, and all signals have been accurate without error for a full month. Regardless of your past profits or losses, with my assistance, you have the hope to achieve a breakthrough in your investment.
XAUUSD:Today's Trading Strategy
Yesterday, gold prices fluctuated greatly in the US, and around 3400 has become an important pressure level at present. If you want to short, you can consider 3395-3400. At present, the price is near 3362, and the trading idea is mainly long first.
Trading Strategy:
BUY@3357-62
TP:3375-80
↓↓↓ More detailed strategies and trading will be notified here ↗↗↗
↓↓↓ Keep updated, come to "get" ↗↗↗

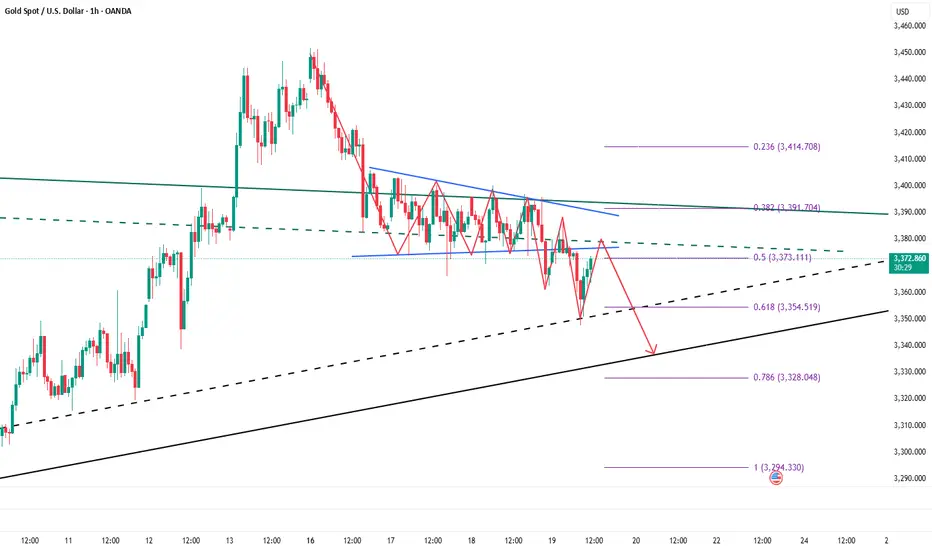
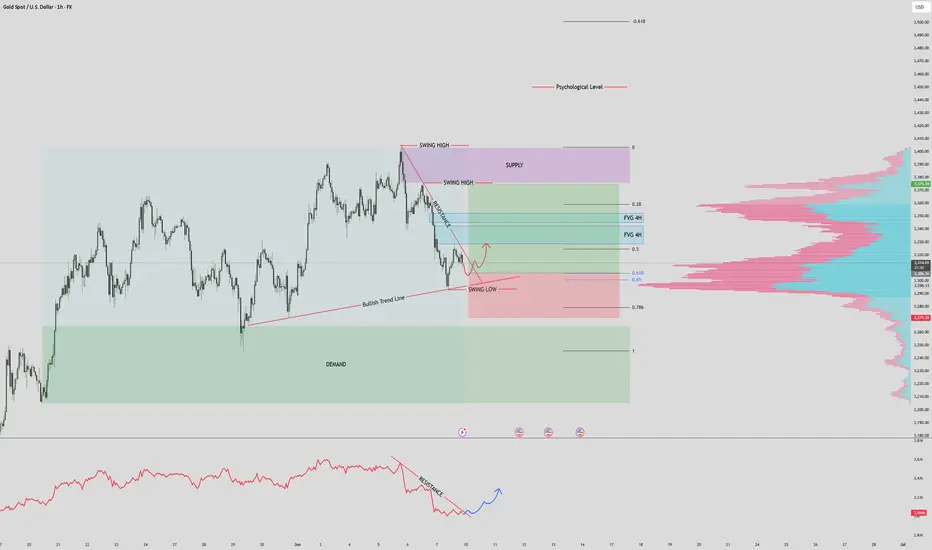
Gold Spot (XAU/USD) $3400 Incoming again??Gold Spot (XAU/USD) – 1H Chart:
Chart Overview:
Overall Market Context:
Gold is currently retracing after a strong downtrend from a swing high near the supply zone. Price is reacting near a key bullish trend line and a local swing low.
Key Technical Elements:
OBV (On-Balance Volume):
The OBV has broken out of its downtrend resistance, suggesting a potential reversal in volume flow.
This shift implies bullish momentum could be building.
Trendline & Structure:
Price is respecting a bullish trend line, which has acted as dynamic support across multiple touches.
The current swing low sits right on this trend line, suggesting a possible bounce scenario.
Fair Value Gaps (FVGs) – 4H:
Two FVGs are located above current price around the 0.28–0.5 Fibonacci zone, indicating a likely magnet area if price starts to retrace upward.
These FVGs may act as short-term targets or resistance zones.
Fibonacci Retracement:
Price is currently near the 0.618–0.65 retracement zone, a classic golden pocket reversal area.
If price holds this level, a bounce toward the FVGs and supply zone is likely.
Supply Zone:
The major resistance sits above at the supply zone formed around the previous swing highs.
A rejection here could signal a return to range or continuation lower if not broken.
Demand Zone :
Below current price, a strong demand zone is marked, which historically triggered a large upward move.
If price fails to hold the trendline/swing low, this would be the next key support area to watch.
Scenarios:
🔼 Bullish Case:
OBV breakout holds and price bounces from the trendline/swing low.
Price moves up into the FVG zones and attempts to reclaim the previous swing high.
If it breaks above the supply zone, the next logical targets would be the psychological levels (e.g., $3,400+).
🔽 Bearish Case:
Failure to hold the current trendline and swing low.
Break below could lead to a move toward the demand zone, possibly sweeping lows and filling deeper FVGs.
If volume remains weak on bounce attempts, continuation of the downtrend is likely.
Summary:
Gold is at a critical inflection point. The bullish trendline and swing low offer a potential reversal area, supported by a breakout in OBV. A recovery into the FVGs above looks likely if price can maintain this level. However, failure here would lead to a drop toward the demand zone. Traders should monitor volume, OBV continuation, and price action near FVGs for confirmation.
Accurately grasp the interest rate trend, today's gold layout📰 Impact of news:
1. The interest rate remains unchanged and leads to new lows in the short term
2. Geopolitical tensions provide support for risk aversion
📈 Market analysis:
I told you yesterday that 3363 is not the recent low. Today's lowest point has reached around 3347. The current day's K-line closed with a medium-sized negative line with balanced upper and lower shadows. The shape shows that gold will fluctuate in the short term and be bearish. Therefore, it is not suitable to blindly guess the bottom in the short term. As geopolitical tensions still exist, it is expected that the lowest level may reach 3330. During the day, focus on the upper resistance range of 3380-3390. If the rebound is blocked, try to intervene with short orders. The lower support is at the key level of 3330-3320. Pay attention to the defense of the support area.
🏅 Trading strategies:
BUY 3335-3325
TP 3360-3380-3390-3400
SELL 3375-3385
TP 3365-3355-3345-3300
OANDA:XAUUSD FX:XAUUSD FOREXCOM:XAUUSD FXOPEN:XAUUSD TVC:GOLD
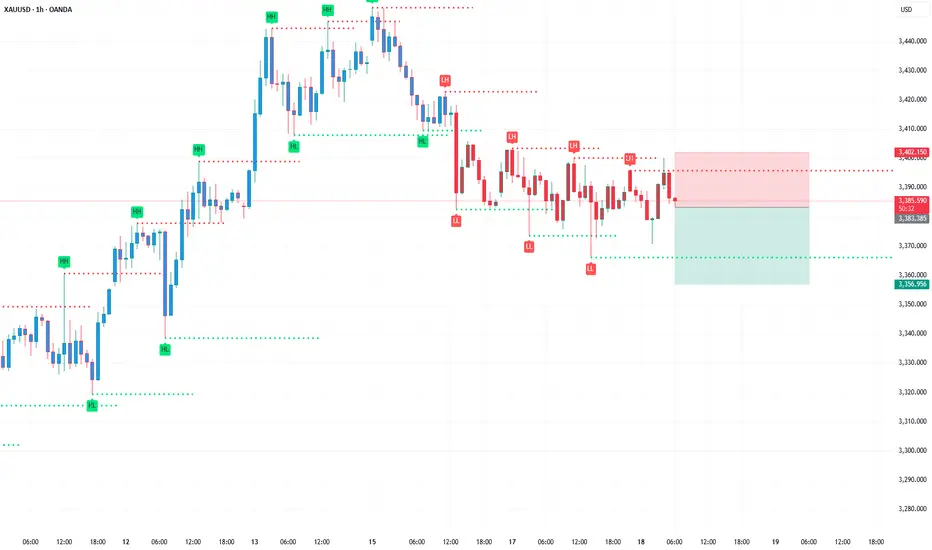
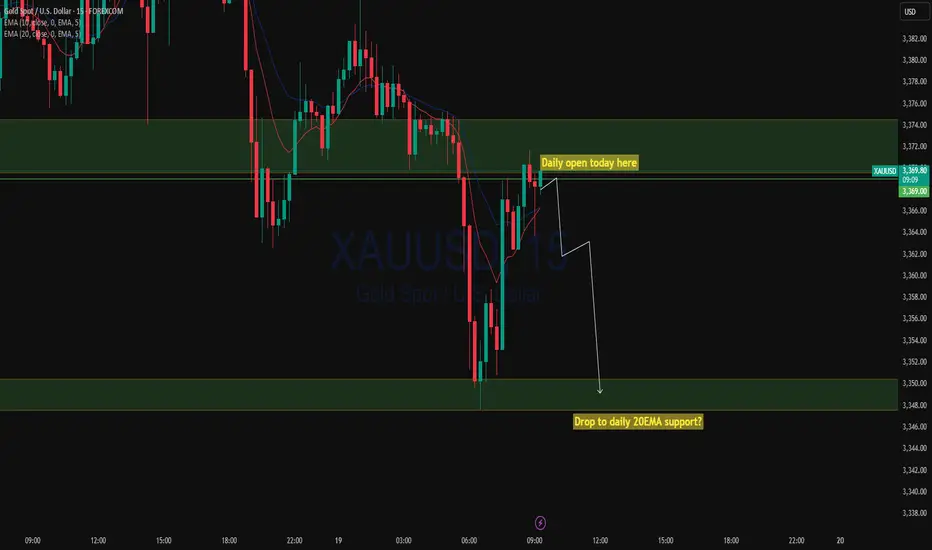
XAUUSD Drop to daily support?XAUUSD After testing the daily resistance market has managed to reject with a momentum to daily 20ema early today. As we can see series of lower low and lower highs, price may continue to drop to daily 20ema again as, from weekly perspective we can see that price is pushing down to potentially to weekly key level of resistance.
Wyke of Gold ZoneHey guys as we can see we have a super breakout from the sideways phase and now with the retest we go Liq hunting :D

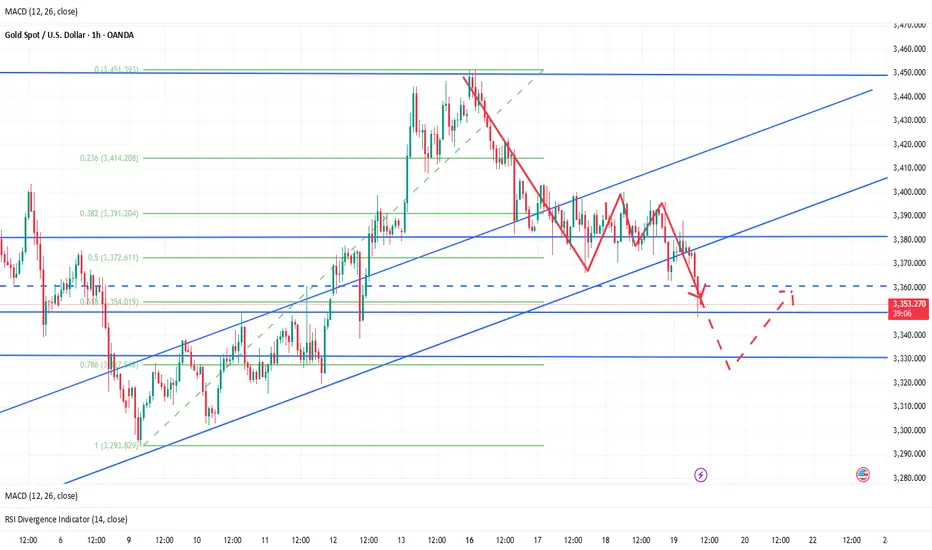
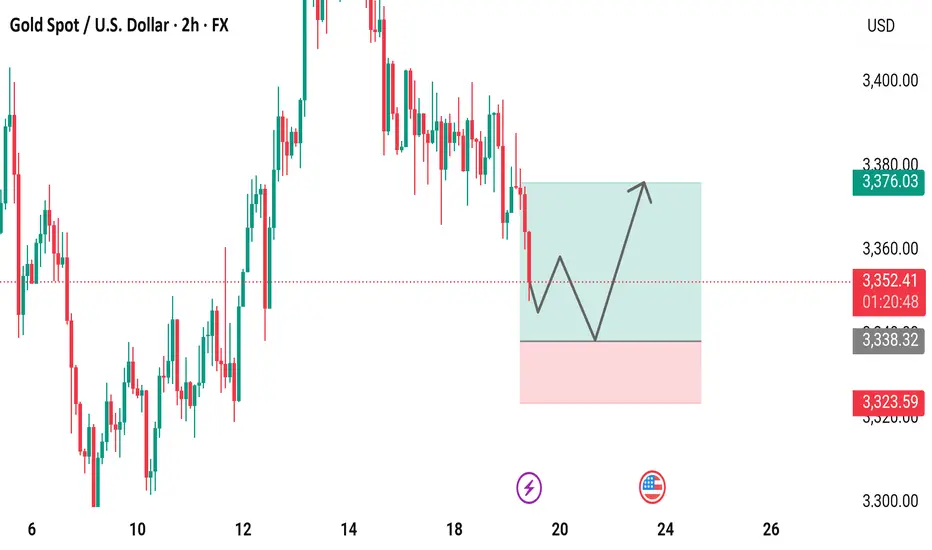
Gold Spot / U.S. Dollar (XAUUSD) 2-Hour Chart2-hour chart displays the price movement of Gold Spot (XAUUSD) against the U.S. Dollar, showing a current price of $3,352.73 with a decrease of $16.20 (-0.48%) as of 01:22:11. The chart highlights a recent downward trend following a peak, with a shaded area indicating a potential support or resistance zone around $3,360 to $3,400. Key price levels are marked, including $3,400.00, $3,376.03, and $3,323.59, with candlestick patterns reflecting market volatility.
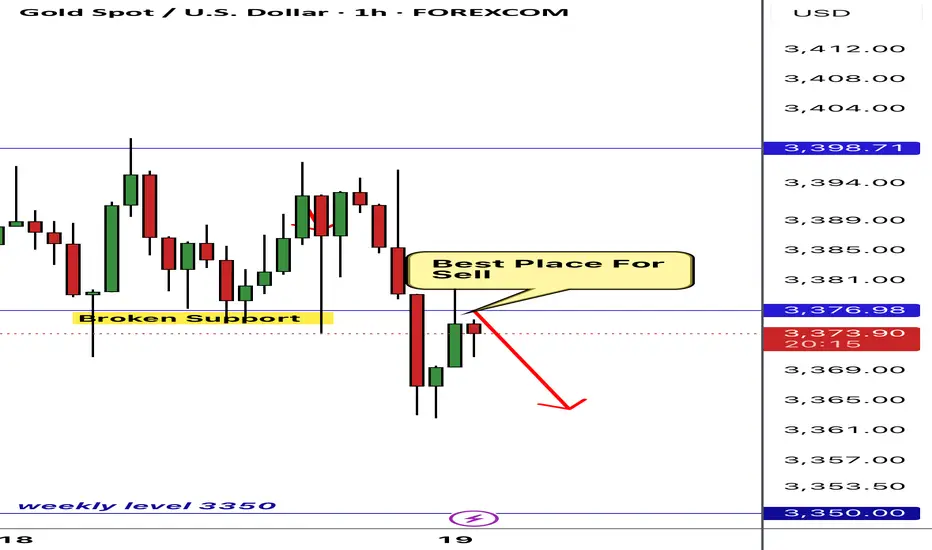
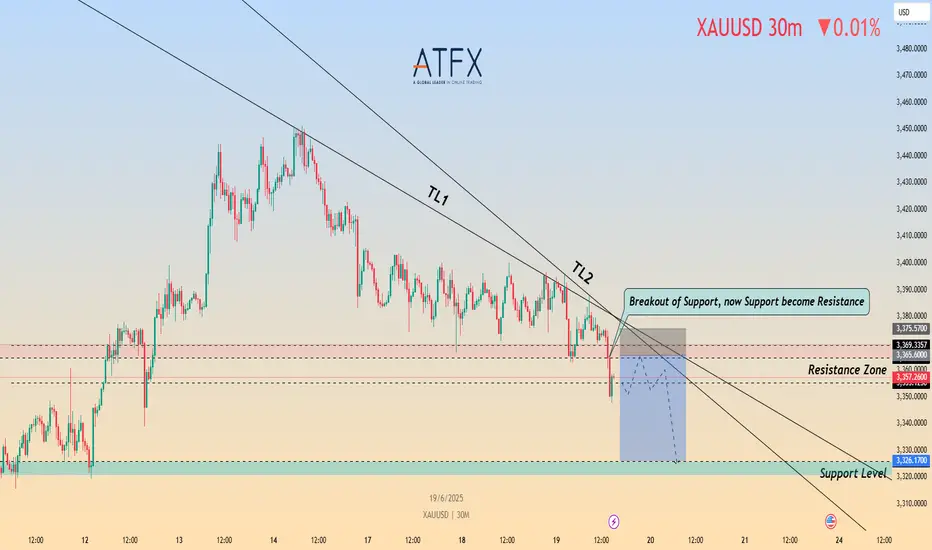
Gold Slips Below Key Support – Is $3,326 Next?OANDA:XAUUSD TVC:GOLD Gold has broken beneath the $3,365–$3,369 support zone, which now aligns with descending trendlines TL1 and TL2 acting as resistance. The 30-minute chart confirms a clean bearish breakout and retest, signalling potential continuation toward lower support near $3,326.
🎯 Short Setup
Entry: $3,365 (retest of broken support / trendline confluence)
Stop: $3,375 (above TL2 and intraday highs)
Target 1: $3,330
Target 2: $3,326
R:R: ~1:3.95
📊 Technical Context
• Price is capped below the $3,365–$3,369 supply zone
• Trendline resistance (TL1, TL2) remains intact from mid-June
• Structure favours continuation lower as long as price stays beneath the retest zone
🌐 Fundamental Backdrop
• Fed held rates steady, but Powell’s tone remained hawkish, warning of “elevated inflation” — supporting USD strength
• Rising Middle East tensions (Israel-Iran conflict) offer safe-haven bids, but not enough to break resistance
• Trump’s tariff threats and criticism of Fed policy add macro uncertainty — mildly supportive of gold in the longer run
📘 Trade Bias
As long as gold holds below $3,365, the bearish thesis remains intact. A sustained push above $3,375 would invalidate the setup and signal a potential reversal or breakout retest.
⚠️ Disclaimer
This analysis is for educational purposes only. Always do your own research and consult a licensed advisor before making financial decisions.
Gold Spot Price Analysis (4-Hour Chart)4-hour candlestick chart for the Gold Spot price in U.S. Dollars (XAUUSD). The chart shows a recent downward trend with a notable dip, followed by an upward correction. A technical analysis pattern is highlighted within a green rectangle, indicating a potential bullish reversal. The current price is $3,374.76, with a decrease of $13.40 (-0.40%). The chart provides insights into short-term price movements and potential trading opportunities.

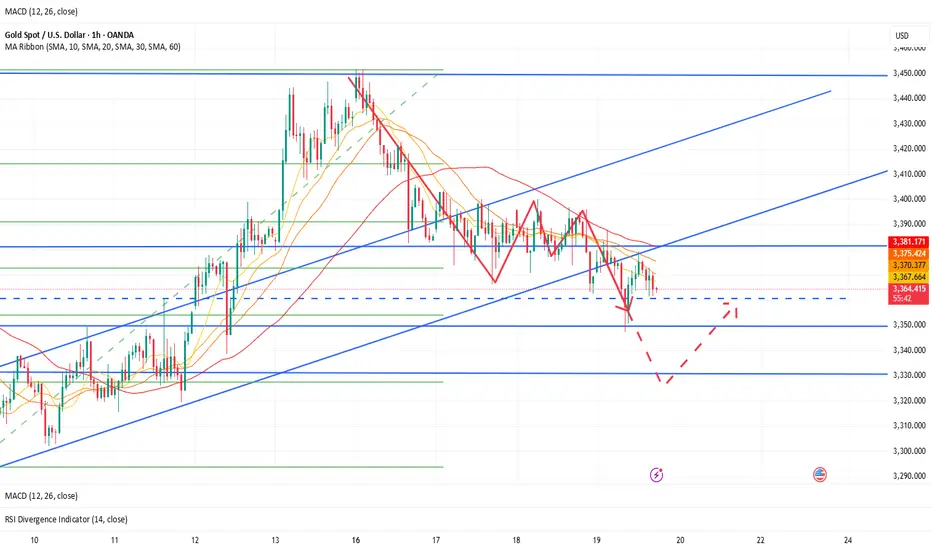
6/19 Gold Analysis and Trading SignalsGood morning!
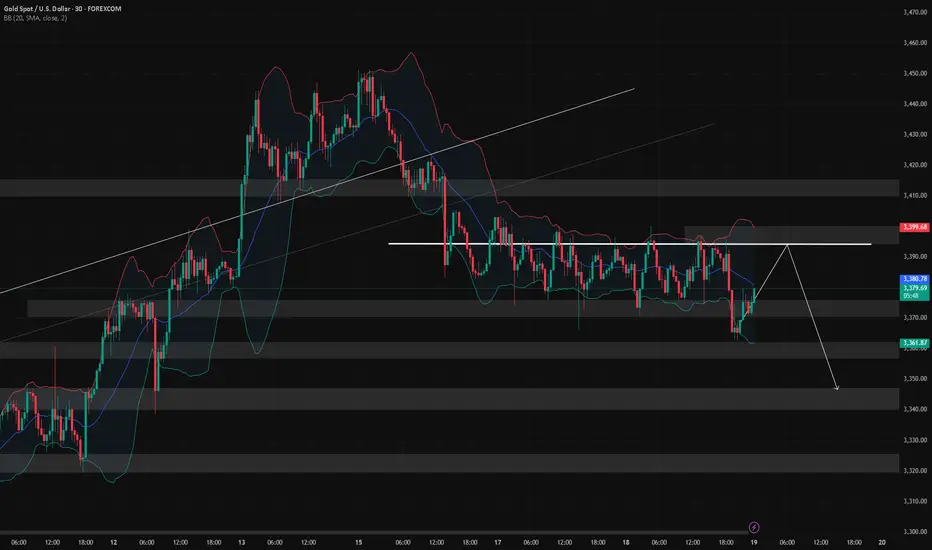
Yesterday, the Federal Reserve's interest rate decision aligned with market expectations, bringing no major surprises. The market had already priced in bearish sentiment in advance, which led gold to trade within the Bollinger Bands' upper, middle, and lower bounds, with all three bands trending sideways, indicating limited intraday volatility.
🔍 Technical Overview:
On the 30-minute chart, the Bollinger Bands began to tilt downward near the close, with price currently pressured by the middle band;
However, MACD structure suggests the middle band may be broken, with potential for price to challenge the upper band resistance near 3392–3400;
More importantly, on the 1D chart, the MACD is showing signs of a bearish crossover (death cross). If confirmed, it may break the bullish structure, weakening support from the weekly MA5;
If gold sustains below the weekly MA10 at 3317, it could open the door for a broader correction, with a drop toward 3200 becoming increasingly likely.
📊 Fundamental Factors:
Today’s U.S. market holiday means fewer economic data releases. As such, gold will likely be driven by technical structure and geopolitical headlines, especially those related to the Middle East. If no new developments emerge, selling on rallies remains the preferred strategy.
📌 Trading Plan (VIP-Focused):
✅ Sell Zone: 3392–3409
✅ Buy Zone: 3338–3321
✅ Scalp/Flexible Zones: 3387 / 3373 / 3364 / 3356 / 3345
Current Gold Trend Analysis and Trading RecommendationsOn Wednesday, the morning strategy suggested going long on gold at 3,375-3,365, perfectly seizing the pullback low and rebounding to the 3,400 level as expected. Today, there is also the Fed interest rate decision. Before the data release, short positions can be taken if the 3,400-3,405 level remains unbroken. If the 3,405-3,410 level is broken, we will continue to be bullish. Gold is in short-term oscillation, so try not to chase the market. Wait for a good entry opportunity. The upper level has also been repeatedly contested recently, and the Fed data is likely to break the range after its release.
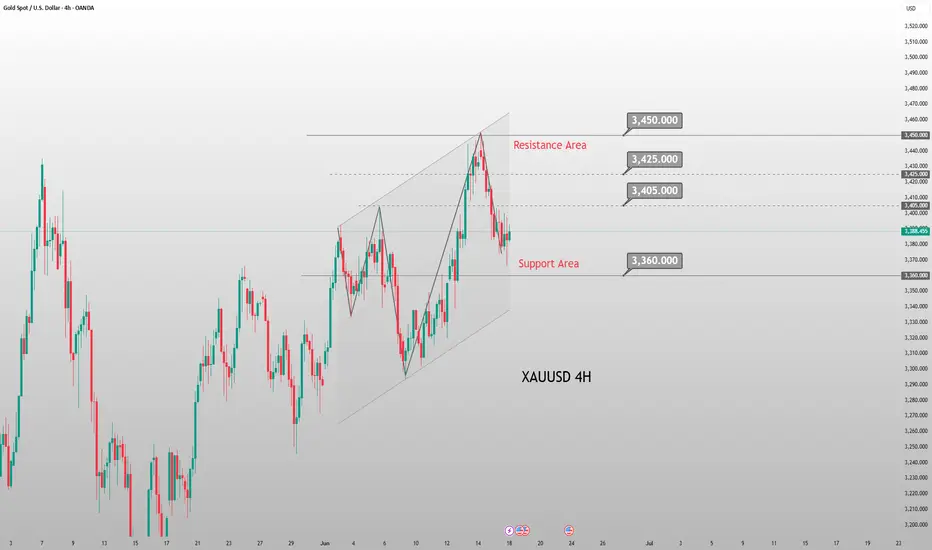
For gold, continue to adopt an oscillating approach. In the 4H cycle, it is operating below the middle band. The short-term range is 3,405-3,365. If it breaks above 3,405, it can continue to target 3,420 and 3,450. Conversely, if it breaks below 3,365, it can fall to 3,350. In operation, prioritize long positions with short positions as a supplement, and adjust the strategy when a breakout occurs.
XAUUSD
buy@3370-3375
tp:3390-3400-3420
sell@3395-3400
tp:3380-3370
Investment itself is not the source of risk; it is only when investment behavior escapes rational control that risks lie in wait. In the trading process, always bear in mind that restraining impulsiveness is the primary criterion for success. I share trading signals daily, and all signals have been accurate without error for a full month. Regardless of your past profits or losses, with my assistance, you have the hope to achieve a breakthrough in your investment.
Expect gold to break 3400 for 3430 post-FedIn recent years, after the U.S. economy was hit by a round of high inflation, inflation data has gradually shown signs of easing 📉. Logically, the weakening inflation pressure should have paved the way for the Federal Reserve (Fed) to cut interest rates, but surprisingly, the Fed has chosen to remain on the sidelines and maintain its high-interest-rate policy ⚖️. The Fed's decision to keep rates high has had a significant impact on gold prices and the U.S. dollar 💱. First, high interest rates typically push up the U.S. dollar exchange rate, thereby dampening gold demand 💰↓.
Gold's price movement this week deviated from market news or expectations 📉≠📢. Driven by geopolitical conflicts, gold rallied on Friday 📈, and the momentum continued to simmer over the weekend, leading to a gap-up opening on Monday followed by a steady decline 📉. On the hourly timeframe, the low points are gradually shifting downward, with 3,400 becoming a short-term resistance level 📊. Although gold fell from 3,452, it is clearly oscillating around 3,380 🔄
I think the Fed's interest rate decision this time may cause gold to directly break through 3400 and reach around 3430 🌟📈
⚡️⚡️⚡️ XAUUSD ⚡️⚡️⚡️
🚀 Buy@ 3380 - 3385
🚀 TP 3400 - 3430
Accurate signals are updated every day 📈 If you encounter any problems during trading, these signals can serve as your reliable guide 🧭 Feel free to refer to them! I sincerely hope they'll be of great help to you 🌟 👇

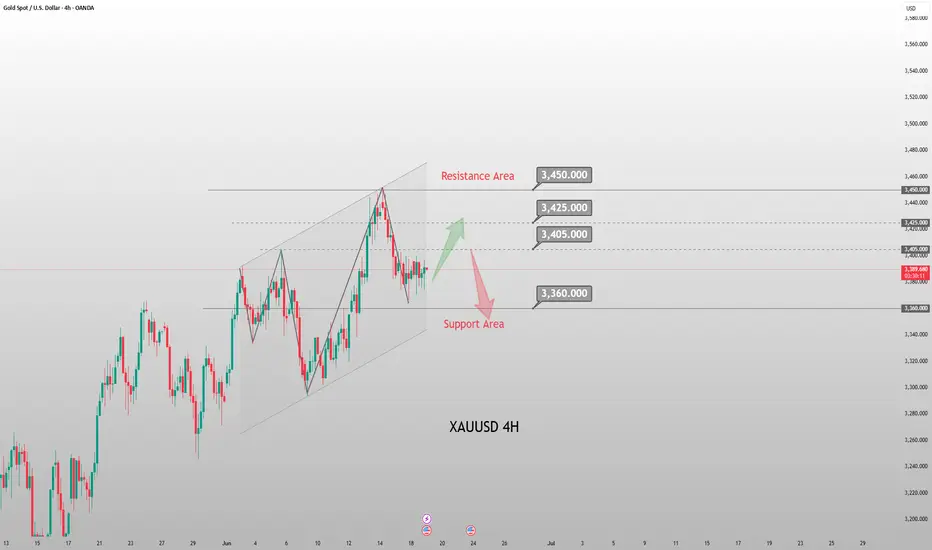
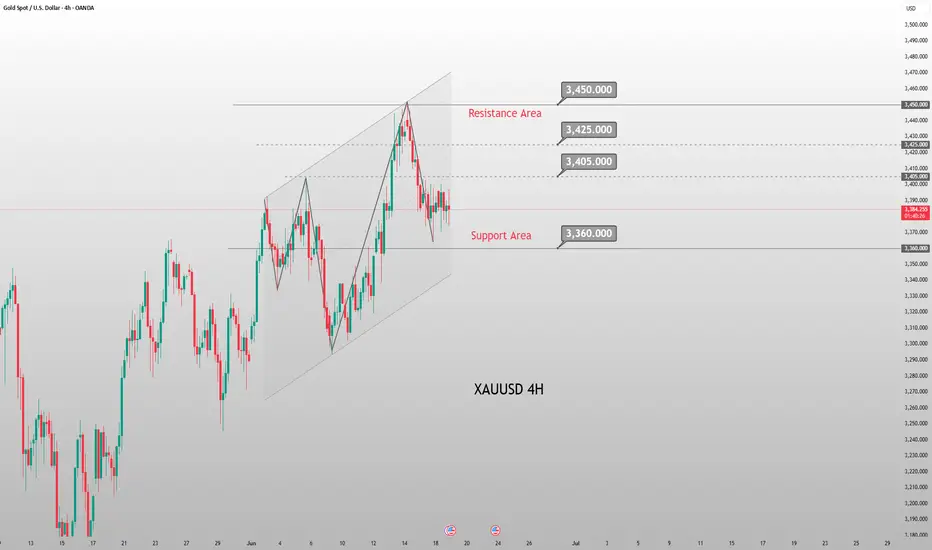
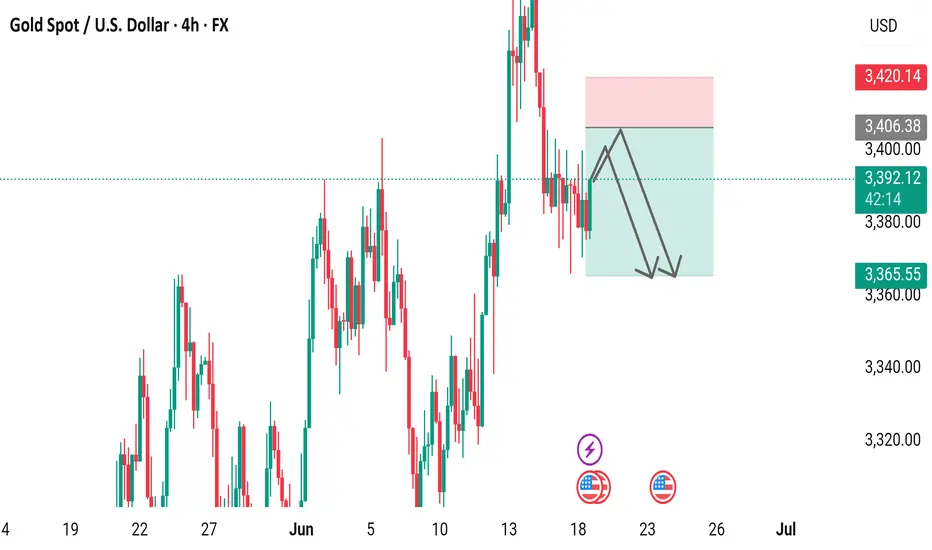
Gold Spot / U.S. Dollar (XAU/USD) 4-Hour Chart4-hour candlestick chart displays the price movement of Gold Spot (XAU) against the U.S. Dollar (USD) from June 4 to June 18, 2025. The current price is 3,391.79, reflecting a +3.61 (+0.11%) change. The chart highlights a recent upward trend with a notable peak, followed by a slight pullback. Key price levels are marked, ranging from 3,320.00 to 3,420.14, with technical analysis indicators such as a resistance zone (pink) and a support zone (light green) overlaid.
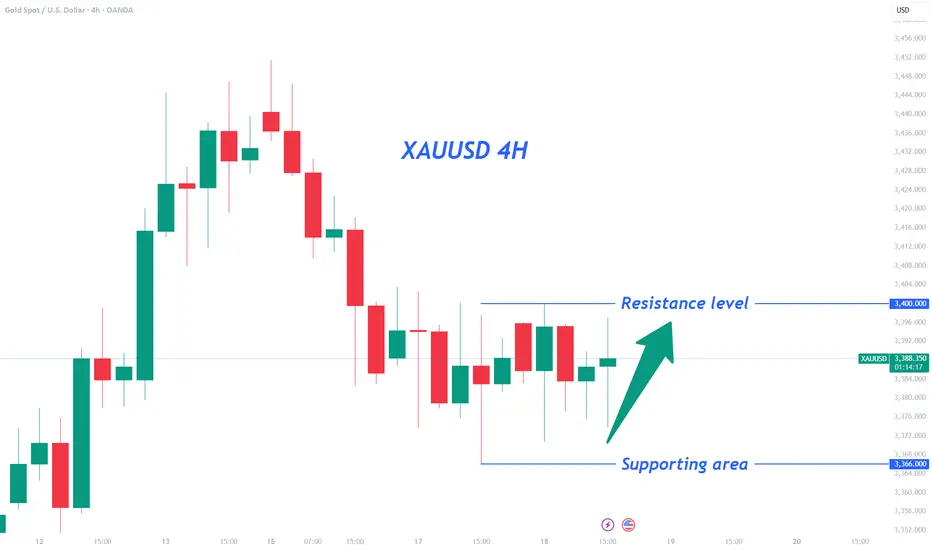
Buy Signal at 3363 Support, Sell Signal at 3400 ResistanceToday's key resistance level for gold remains at 3400.00 🚦, with the support area around 3363.00 🛡️. The current price of gold is 3388, placing it in the middle of the range between the support and resistance levels ⚖️.
We can wait for opportunities to go long when the price drops to around the support area of 3363.00 - 3370.00 📉, accompanied by bullish candlestick patterns (such as a hammer with a long lower shadow 🔦, a bullish engulfing pattern 🐂) or positive fundamental news (such as dovish remarks from the Federal Reserve 🕊️, escalation of geopolitical conflicts in the Middle East 🔥).
Conversely, we can consider going short when the price reaches the resistance zone of 3400.00 - 3405.00 📈, along with negative fundamental news (such as strong U.S. economic data 📊, easing of geopolitical risks 🧘).
Gold Trading Strategies
sell@ 3400-3405
tp:3375-3365
buy@3365-3370
tp:3390-3400
Professional trading strategies are pushed daily 📊
Lock in precise signals amid market fluctuations 🚀
Confused about market trends? Stuck in strategy bottlenecks?
Real-time strategies serve as your "trading compass" 🌐
From trend analysis to entry/exit points, dissect market logic comprehensively
Refer now 📲
Help you move steadily forward in investments ✨
👇👇👇
Current Gold Trend Analysis and Trading RecommendationsOn Tuesday, gold dipped to around $3,374 in the early trading session, then rebounded to the intraday high. In the U.S. trading session, it is currently quoted at about $3,388, approaching the psychological level of $3,400. From the 4-hour chart of gold, the current upward momentum remains intact. The support below is focused on around $3,350, and the strong support is highlighted in the $3,350-$3,330 area, which is also the position of the 5-week moving average. Only by breaking the $3,350 area is there hope to reverse the trend and fall completely. If it does not break here, the bulls may still repeat.
Regarding the current trend, gold tends to continue to test the bottom and then rebound, maintaining a large range of sweeping. In terms of operation, it is recommended to go long when gold rebounds to the vicinity of 3370-3360, with the target looking at the 3490-3400 range. The short strategy is to go short near 3400, with the target looking at the 3370-3350 line.
XAUUSD
buy@3370-3360
tp:3390-3400
sell@3395-3400
tp:3370-3350
Investment itself is not the source of risk; it is only when investment behavior escapes rational control that risks lie in wait. In the trading process, always bear in mind that restraining impulsiveness is the primary criterion for success. I share trading signals daily, and all signals have been accurate without error for a full month. Regardless of your past profits or losses, with my assistance, you have the hope to achieve a breakthrough in your investment.
The interest rate remains volatile,and the gold operation layout📰 Impact of news:
1. Initial jobless claims data
2. US-Iran conflict continues
3. Pay attention to the Fed's decision
📈 Market analysis:
Gold has been trading sideways recently. It is expected that there will not be much fluctuation before today's Fed interest rate information and Powell's speech. It is expected to continue to fluctuate in the range of 3405-3365. At the same time, the escalation of geopolitical conflicts in the short term is also a point we need to pay attention to.
🏅 Trading strategies:
BUY 3380-3375-3365-3355
TP 3395-3400-3405
SELL 3405-3395
TP 3380-3375-3360
If you agree with this view, or have a better idea, please leave a message in the comment area. I look forward to hearing different voices.
TVC:GOLD FXOPEN:XAUUSD FOREXCOM:XAUUSD FX:XAUUSD OANDA:XAUUSD

Wide range fluctuations continue, the latest layout of gold📰 Impact of news:
1. Initial jobless claims data
2. US-Iran conflict continues
3. Pay attention to the Fed's decision
📈 Market analysis:
At present, the gold price is testing the 3380 line again, and the strong support below is 3365-3355. As long as it does not fall below this key support, the bulls will remain strong. At the same time, the two key points of 3405 and 3420 above are still short-term resistance. Breaking through may directly test 3450. In the short term, gold fluctuates repeatedly at the 3405-3365 level, temporarily maintaining a high-altitude low-multiple cycle. There is also initial jobless claims data released today. At the same time, the geopolitical situation in the short term is severe, so we need to be cautious. In addition, the New York Stock Exchange will be closed tomorrow. The focus this week is mainly on Friday, especially when it is superimposed with the Fed's interest rate decision, we need to be vigilant about the transmission effect of sudden changes in liquidity on the market.
🏅 Trading strategies:
BUY 3380-3365-3355
TP 33395-3400-3405
SELL 3405-3390
TP 3380-3360
If you agree with this view, or have a better idea, please leave a message in the comment area. I look forward to hearing different voices.
OANDA:XAUUSD FX:XAUUSD FOREXCOM:XAUUSD FXOPEN:XAUUSD TVC:GOLD
