As predicted, gold continued to fall to the support zoneWorld gold price today
World gold price today increased slightly, with the spot gold price listed on Kitco around 3,317.85 USD/ounce, up 6.18 USD/ounce compared to early this morning. The last traded gold futures price was 3,338.2 USD/ounce, down 8.4 USD/ounce compared to early this morning.
World gold price experienced a volatile week when it continuously fluctuated within the range of 3,300 to 3,400 USD/ounce. But after all the fierce fluctuations, this precious metal returned to near the starting point at the end of the week, reflecting the indecision and waiting mentality of investors before the economic and geopolitical signals that have not yet been resolved.
Pay attention to the points I noted on the analysis.
Best regards, StarrOne !!!
Xauusdshort

I am waiting for SELL here with wave 5 catching strategy In the Kitco survey, Wall Street analysts were divided on the direction of gold prices this week. Fifty percent of experts expect prices to rise, 43 percent expect prices to fall, and 7 percent believe gold will move sideways. This reflects a generally cautious sentiment as there is no clear factor to promote a new trend.
Some experts still lean towards the uptrend as gold holds important support levels and remains a safe haven amid geopolitical uncertainty. Others predict a correction in gold prices due to positive signals from the White House about the possibility of reaching trade agreements and the recovery of US stocks.
In addition, there are also neutral opinions that gold is unlikely to continue to rise sharply without further momentum, especially when stock indexes are more attractive to investors.
James Stanley, senior strategist at Forex.com, remains optimistic, saying that gold is making a technical correction to continue the larger trend. He believes that the $3,300 and $3,280 zones will be important boundaries to watch.
What do you think about this strategy?
Best regards, StarrOne !!!

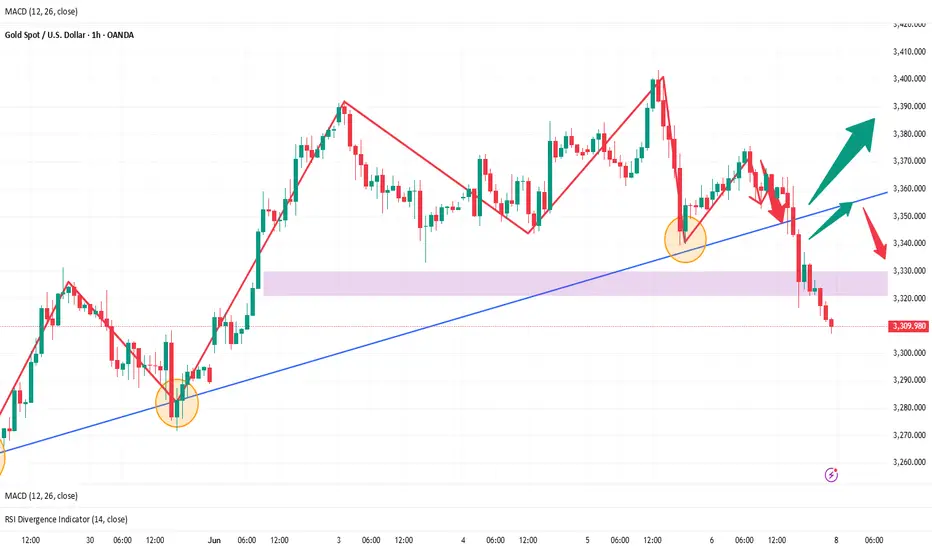
6/9 Gold Analysis and Trading SignalsLast Friday, gold experienced a sharp drop, briefly testing the 3300 level. From a technical standpoint, the market has started to show early signs of bottom formation, which could materialize either as a double bottom / multiple bottom pattern, or through a direct upside breakout.
If the former unfolds, we expect a stronger and more sustainable rebound.
If it turns into a straight bullish leg, traders should be cautious of potential exhaustion in the rally, which may invite a renewed bearish attack.
📊 Key Macro Focus This Week:
Markets will be primarily influenced by data releases on Wednesday through Friday, including:
Monthly CPI
Initial Jobless Claims
Inflation Expectations
As a result, Monday's trading will be dominated by technical patterns, with a bias toward a corrective rebound. The strategic focus should be on buying near support, with short-term opportunities to sell near key resistance.
📌 Monday Trading Plan:
✅ Buy in the 3303–3286 zone (early base-building area)
✅ Sell in the 3343–3353 zone (overhead resistance)
🔄 Intraday pivot levels for tactical entries:
3338 / 3326 / 3317 / 3309
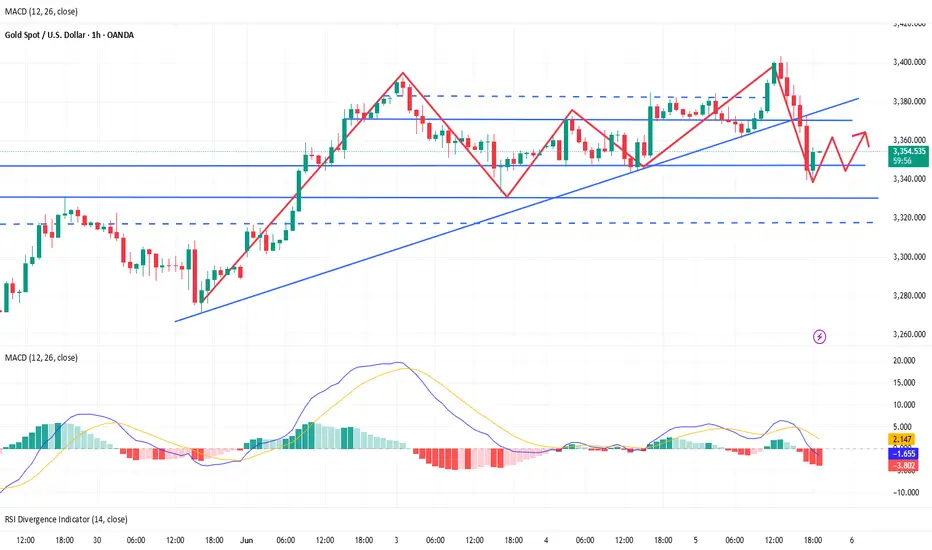
H1 frame analysis for next week gold plan after NFMGold is running wave 3, planning to go down to the near resistance zone then run wave 4 to the area just broken out, continue running wave 5 to decrease to complete the short-term decrease cycle
Everyone pay attention to the transaction, I have noted the price zones for everyone to refer to. Thank you traders for reading the article.
Follow me to see my analysis and comments on Gold !!!
Best regards, StarrOne !!!

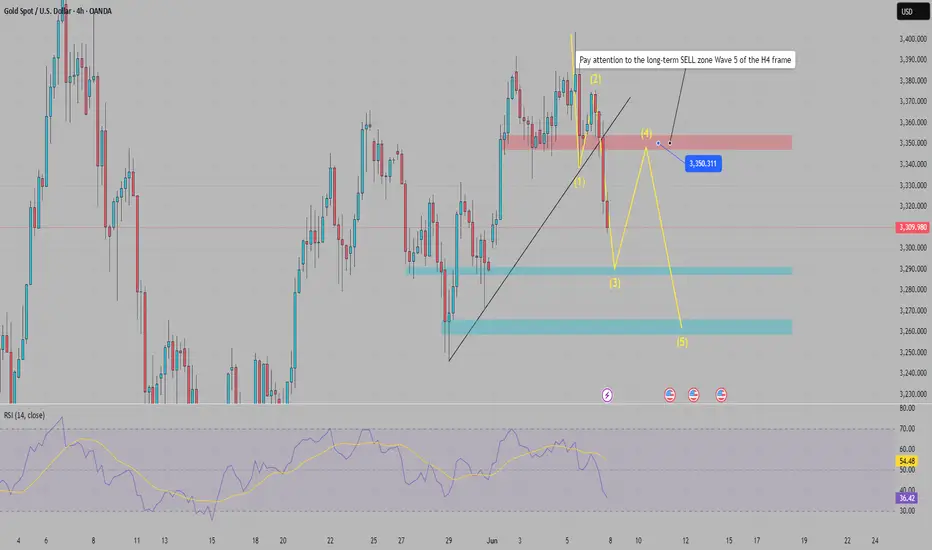
H4 swing order analysis for traders, Trade Swing H4 GoldH4 swing order analysis for traders, pay attention to wave 5 to confirm Long-term Sell
James Stanley, senior strategist at Forex.com, said: "I remain bullish on gold and will look for new support for the broader trend to continue.
Gold has made a new short-term high, with the price rising above $3,350/oz. Therefore, I do not rule out the possibility of this uptrend continuing and will look for new support, especially at $3,300/oz and $3,280/oz," he said.
Rich Checkan, Chairman and CEO of Asset Strategies International, said: "The current momentum favors gold and silver. While there may be some profit-taking, I expect gold to continue to rise next week thanks to the weakness of the US dollar, political tensions in the Middle East and Ukraine, the impact of tariffs and the passage of a major bill in the US that will increase public debt, leading to consumer inflation. These factors will continue to drive demand for gold as a safe-haven asset."
Adrian Day, Chairman of Adrian Day Asset Management, shared: "There are signs that North American investors are increasing their purchases of gold, although not a strong wave, but I believe this trend is gradually changing. This is a positive signal for the gold market in the future."
Best Regards StarrOne !!!
Gold Trading Strategy for Monday's OpeningGold's Price Movement on Friday (Non-Farm Payrolls Day)
During the day, gold traded in a range-bound pattern. After opening at around 3,354, it surged to a high of 3,375 but came under pressure and entered a (sideways-to-downward) trend. Despite the bearish Non-Farm Payrolls data released at night, gold did not immediately decline. Instead, it traded sideways for a period before rebounding to a high of 3,363, after which it started to drop. Gold closed the week with an inverted hammer candlestick pattern. From a technical perspective, the preferred strategy for next week is to fade rallies (sell on rebounds).
Key Levels for Next Week's Opening
Support: 3,288–3,295
Resistance: 3,338–3,345
Humans need to breathe, and perfect trading is like breathing—maintaining flexibility without needing to trade every market swing. The secret to profitable trading lies in implementing simple rules: repeating simple tasks consistently and enforcing them strictly over the long term.
Trading Strategy:
buy@3290-3295
TP:3320-3330

Accurately grasp the gold trend analysis next week📰 Impact of news:
1. The geopolitical situation is gradually deteriorating
2. Trump again calls on the Federal Reserve to cut interest rates
📈 Market analysis:
The current weekly moving average support for gold prices is roughly 3250-3260. If 3250-60 can be maintained, then gold may continue to maintain consolidation and wait for an opportunity to choose a trend. If it falls below 3250, then it can directly see the 3200 mark. If 3200 falls below again, then it will see 3100. In the short term, the first focus of the gold price below is 3315. As long as it stays above 3315, gold is still in a bullish trend. Secondly, pay attention to the 3280 line below. If it falls below 3280, the gold price will further test the support of 3260-3250. It is possible that gold will form a head and shoulders top structure on the daily chart next week. It may fall to 3250-60 at the beginning of the week to lure shorts into the market, and then stretch and rebound to around 3350 to form a shoulder position, and finally directly dive down to around 3150.
If you agree with this view, or have a better idea, please leave a message in the comment area. I look forward to hearing different voices.
OANDA:XAUUSD FX:XAUUSD FOREXCOM:XAUUSD FXOPEN:XAUUSD TVC:GOLD
Breaking the big frame, gold price returns to accumulation✍️ NOVA hello everyone, Let's comment on gold price next week from 06/09/2025 - 06/13/2025
🔥 World situation:
Gold prices declined for a second straight session on Friday, yet remain on track to close the week with a gain of over 1.30%, as traders recalibrate expectations for Federal Reserve policy easing following a stronger-than-expected U.S. Nonfarm Payrolls report. At the time of writing, XAU/USD is trading at $3,322, marking a 0.84% daily decline.
The U.S. Bureau of Labor Statistics (BLS) reported that the labor market continues to show resilience, with the unemployment rate holding steady from April. Meanwhile, Wall Street staged a modest rebound from Thursday’s losses, despite political tensions flaring between President Donald Trump and Tesla CEO Elon Musk, following the House's approval of a bill to raise the U.S. debt ceiling.
🔥 Identify:
Gold prices reacted lower after the release of good May employment data. Breaking the H4 uptrend line, gold prices continued to accumulate.
🔥 Technically:
Based on the resistance and support areas of the gold price according to the H4 frame, NOVA identifies the important key areas as follows:
Resistance: $3348, $3400
Support: $3251, $3202
🔥 NOTE:
Note: Nova wishes traders to manage their capital well
- take the number of lots that match your capital
- Takeprofit equal to 4-6% of capital account
- Stoplose equal to 2-3% of capital account
- The winner is the one who sticks with the market the longest
Geopolitical Undercurrents Support Gold as NFP LoomsTVC:GOLD OANDA:XAUUSD Gold hovers near $3,370 after failing to hold above $3,374, where previous support has turned into resistance. Price remains trapped between TL2 and TL3, with short-term direction hinging on tonight’s U.S. NFP data (130K jobs expected, 3.7% YoY wage growth). A strong report may trigger a drop toward the $3,342–$3,325 support zone, while weaker data could spark a bullish breakout toward $3,402.
Although Trump and Xi agreed to restart trade talks, deep fractures remain over export controls, Taiwan, and rare earth supply. These unresolved issues suggest geopolitical risk is far from over, offering medium-term support for CAPITALCOM:GOLD gold despite recent risk-on flows.
Resistance : 3,374 , 3,402
Support : 3,342 , 3,325

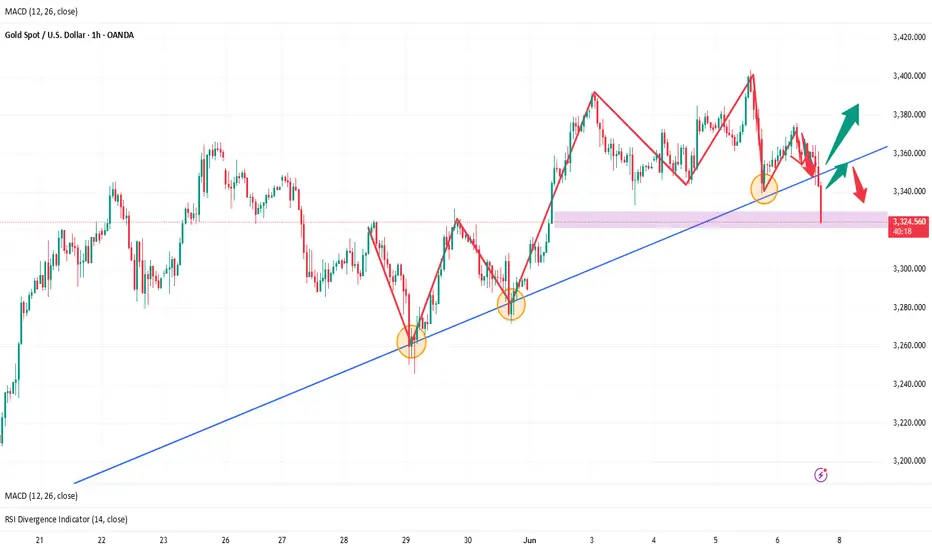
Gold Drop Fully Expected — Now It's Bulls?This recent decline in gold was well within our expectations. Since Monday, I’ve been highlighting the following:
The 3400 zone is a strong historical resistance, with heavy supply pressure;
A gap remains open at 3289, creating downside risk.
Today's drop is a deep flush of selling pressure near the 3400 zone.
Although the 3289 gap is still unfilled, this move may trigger dip-buying activity, giving bulls some room to work with.
📌 The first rebound resistance is likely near 3343, but because the gap is still a threat, most funds remain cautious. This could result in:
Weaker-than-expected rebounds;
Even possible bull traps followed by renewed downside.
✅ Long strategy reminders:
Keep position size moderate;
Set realistic targets;
Adjust your approach in line with market development.
Stay sharp, stay flexible — profits favor the prepared.

Analysis and layout of the latest gold trend in the evening📰 Impact of news:
1. The United States issues new sanctions on Iran
2. Trump continues to criticize the Federal Reserve
📈 Market analysis:
The 1H moving average of gold has shown signs of turning downward. If a death cross structure is formed subsequently, it will open up further downward space. From the market point of view, the price of gold rebounded to around 3364 after the release of non-agricultural data. This position constitutes a short-term key resistance level. If the rebound is under pressure here during the US trading session, short selling on rallies can still be considered. Although the price of gold has started to decline, it has not been able to fall below the important support of 3,300, so the long-term direction remains unchanged. At the same time, we need to pay attention to the effectiveness of the 3310 support line in the short term, and consider long trading only after the bottom is confirmed. For short-term trading, consider shorting at 3340-3350, and look to 3320-3310
🏅 Trading strategies:
SELL 3340-3350
TP 3320-3310
If you agree with this view, or have a better idea, please leave a message in the comment area. I look forward to hearing different voices.
TVC:GOLD FXOPEN:XAUUSD FOREXCOM:XAUUSD FX:XAUUSD OANDA:XAUUSD

Gold Is Likely to Break Below 3300 SoonYesterday, gold rallied up to near 3400 before pulling back, just as we had anticipated. We've repeatedly emphasized that 3400 is a strong resistance level, and those who followed through with short positions likely saw impressive profits.
Today, after a sharp drop, gold has rebounded again and is fluctuating near resistance. Support lies at 3352, and if that breaks, the next downside target is around 3333, followed by a possible move to fill the gap between 3300–3289.
🔍 Trading Logic:
There's still significant selling pressure above 3300, with the gap remaining unfilled.
Once the gap is filled, bulls may regain confidence to push higher — though they still face dense resistance above.
📌 Clear Profit Opportunities:
✅ Short toward the 3289 gap fill
✅ After the gap is filled, consider buying into the bullish rebound
The setup is clear — the key now is timing your entries and managing your positions wisely.
Long positions have made profits, focus on support📰 Impact of news:
1. The United States issues new sanctions on Iran
2. Trump continues to criticize the Federal Reserve
📈 Market analysis:
At present, the gold price has touched 3340. If it stabilizes here, we can arrange to go long. However, the gold price is constantly testing downwards, which is why I did not arrange to go long immediately. At the same time, we need to be vigilant about whether the gold price will fall below the important support of 3330. If it really falls below 3330, the gold price may test the support of the integer mark of 3300, which will also determine the future market trend.
🏅 Trading strategies:
SELL 3400-3370
TP 3340-3330-3300
BUY 3335-3330
TP 3350-3370
SELL 3325-3320
TP 3310-3300
If you agree with this view, or have a better idea, please leave a message in the comment area. I look forward to hearing different voices.
OANDA:XAUUSD FX:XAUUSD FOREXCOM:XAUUSD FXOPEN:XAUUSD TVC:GOLD
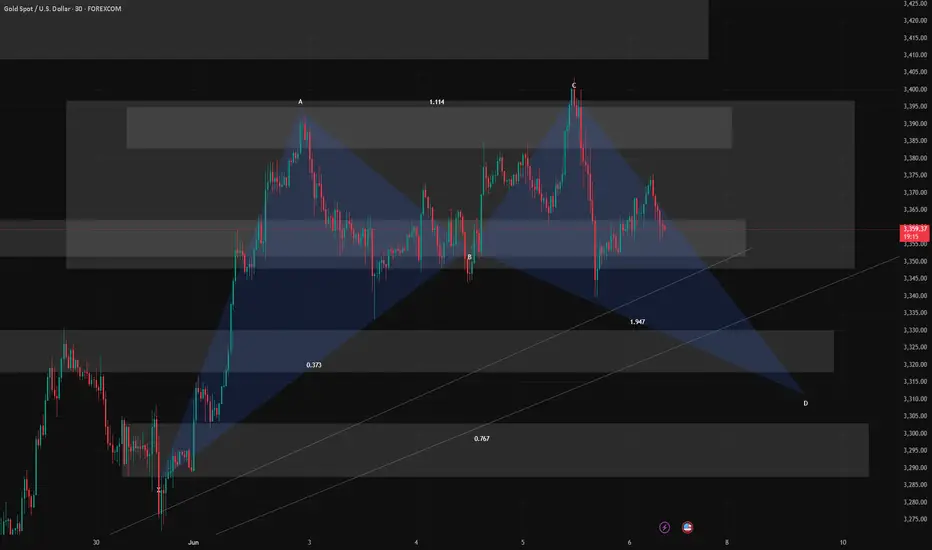
6/5 Gold Analysis and Trading SignalsGood morning, everyone!
Gold surged above 3380 yesterday but faced strong resistance, pulling back before testing the critical 3400 level. Despite multiple attempts, price failed to break through, highlighting a clear lack of bullish momentum near historical highs.
From a technical perspective, a potential M-top (double top) pattern is forming on the 30-minute chart. If confirmed, we can expect a deeper retracement, with an initial target around 3330, and possibly 3300 in case of further downside. Under this structure, today’s primary trading bias should favor short positions.
That said, if gold breaks above 3400 with strength, the 3416–3438 target zone becomes viable. However, any such breakout is likely to be followed by a pullback. In that scenario, we’ll closely monitor the 3392–3368 support range before executing follow-up trades.
📉 Technical Notes:
Price remains near a historical resistance zone, and buyers are showing hesitancy at these levels;
While yesterday’s Beige Book report provided short-term bullish sentiment, we need to observe whether the Asian and European sessions digest and extend that move.
🗞 Fundamental Outlook:
The key event today is the U.S. Initial Jobless Claims report, which may trigger volatility;
Gold remains supported by risk-aversion flows, but traders should be mindful of potential corrections at elevated levels.
💡 Risk Management Tip:
In such conditions, it is highly recommended to scale into positions with reduced lot size, and use tight risk controls to guard against unexpected reversals.
📌 Trading Recommendations for Today:
Sell near 3423–3436, targeting short-term pullbacks
Buy near 3312–3298, if deeper correction materializes
Pivot levels for tactical trades:
3416 / 3403 / 3392 / 3386 / 3367 / 3352 / 3343 / 3328
Strategy Summary:
Favor short setups on rallies unless 3400 is decisively broken. If support at 3362-3358 fails, expect the bearish trend to gain further momentum.

Gold Analysis June 6: Focus on Nonfarm Payrolls vGold, after rising around 3400, has been under strong downward pressure after US President Donald Trump and Chinese President Xi Jinping had a productive phone call. Today the market focuses on Nonfarm Payrolls
- Technically.
Gold has been under downward pressure from around 3400 and yesterday's decline was good, gold is currently trading below the 3400 zone. However, it has met support at the 3346 - 3340 zone.
Before today's NFP news, you can trade according to the above support zone to buy up, and sell at the psychological resistance zone of 3400.

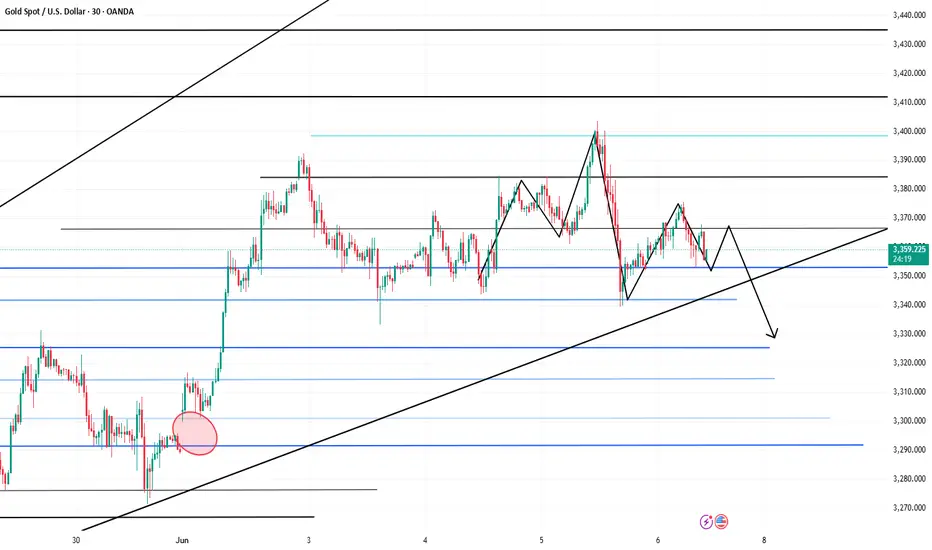
6/6 Gold Trading StrategyAfter a short rebound, gold is now hovering near key resistance levels.
The critical zone is around 3366 – if price breaks above this, the next upside targets are 3378–3388.
However, from a broader perspective, the 4H chart still shows an uncorrected bearish setup.
Without strong buying volume, the price may drop again — potentially below 3330, or even breach the 3300 level.
—
📅 Key Data Releases Today:
🔹 NFP (Non-Farm Payrolls)
🔹 US Unemployment Rate
Both events are expected to bring high volatility, so manage your risk carefully.
—
📊 My Intraday Trade Plan:
✅ Sell on rallies
🎯 Target: around 3330-3290
📌 Only if price reaches that support zone will I consider shifting to a bullish bias
Gold Overview Strategy June 6The 3-candle D1 cluster did not close above 50% of the main bullish candle on Friday last week. Today's main view will be to BUY to 3413.
Today's resistance is around 3413 for the SELL strategy of the US Session. The Asian-European session is looking for a BUY point. There was just a nice BUY wave around 3363 where the price swept liquidity to 3359.
3382 is the target for the BUY order and this area can SELL Scalp in today's Asian-European session for a recovery wave because today's target is up to 3413 according to the bullish structure.
In the direction of Gold Down, contrary to our analysis, the support zone 3341 and support 3324 will support the upward force of gold prices.
The breakout boundary zone 3382 and 3341. Pay attention to breaking out from important resistances, then do not trade against the trend.
Resistance: 3373-3382-3399-3413
Support: 3357-3341- 3325

Long and short battle break out before NFP,gold operation layout📰 Impact of news:
1. NFP data released
2. Geopolitical situation worsens
3. Trump and Musk start a war of words
📈 Market analysis:
During today's U.S. trading session, we need to pay close attention to the impact of NFP on the market. Bros who trade independently must do a good job of risk control. The gold 1H chart shows that the current gold price is suppressed by the downward opening of the Bollinger Bands. Gold shorts dominate in the short term, and the MACD indicator has a tendency to form a death cross. At the same time, the 5-day moving average and the 10-day moving average form a death cross and move downward, indicating that the gold price is still facing adjustment pressure in the short term. Looking at the 4H chart, we can find that although gold is currently rising on the 4H trend line, gold has not yet fallen back to the right level. Therefore, we cannot rule out the possibility that gold will continue to fall back in the future. The key resistance level above is 3390-3400, and the support level below is 3350-3340, with a focus on the important support level of 3330. Participate in high-altitude and low-multiple in the European session today, and consider retreating to 3350-3340 to place longs
🏅 Trading strategies:
BUY 3350-3340
TP 3365-3385-3395
If you agree with this view, or have a better idea, please leave a message in the comment area. I look forward to hearing different voices.
TVC:GOLD FXOPEN:XAUUSD FOREXCOM:XAUUSD FX:XAUUSD OANDA:XAUUSD

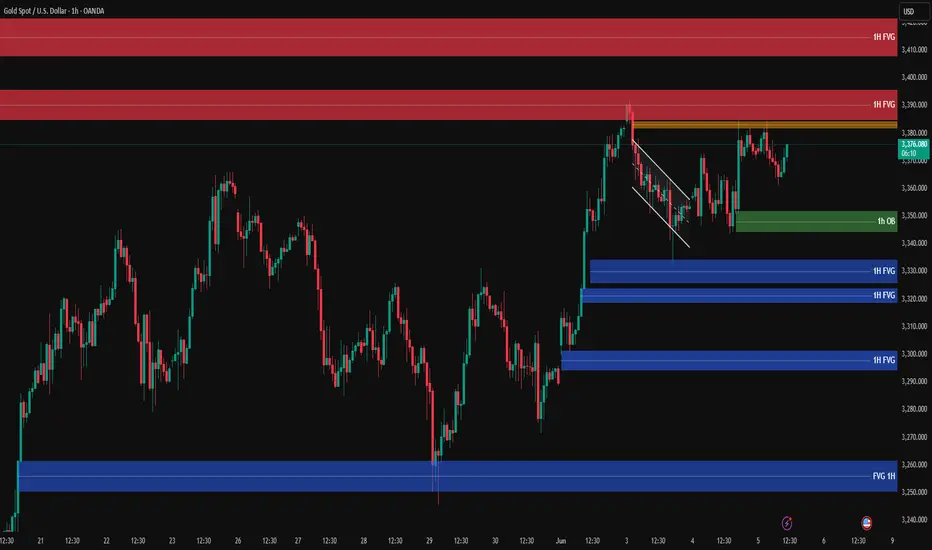
Gold Analysis – Likely Scenario📍 Gold is currently trading around 3375 USD and gaining bullish momentum with the London session opening.
🔸 Key Zones:
🟨 Critical Resistance (Orange Zone):
📍 3378 – 3384✅ Price consolidation zone – if broken with strong volume, a bullish continuation is likely.
🔴 Supply Zones (FVG):
1️⃣ Upper FVG 1H:📍 3386 – 3397
2️⃣ Main Supply Zone FVG 1H:📍 3405 – 3422
🟢 Demand Zone (1H OB):
📍 3345 – 3350✅ Strong buy zone after the breakout of falling wedge structure.
🔵 Lower Demand FVGs:
3330 – 3335
3315 – 3325
3290 – 3300
3260 – 3270
✳️ Likely Scenario:
If the orange resistance zone breaks, price is likely to rally toward the 3386 – 3397 FVG, and potentially 3405 – 3422.
If price gets rejected, watch for reactions at the 3345 – 3350 OB for potential long entries.
🔍 Insight by ProfitaminFX
If this outlook aligns with your bias, or if you see it differently, feel free to share your perspective in the comments. Let’s grow together 📈
Gold Price Analysis June 63 D1 candles closed without breaking through 50% of the previous bullish main candle. Today's main view will be BUY up to 34xx
Today's resistance is around 3413 for the SELL strategy of the US Session. The Asian and European Session is looking for a BUY point. There was just a nice BUY beat around 3363 where the price swept liquidity to 3369.
3382 is the target for the BUY order and this area can SELL Scalp in today's Asian and European session because today's target is up to 3413.
In the direction of Gold Down, contrary to the analysis, the support zone 3341 and support 3324 will support the upward force of gold prices.
Breakout boundary zone 3382 and 3341. Note that the break out does not block the train
Non-farm data is expected to help gold recover from its decline! Gold prices rose sharply in the Asian and European sessions yesterday, and fell in the US session. The roller coaster-like trend at the end of the day gave up all the gains during the day, falling below the 3350 mark and touching the 3339 line. The daily pattern showed a trend of first rising sharply and then falling sharply. The technical daily chart has been alternating between positive and negative for four consecutive trading days. The New York market fell sharply and tested the 7-day moving average, but the price is still running above the 10-day moving average/7-day moving average.
The Bollinger Bands on the short-term four-hour chart closed, the RSI indicator's middle axis flattened, and the hourly chart's four-hour moving average was glued. From a technical perspective, gold intraday trading is arranged with a volatile mindset, and the intraday range is arranged with reference to 3328/3388. Today's fundamentals focus on the non-agricultural employment data released by the New York market. The previous value was 177,000, and the market estimate was only 130,000. According to the estimate, it is bullish for gold/silver.
This year has always emphasized that 2025 is a strong year for gold, and gold may enter an acceleration period of long-term structure this year. Tariff trade policies, geopolitical tensions, the Federal Reserve's interest rate decision, the decline in confidence in U.S. debt, and the increase in global central bank purchases have all affected the trend of gold as a strong safe-haven tool, and gold will have room to rise. Therefore, as long as the overall environment remains unchanged, gold is still an absolute bullish trend. Therefore, no matter how it is adjusted, now is an opportunity to enter the long position.
Gold fluctuated in the 3332-3392 range in the first three days of this week. During this period, our high-altitude and low-multiple layout was completed as expected. Then, today gold will remain in this range and fluctuate upward. If it rises above 3400 and stabilizes, it will look to 3500 above; if it breaks through 3330, it will look to 3280 below. Pay attention to the fluctuations before the release of non-agricultural data. Non-agricultural data will cause an increase in liquidity, so try to avoid it.
Key points:
First support level: 3342, second support level: 3328, third support level: 3303
First resistance level: 3376, second resistance level: 3388, third resistance level: 3410
Operation ideas:
Buy: 3340-3343, stop loss: 3332, target price: 3360-3370;
Sell: 3387-3390, stop loss: 3400, target: 3370-3360;

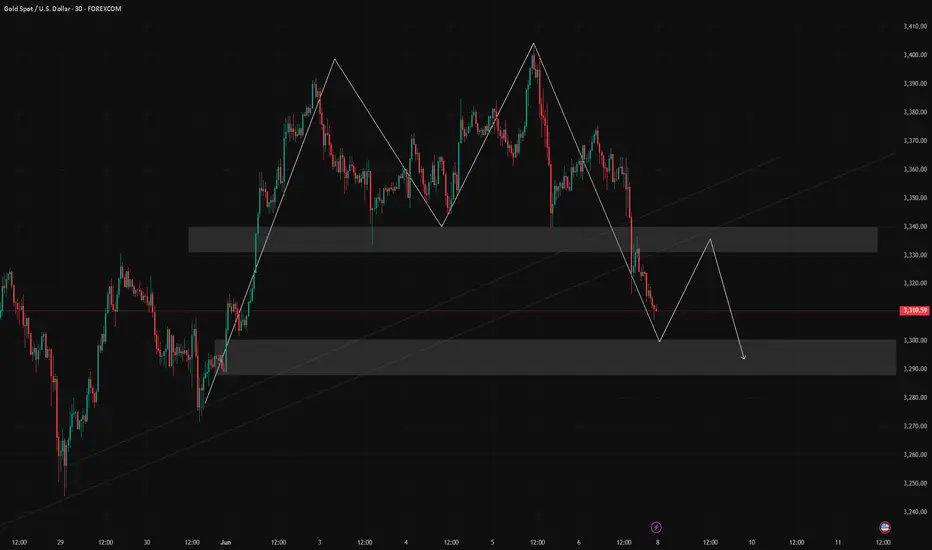
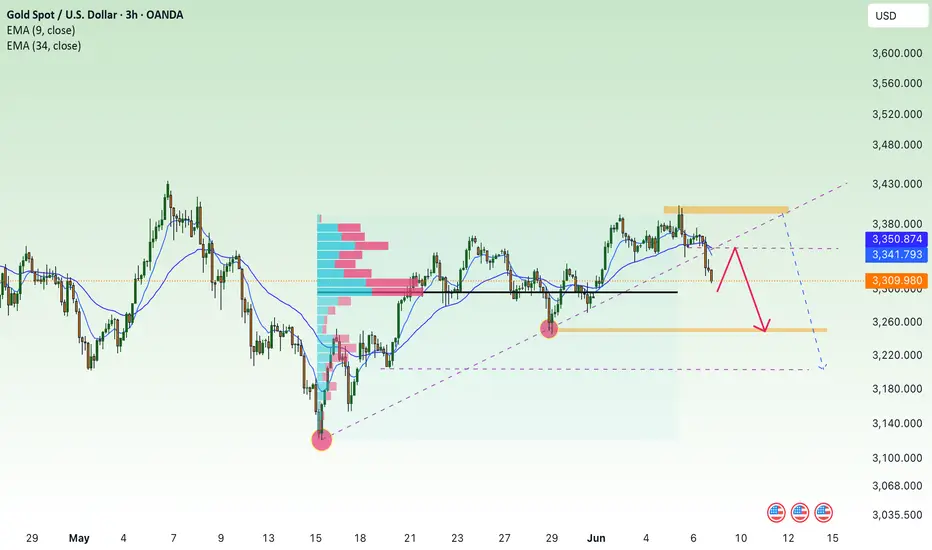
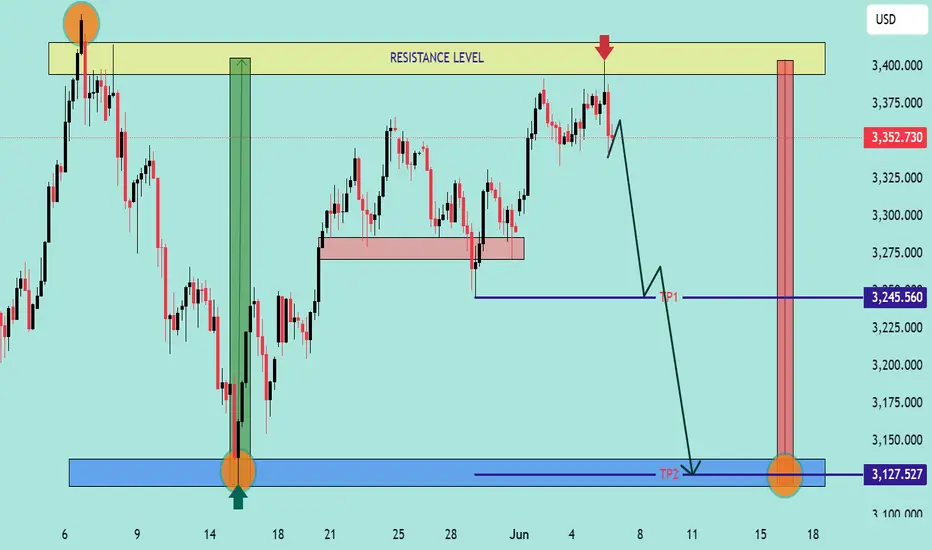
XAUUSD – Bearish Outlook from Resistance Zone📊 XAUUSD – Bearish Outlook from Resistance Zone
🕒 Date: June 5, 2025
💰 Instrument: Gold (XAUUSD)
📍 Current Price: 3,352.730 USD
🟨 Key Resistance Level
🔴 Price has sharply reacted from the 3,375–3,400 USD zone, highlighted as a strong resistance area.
📉 This zone has previously triggered significant sell-offs, confirmed again by the current bearish rejection (red arrow 🔻).
📉 Bearish Market Structure
The price structure suggests a classic lower high rejection scenario with potential for further downside:
🔻 Immediate Drop Expected
After rejection from resistance, the price shows early signs of breakdown. A minor pullback is expected before continuation.
🧭 TP1 – First Target Zone:
📍 3,245.560 USD
This level aligns with a previous demand area (light red box), likely to act as temporary support or reaction point.
🎯 TP2 – Final Bearish Target:
📍 3,127.527 USD
This blue demand zone is a major support level, previously a strong rally base (green arrow 🟢). Expect buyers to step in here again.
🔄 Trade Idea Summary
💼 Setup Type: Resistance Rejection
🛑 Bias: Bearish
📍 Entry Zone: ~3,350–3,360 USD (confirmed rejection)
🎯 Take Profit 1: 3,245.560 USD
🎯 Take Profit 2: 3,127.527 USD
🔒 Stop Loss: Above 3,400 USD (outside resistance zone)
📌 Observations:
🔁 The market repeated its previous pattern: bouncing from the blue demand zone and rejecting at the yellow resistance zone.
🧱 A solid breakdown below TP1 could accelerate movement toward TP2.
🔍 Watch for any bullish reaction around TP2 for potential reversal setups.
📉 Bias: Bearish
📆 Outlook: Short-term to mid-term swing
Is there still hope for the bull market to rise today?📰 Impact of news:
1. Progress made in talks between China and the USA
📈 Market analysis:
In view of the non-agricultural data to be released on Friday, the market is expected to maintain a volatile consolidation trend before then. From the daily level: the Bollinger Bands open gently, the gold price is running below the upper track 3414, and the MACD golden cross is running slowly, suggesting that the bullish momentum is weak. At the hourly level, the short-term short position is strong, and there is a certain rebound demand. Therefore, we pay attention to the 3343-3333 support line below, focusing on the 3300 support. After the gold price falls below the 3360 support, the 3360 position will suppress the gold price in the short term.
🏅 Trading strategies:
BUY 3343-3333
TP 3360-3370-3380
SELL 3360-3370
TP 3330-3320
If you agree with this view, or have a better idea, please leave a message in the comment area. I look forward to hearing different voices.
OANDA:XAUUSD FX:XAUUSD FOREXCOM:XAUUSD FXOPEN:XAUUSD TVC:GOLD