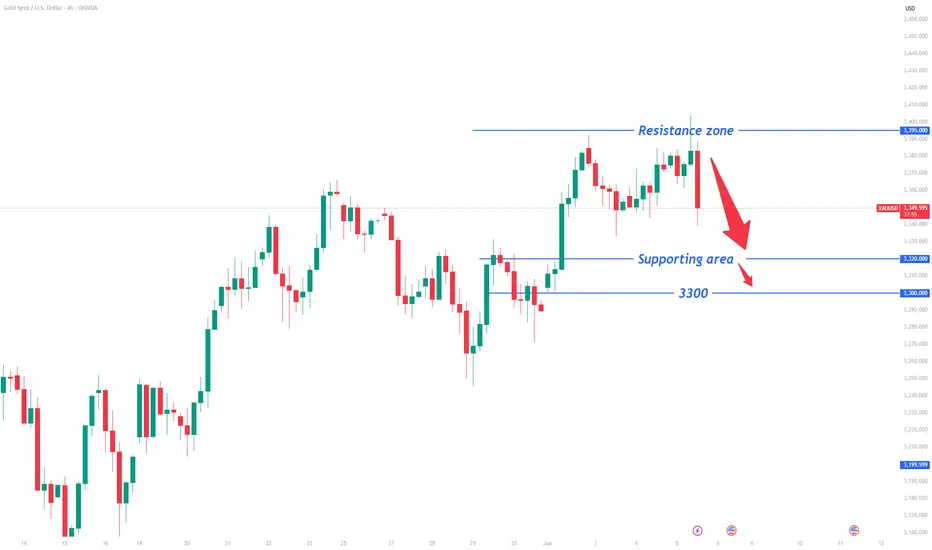
US-China Talk Drops Gold Short; Short StrategyToday, Trump announced that China and the U.S. participated in a telephone exchange 🔊! After the market learned this, optimistic sentiment surged rapidly, causing U.S. stock futures to rise sharply in the short term 📈. As a result, spot gold turned lower in the short term ↓. The current situation favors short positions:
Short at current price 📉: Initiate a small short position near 3350 👌, set a unified stop loss above 3360 ⚠️, and target key support levels at 3325-3320 🎯.
Add to shorts on rebound ↕️: If the price rebounds to the 3350-3360 range, increase the short position 📊, maintaining the same target 🎯.
Chase shorts on breakdown 💥: If the price breaks below 3320 support, chase the short trend with a stop loss at 3330 ⚠️, targeting the psychological level of 3300 🧠.
Risk reminder ⚠️: Monitor U.S. stock futures and follow-up developments in U.S.-China relations closely 👀, and be wary of volatility caused by a reversal in market sentiment 🚦. Keep position sizes within 10% ⚖️ and strictly adhere to stop losses ⛔.
Gold Trading Strategies
sell@3350-3355
tp:3325-3320
sell@3315-3320
tp:3305-3300
Professional trading strategies are pushed daily 📊
Lock in precise signals amid market fluctuations 🚀
Confused about market trends? Stuck in strategy bottlenecks?
Real-time strategies serve as your "trading compass" 🌐
From trend analysis to entry/exit points, dissect market logic comprehensively
Refer now 📲
Help you move steadily forward in investments ✨
👇👇👇
Xauusdshort
The long strategy has been successful, pullback and go long📰 Impact of news:
1. European Central Bank deposit facility rate in the eurozone as of June 5
2. Initial jobless claims data
3. Non-farm payroll data
4. Worsening geopolitical situation
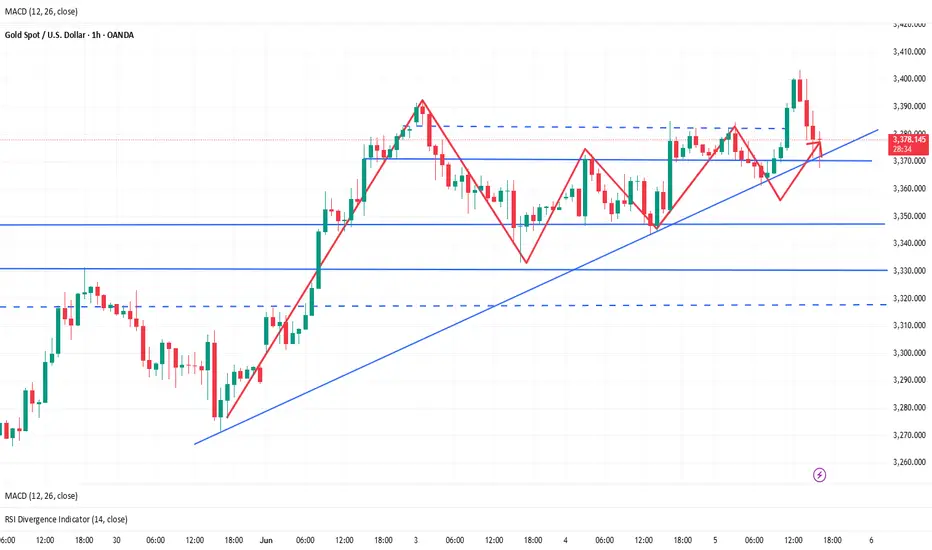
📈 Market analysis:
At present, the gold price has broken through the previous highs of 3392 and 3395. There is no obvious peak signal in the short term. At the same time, as the gold price continues to rise, the lower support will also move up in the short term, and the 4HMACD has a golden cross trend. In the short term, pay attention to the 3385 support below and the 3410 resistance above. The 1H indicator is close to the overbought area. We still need to be vigilant about the risk of rising and falling. If the gold price retreats to 3390-3385, we can consider going long with a light position.
🏅 Trading strategies:
BUY 3390-3385-3375
TP 3400-3410
If you agree with this view, or have a better idea, please leave a message in the comment area. I look forward to hearing different voices.
OANDA:XAUUSD FX:XAUUSD FOREXCOM:XAUUSD FXOPEN:XAUUSD TVC:GOLD

Is there still a chance for a bull market in gold's decline?📰 Impact of news:
1. European Central Bank deposit facility rate in the eurozone as of June 5
2. Initial jobless claims data
3. Non-farm payroll data
4. Worsening geopolitical situation
5. Watch the impact of the dialogue between Trump and Xi Jinping on gold
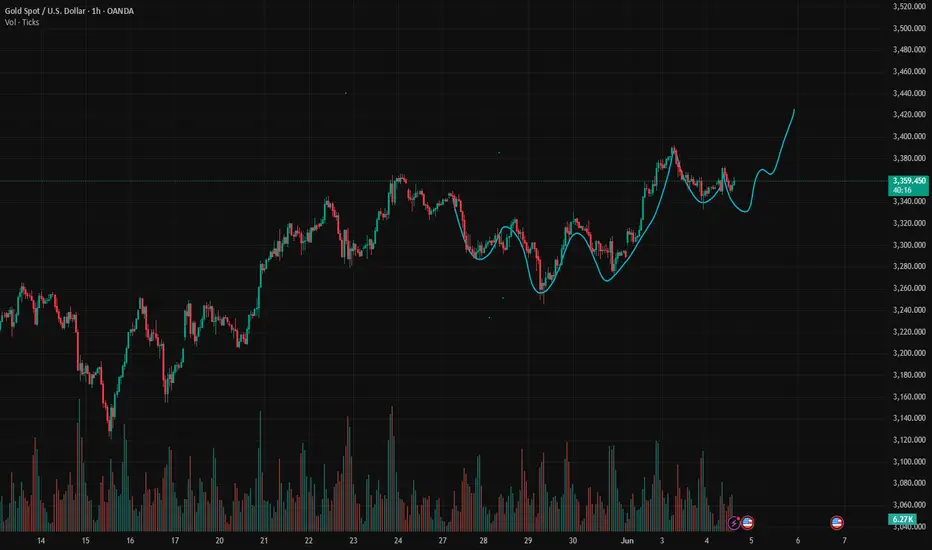
📈 Market analysis:
This round of geopolitical conflict caused an upward breakthrough, but the price has cooled down due to the negotiations between China and the United States. The current market is swaying at 3374. In fact, gold has not yet taken a more obvious direction. After all, tomorrow, Friday, is a key node in the data market game. At the 4H level, today's European session has reached the 3404 line, and encountered resistance and pressure here. The current retracement is in line with our expectations, and we expect to go long. As long as the key position of the middle track is maintained, it will continue to rise after being pulled down. At present, I still hold long orders.
🏅 Trading strategies:
BUY 3390-3385-3375
TP 3400-3410
If you agree with this view, or have a better idea, please leave a message in the comment area. I look forward to hearing different voices.
TVC:GOLD FXOPEN:XAUUSD FOREXCOM:XAUUSD FX:XAUUSD OANDA:XAUUSD
Gold Liquidity run Short Setup Update This video is an update on the Gold setup that was posted on the 4/06/25
I cover the price action and discuss what I think will be occurring from this point onwards as
part of the original trading plan .

Trading strategy in US sessionGold price in the short term of the US session. The pulling of the h1 candle's wick creates an important liquidity zone of 3373. When h1 closes above this zone, it confirms that the US session will be a bullish session and can reach 3398 at the end of the session. If it closes below 3373, the BUY zone will be noticed at the support reaction in the European session around 3362.

XAUUSDThe trend of XAUUSD is fluctuating.
Wednesday: XAUUSD in the Asian market rose sharply to 3372 and then quickly dropped to 3348. The current quotation is 3360.
It is a good trading opportunity for traders who bought low yesterday. The lowest yesterday fell to 3333. The operating space fluctuates by about $40/ounce. Many people have no idea. The profit of trading 1 lot of buy orders is 4. The profit of trading 5 lots is 20k.
This week is the monthly data news week. Including ADP. ECB interest rate decision, big non-agricultural data that have a significant impact on the economy.
Trend observation. There is still an intention to continue to rise. In terms of operation, you can focus on buying at low levels.
Pressure range: 3400-3390
Support range: 3340-3350
Under the influence of news. Many trends will be distorted due to the influence of data news. So I have been reminding you not to trade alone. If you want to follow good swing trading instructions to make reasonable trades and expand your profits, please leave us a message.
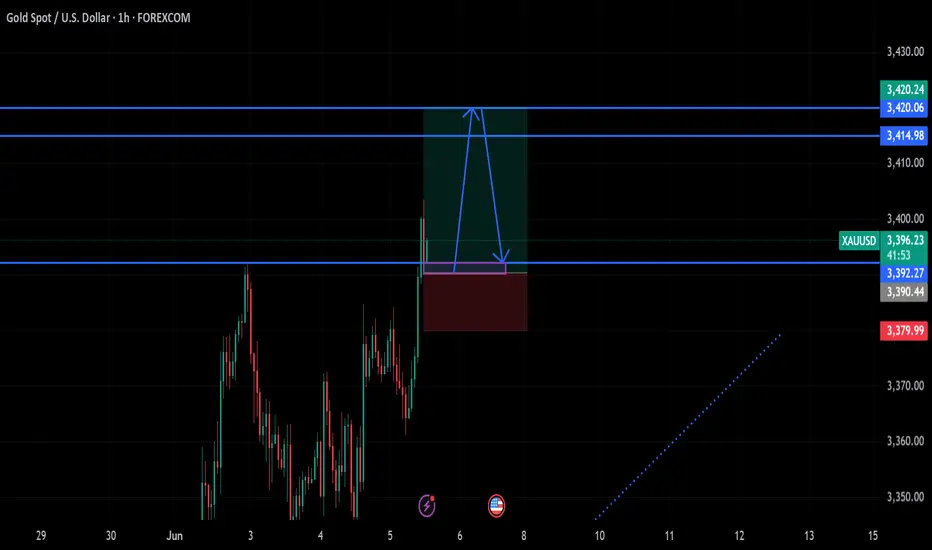
gold on bullish#XAUUSD price have breakout the 3403, now we expect new formation before any possible move. Between 3390-3392 shows rejection on sell.
Buy on multiple breakout Between 3390-3392, TP 3415-3420, SL 3380.
If possible the next H1 drops and close below 3380 then bearish retracment will occur till 3370-3355.
Gold:Go short before you go long
Gold is currently volatile upward trend, here can not avoid repeated retracement. Now the performance is relatively strong break 3884 short - term high, then the United States is expected to attack twice, then can participate in the long again. Note: long is the main, short is the auxiliary
You can go short now, and then go long. Below is support around the 3365-70 zone
Trading Strategy:
SELL@3385-90
TP:3370-65
BUY@3365-70
TP:3390-3400
↓↓↓ More detailed strategies and trading will be notified here ↗↗↗
↓↓↓ Keep updated, come to "get" ↗↗↗

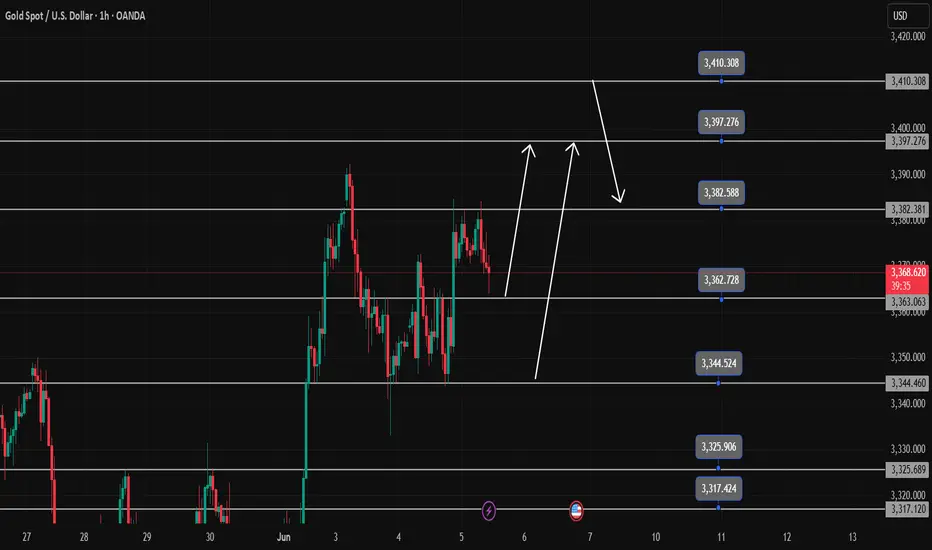
Gold Trading Strategy Overview June 5There is not much surprise with the D candlestick having increased again. The increase can completely reach 3408 today.
The H1 wave structure also shows that the trend is increasing strongly and heading towards above 3400. 3363 is considered the first BUY support zone in the Asian and European sessions today.
3344 is the most important boundary zone of the trend, breaking this zone will cause the uptrend to break to 3400 in the short term and must wait for new uptrend waves.
In the opposite direction, 3382 is the resistance zone of the Asian and European sessions today and is also the breakout zone, this zone will reach above 3400 but before that there will be a reaction around 3397, which is a very likely flash break zone of the previous peak.
Resistance: 3382-3397-3410
Support: 3363-3344-3325-3317
Pay attention to trading at support and resistance zones when there is confirmation
Bull market returns? Aiming at 3400?📰 Impact of news:
1. New uncertainty in Russia-Ukraine negotiations
📈 Market analysis:
The current trend of gold prices is erratic and discontinuous, and only swing trading can be adopted during the day. In the short term, there is a certain pressure at 3385-3395 above. If this resistance area is broken, the gold price is expected to continue to rise. The short-term support below FOREXCOM:XAUUSD is at 3350-3340. At present, the news has a greater impact on the gold price, coupled with the support of market risk aversion, so in the short term, attention should be paid to the break of the upper resistance.
🏅 Trading strategies:
BUY 3370-3365
TP 3385-3395-3400
SELL 3395-3400
TP 3380-3370
BUY 3350-3340
TP 3370-3380
If you agree with this view, or have a better idea, please leave a message in the comment area. I look forward to hearing different voices.
OANDA:XAUUSD FX:XAUUSD FXOPEN:XAUUSD TVC:GOLD
I still have a short position.Although gold has risen sharply to above 3380 due to the intensification of the Russian-Ukrainian conflict, it has not made a substantial breakthrough, and has not stabilized above 3380. The bulls are not determined, which also shows that the technical suppression in the 3290-3295 area above is still strong. If gold does not break through in one fell swoop, gold is likely to usher in a wave of retracement in the short term.
Due to the fundamental impact of tariff issues and geopolitical conflicts, for short-term trading, we should not have too high expectations for the extent of the retracement for the time being, but it is expected to retrace to the 3365-3355 area. In terms of short-term trading, I still hold a short position executed near 3375, and I hope that gold can fall back and hit TP as expected.
Trading strategy:
Consider shorting gold in the 3375-3385 area, TP: 3365-3355

Gold price fluctuates before NFP data, be careful📰 Impact of news:
1. European Central Bank deposit facility rate in the eurozone as of June 5
2. Initial jobless claims data
3. Non-farm payroll data
4. Worsening geopolitical situation
📈 Market analysis:
Since the release of ADP data last night, gold prices have been rising all the way, reaching a high of around 3382, which is in line with the expected resistance of 3385-3395 we saw yesterday. Currently, the bulls are stable above 3330, and the gold price is still in a bullish trend on the daily chart. Although the current market is in a state of consolidation, there is a possibility of a surge and fall in the short term. Only after a negative line correction occurs, it may continue to be bullish. In short-term trading, pay attention to 3385-3395 on the top and the opportunity to retreat to 3365-3355 on the bottom. Pay attention to data such as initial jobless claims and tomorrow's non-agricultural data.
🏅 Trading strategies:
BUY 3365-3355-3345
TP 3370-3380-3400
If you agree with this view, or have a better idea, please leave a message in the comment area. I look forward to hearing different voices.
TVC:GOLD FXOPEN:XAUUSD FOREXCOM:XAUUSD FX:XAUUSD OANDA:XAUUSD

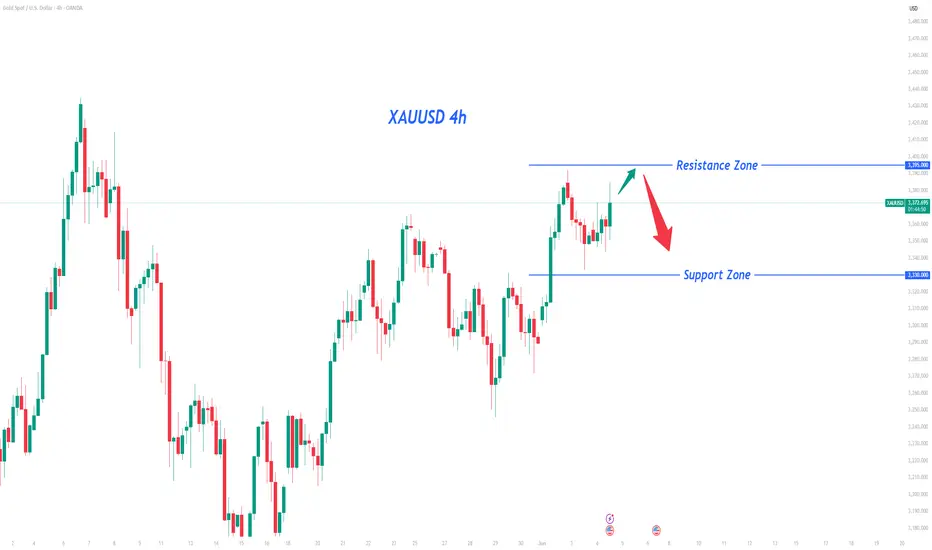
Safe-Haven Demand May Drive Gold Prices Higher✅ Today’s ADP report came in bullish for gold,
✅ Meanwhile, the Federal Reserve’s Beige Book reveals:
A slight slowdown in economic activity
Increased policy uncertainty and price pressures for businesses and consumers
An overall pessimistic economic outlook
📌 Combined with ongoing geopolitical tensions, this creates a supportive backdrop for safe-haven buying in gold.
🔍 Technical Outlook (1D Chart):
Gold is still facing a bearish divergence on the daily chart. For this to resolve, the market must choose between:
1️⃣ A strong breakout with volume, pushing toward 3430–3450
2️⃣ A pullback to repair structure, including filling the gap below 3300, which may later fuel a rally toward 3500+ if bullish catalysts arise
📅 Key Events to Watch This Week:
Thursday: Initial Jobless Claims
Friday: NFP (Nonfarm Payrolls)
⚠️ Also monitor developments on trade tariffs, which may affect market sentiment
📊 Short-Term Trade Plan (Range Strategy):
🎯 Key levels to watch:
Resistance: around 3400
Support: near 3366
📌 Consider range trading between 3408–3358, selling highs and buying dips with strict risk control.
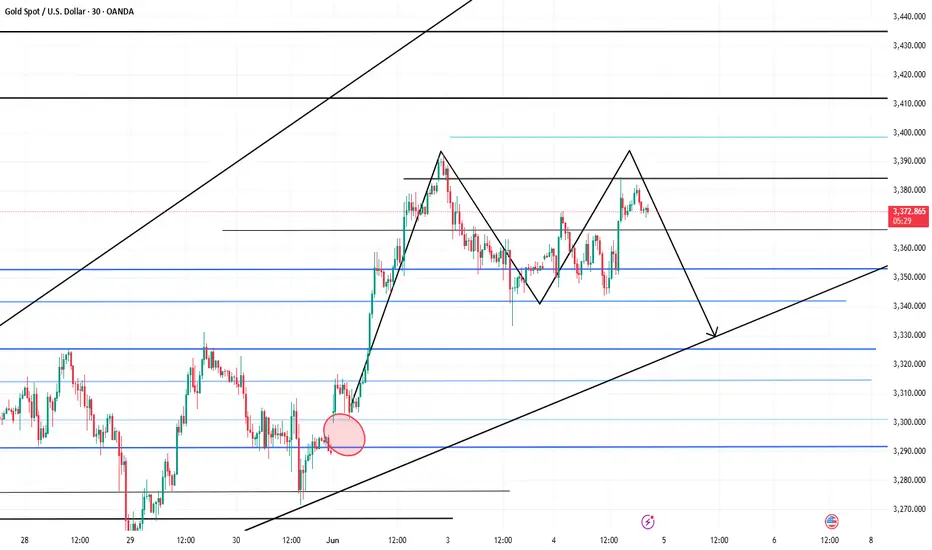
Short-term bearish correction, within a potential bullish setupHere is a more detailed explanation of the chart analysis for XAU/USD (Gold Spot vs. U.S. Dollar) on the 30-minute timeframe:
📊 Chart Summary:
Instrument: XAU/USD (Gold Spot vs. U.S. Dollar)
Timeframe: 30-minute
Current Price: Around 3,359.945 USD
Trend: Short-term bearish correction, within a potential bullish setup
📌 Key Technical Levels:
1. Support Zone 🟩
Level: 3,342.605 USD
This is the zone where buyers are likely to step in. It's a previous demand area where price may reverse or consolidate before moving higher.
2. Resistance Level 🟥
Level: 3,391.323 USD
A key level to watch. If price breaks above this, it signals bullish strength and continuation.
3. Demand Zone 🟦
Level: 3,409.880 – 3,410.342 USD
Target area where strong buying activity previously occurred. Price may gravitate toward this if bullish momentum builds.
🔄 Price Projection Path (Expected Movement):
Price may test the support at 3,342.605, forming a potential reversal base.
A bullish move is expected toward the resistance at 3,391.323.
If broken, price could continue its upward trajectory toward the demand zone around 3,410.342.
🧠 Trading Implication:
Bullish Setup: Look for confirmation near the support zone for a long entry.
Breakout Traders: Watch for breakout above resistance for continuation trades.
Risk Management: Use tight stops below support; consider scaling out near resistance.
Let me know if you'd like a trading strategy or signals based on this analysis.

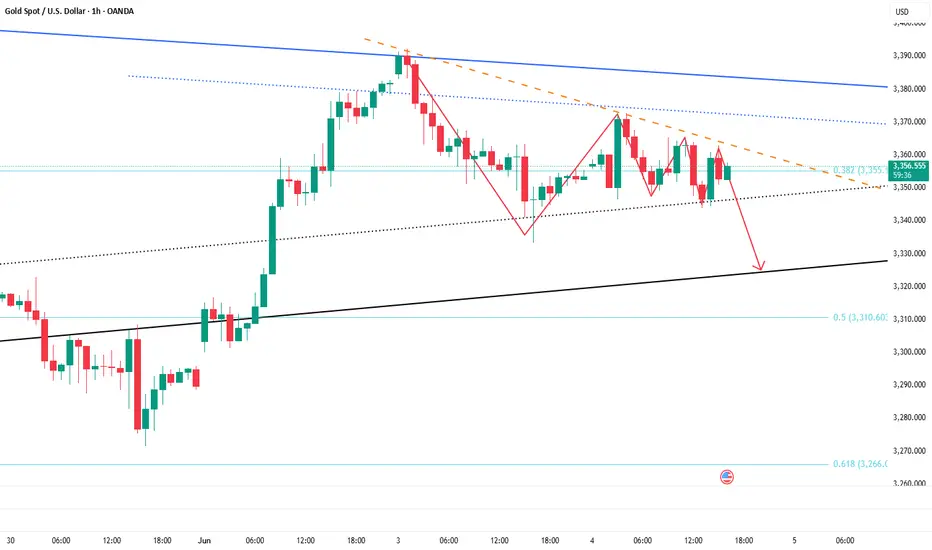
Gold rebounds but hits resistance, pulls back Recently, Nonfarm Payroll data dropped significantly and fell short of expectations 📊! Although the Federal Reserve has remained cautious about rate cuts, under the pressure of persistently weak data, it will face mounting pressure from all sides to cut interest rates and rescue the market ⚠️. Gold successfully stabilized and rebounded today after pulling back to test the vicinity of 3333 at its lowest point ✨! Despite currently trading within a range near 3375-3380 and hitting resistance, unable to break higher 📉, there is still room for trading opportunities 💹🚀.
Gold Trading Strategies
sell@3375-3385
tp:3340-3330
Professional trading strategies are pushed daily 📊
Lock in precise signals amid market fluctuations 🚀
Confused about market trends? Stuck in strategy bottlenecks?
Real-time strategies serve as your "trading compass" 🌐
From trend analysis to entry/exit points, dissect market logic comprehensively
Refer now 📲
Help you move steadily forward in investments ✨
👇👇👇
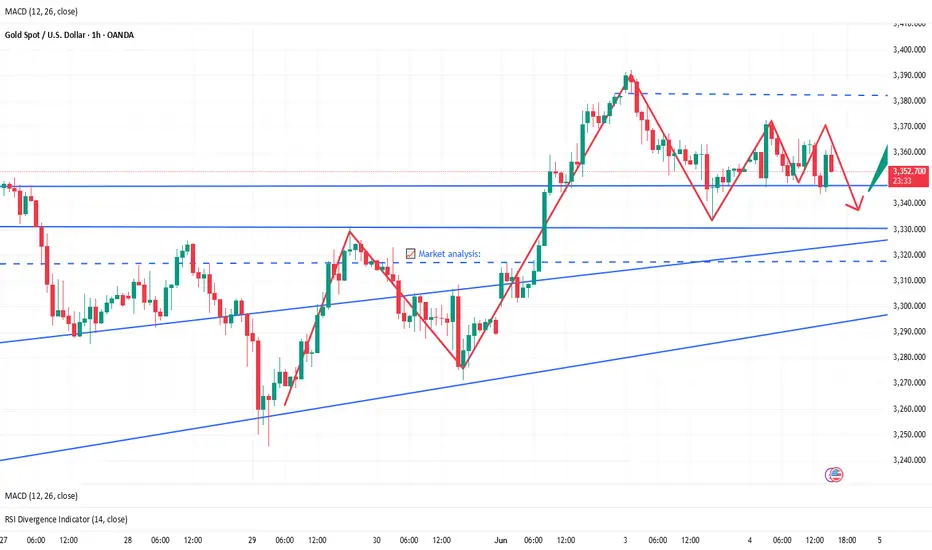
Continue to short goldTechnical aspect:
Although the ADP data release is a big positive for gold, the trend of gold is quite different. It only rebounded to around 3362 and then gradually fell back, which to a certain extent strengthened the effectiveness of the short-term resistance area of 3365-3375. For the time being, technical indicators alone cannot support gold to continue to rebound. After consuming a certain degree of bullish momentum, gold will continue to retreat. And I think 3340 will be broken, and even continue to the 3330-3320 area. So in terms of short-term trading, I still prefer to short gold.
Trading strategy:
Consider shorting gold in the 3360-3370 area, TP: 3345-3335.
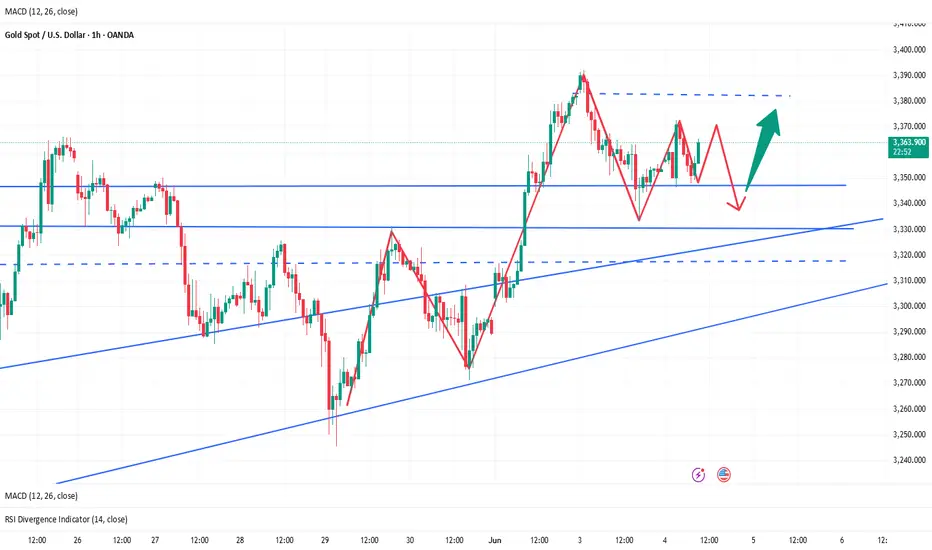
Market situation unclear? Check out this analysis📰 Impact of news:
1. ADP data is significantly positive
2. Trump: "Mr. Too Late" Fed Chairman Powell must cut interest rates now
📈 Market analysis:
The ADP data is significantly bullish, but we cannot rule out that this is an illusion created by the market, because although the daily line has formed a golden cross, it has not fully released the bullish momentum, and has not been able to exert force in the bullish upward trend. Therefore, I prefer to go long at a low position in the US market rather than chasing it immediately. At the same time, the upper 3365 may become a short-term strong pressure level. If the gold price encounters resistance here, the US market will usher in a retracement, and then it will be our time to go long.
🏅 Trading strategies:
SELL 3360-3365
TP 3340-3330
BUY 3330-3317
TP 3360-3370-3400
If you agree with this view, or have a better idea, please leave a message in the comment area. I look forward to hearing different voices.
TVC:GOLD FXOPEN:XAUUSD FOREXCOM:XAUUSD FX:XAUUSD OANDA:XAUUSD
Gold trend analysis and layout before ADP data release📰 Impact of news:
1. May ADP data
2. The geopolitical situation worsens
📈 Market analysis:
Today, the gold price in the Asian session hit the 3370 line and then began to fall. Before the release of the ADP data, the gold price is likely to fall into a volatile pattern. The upper short-term resistance is 3370-3380. Pay attention to whether it can break through 3392, which will determine whether the short-term gold price can reach 3400. Pay attention to the support below 3350-3345, and focus on the 3330 line support. Once it falls below 3330, the gold price may reach 3317. If the ADP data is released and stabilizes near 3317, and then quickly closes the long lower shadow. Then you can rely on the 3317 to enter the market and do more. As long as it rebounds to above 3330 again, then the high point near 3390 above will definitely not be maintained. On the contrary, if gold falls below the 3330 and 3317 levels during the US trading session, don't go long easily. Participate in the high-altitude and low-multiple cycle during the European session. If it retreats to 3355-3345, consider going long with a light position and look at 3360-3370. If it touches 3375-3390 and is under pressure, consider shorting. Focus on ADP data!!
🏅 Trading strategies:
BUY 3355-3345
TP 3360-3370
SELL 3375-3390
TP 3350-3340
If you agree with this view, or have a better idea, please leave a message in the comment area. I look forward to hearing different voices.
OANDA:XAUUSD FX:XAUUSD FOREXCOM:XAUUSD FXOPEN:XAUUSD TVC:GOLD
Gold Faces Strong Headwinds – Beware of Bull Traps!After rebounding to 3368 yesterday, gold dropped below 3340, and recovered slightly above 3350 late in the session.
Today, it briefly touched the 3372 resistance, only to pull back again — showing just how difficult it is for bulls to push higher.
🔍 Technical Overview:
30M chart has broken below key moving averages
1H chart is facing heavy overhead pressure
⚠️ If prices rise on low volume, it’s likely a bull trap.
Only a volume-backed breakout can confirm a real bullish trend.
⚠️ Important Note:
There’s still an unfilled gap below 3300
If bears take control, filling that gap is highly likely
Today’s ADP jobs data will be critical:
If bearish for gold → sub-3300 is likely
If bullish for gold → 3400 becomes a top-tier short zone

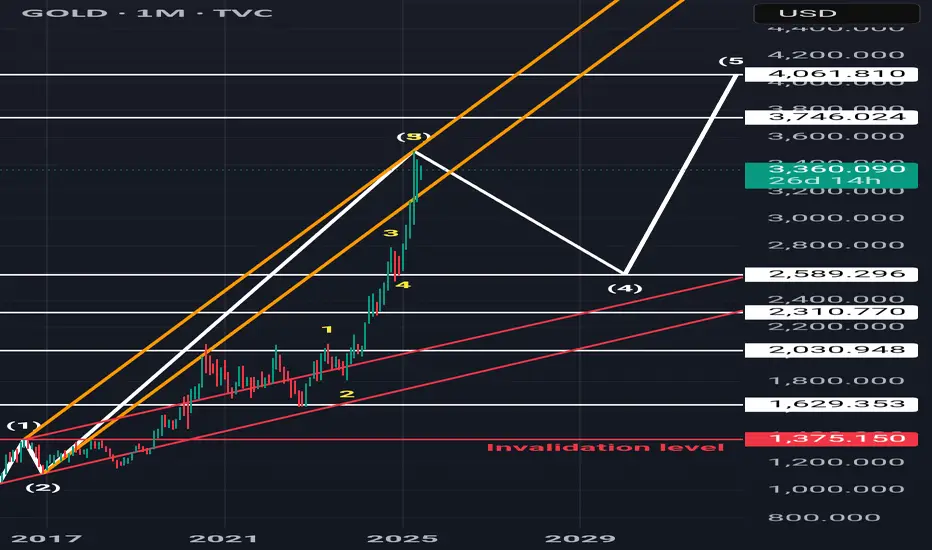
#xauusd #elliottwave short sell setup wave 4 4Jun25This count is based on my assumptions so anything can happen not a trading or financial advice just for educational purposes only kindly do your own ta thanks trade with care good luck.
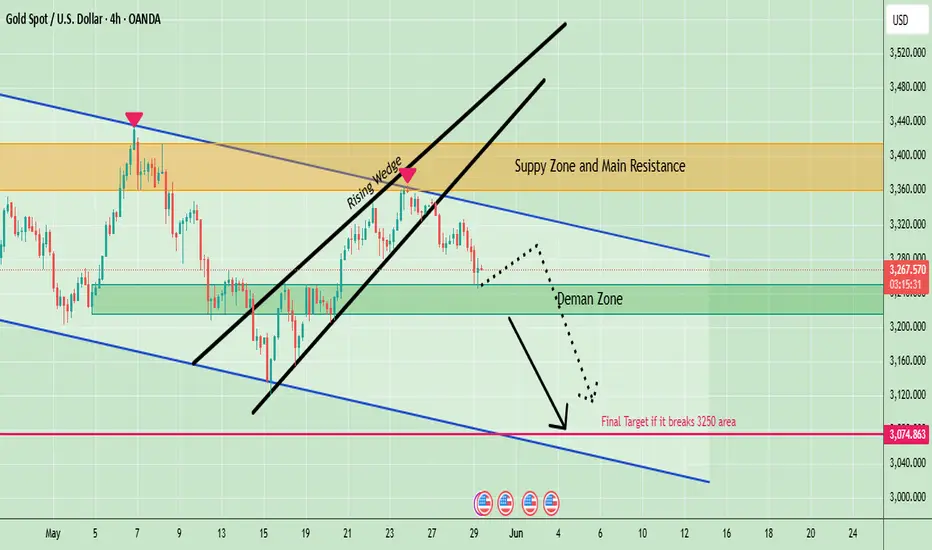
Gold Technical Analysis - Bearish Reversal Confirmed?Gold (XAU/USD) is trading around $3,270 area, exhibiting a bearish trend influenced by technical breakdowns and macroeconomic factors. Gold is currently under pressure, with technical and fundamental factors aligning to suggest potential for further declines. Traders should monitor key support levels and upcoming economic data releases for signs of a reversal or continuation of the bearish trend.
📉 Technical Analysis
Gold has declined from recent highs near $3,370 , indicating a loss of bullish momentum.
The price has broken below the $3,280–$3,295 support zone, now acting as resistance, suggesting potential for further downside.
Key Support and Resistance Levels:
Resistance:
$3,280–$3,295: Immediate resistance zone.
$3,300–$3,310: Critical resistance area; a breakout above could indicate a bullish reversal.
Support:
$3,240–$3,245: Current support zone; a drop below may lead to further declines.
$3,200: Psychological support level; breaching this could accelerate bearish momentum.
🌐 Fundamental Factors
The U.S. dollar has strengthened due to the Federal Reserve's cautious stance on rate cuts, making gold less attractive as a non-yielding asset.
Economic Data:
Upcoming U.S. GDP and PCE data releases are anticipated to influence gold prices, with strong data potentially exerting further downward pressure.
Note
Please risk management in trading is a Key so use your money accordingly. If you like the idea then please like and boost. Thank you and Good Luck!
Continue to short gold after the reboundTechnical analysis:
Gold rebounded after hitting 3333 overnight. So far, it has reached 3361. However, it can be clearly seen from the rebound process that the rebound is not strong, so I think the rebound space may not be too high. In the short term, it faces resistance in the 3365-3375 area. The strong resistance above the 3390-3400 area still exists, so it may be difficult for bulls to make a major breakthrough in the short term; and the support area below in the short term is in the 3340-3330 area, and the important support is in the area around 3320;
Trading strategy:
Consider shorting gold in the 3365-3375 area, TP: 3350-3340
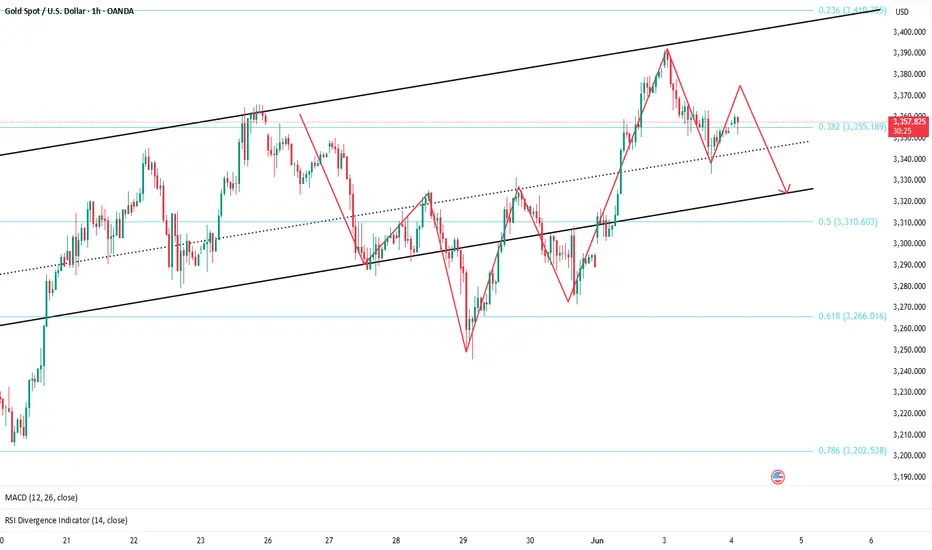
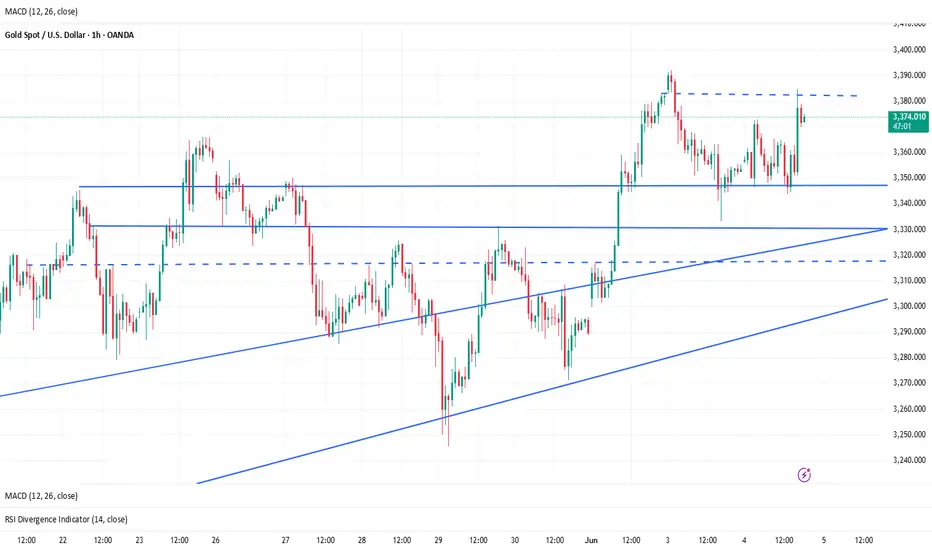
6/4 Gold Analysis and Trading SignalsGood morning, everyone!
Gold experienced a strong intraday reversal yesterday, pulling back sharply after an initial rally. The price rebounded after entering our 3338–3321 buy zone, and is now approaching the 3362 resistance level. Technically, the short-term structure remains within an ascending rebound channel.
Key resistance levels to watch today:
First resistance near 3378
Psychological level at 3400
Extended resistance zone at 3416–3438
If price stalls near 3362 and pulls back, support is expected around 3345–3336, which could form a secondary bottom. If the rejection happens closer to 3380, then 3358–3352 is the support zone to watch. Should gold rally into the 3400–3416 area, keep a close eye on 3385, 3372, and 3365 as potential pullback supports.
📉 Technical Outlook:
4H chart: Price remains in a mild uptrend channel, with key structural support at 3323–3307. However, volume is not confirming the rally, and a potential double top formation cannot be ruled out.
1H chart: Strong support lies at 3343. The MACD is at a decision point, with bulls slightly favored. If volume increases, gold may retest the 3390 high or even push higher.
🗞 Fundamental Factors:
Today, focus on the ADP Employment Report and key Fed-related news during the U.S. session, which may create sharp intraday volatility or alter the trend trajectory. Be especially alert during the New York session.
📌 Today’s Trade Plan:
Sell between 3418–3438
Buy between 3318–3306
Key levels for tactical trades:
3413 / 3392 / 3381 /3365 / 3358 / 3343 / 3328
Strategy Outlook:
Maintain a “sell high, buy low” intraday approach, focus on volume-driven breakouts, and avoid chasing extreme moves blindly.
