Gold (XAU/USD) in Symmetrical Triangle – Short‑Term Squeeze,Price Structure & Technical Setup
Gold is consolidating within a symmetrical triangle, showing lower highs and higher lows—a classic precursor to breakout in either direction
Fxglory Ltd
+5
TradingView
+5
Babypips.com
+5
TradingView
+2
Babypips.com
+2
TradingView
+2
.
Trendlines converge tightly around $3,326–$3,334, hinting at imminent directional acceleration
Investopedia
+4
TradingView
+4
TradingView
+4
.
🎯 Key Levels & Targets
Scenario Trigger Confirm Area Targets Stop Loss
Bullish Breakout above $3,344–$3,350 $3,369 → $3,396 → $3,422–$3,550 ~$3,340
Bearish Breakdown below ~$3,326–$3,320 $3,320 → $3,300 → $3,297 → $3,255 ~$3,335–$3,340
A breakout above $3,344–$3,350 validated with volume may drive prices toward $3,400+, with extended targets up to $3,550 or higher in bullish conditions
Traders Union
Time Price Research
.
A drop below $3,326–$3,320 risks further decline, targeting $3,300, $3,297, and eventually $3,255 if breakdown momentum builds .
📉 Market Context & Drivers
U.S. dollar strength, easing safe-haven demand, and optimistic trade sentiment are constraining gold’s upside unless breakout forces emerge .
Key upcoming catalysts: FOMC guidance, U.S. macro data (GDP, inflation), and geopolitical developments—their tone could tip the bias direction .
⚙️ Trade Rules & Risk Management
Wait for a confirmed breakout or breakdown—do not trade mid-range.
Confirm break with at least one close outside the triangle and rising volume .
Position sizing: Risk 1–2% per trade, adjust stop-loss to price structure ($8–$15 depending on volatility).
Take profits in stages: scale out at minor milestones (first targets), trail stop for extended targets.
Avoid chasing price within the middle of the triangle—risk/reward is unfavorable.
🧠 Why This Plan?
Follows textbook symmetrical triangle trading methodology: entry on breakout, stop beyond pattern opposite side, projection based on triangle height .
Aligns with broader outlook: bearish unless convincing upside breakout appears, consistent with analyst consensus hedging current bull exhaustion and wait‑and‑see on policy signals .
✅ Summary
Gold is coiling inside a tight triangle range near $3,326–$3,334, with breakout potential identified to either side:
Bullish breakout over $3,344–$3,350 targets up to $3,550 or beyond.
Bearish breakdown under $3,326–$3,320 risks slide towards $3,300–$3,255.
Wait for confirmation, apply disciplined risk controls, and let volume validate the move.
Xauusdshort

Scalping Sell Setup – Trendline Break & Pullback Confirmation📉 Scalping Sell Setup – Trendline Break & Pullback Confirmation
Posted earlier – trade progressing as planned.
As shared in the previous chart, a Sell scalp position was executed based on the trendline break followed by a pullback retest.
Three Take-Profit levels were marked and the price is moving in line with the forecast. ✅
🟢 TP1 Hit
🟢 TP2 Reached
🔵 TP3 in progress
📌 The setup remains valid, and as long as structure holds below the retested trendline, the bearish bias continues.
We will monitor price action near TP3 zone for final exit or trailing stop update.
> Analysis worked perfectly so far – let’s see if TP3 gets cleared soon. 🔍💥
Gold: ADP, Fed & Key Resistance Gold has been range-bound today—let’s focus on the impact of the ADP data and Fed rate decision ⚠️.
Key resistance lies around 3345-3350 📍: a breakout could fuel further upside 📈, while a rejection may trigger an oscillating pullback 📉
⚡️⚡️⚡️ XAUUSD ⚡️⚡️⚡️
🚀 Buy@ 3325
🚀 TP 3333 - 3339 -3344
Daily updates bring you precise trading signals 📊 When you hit a snag in trading, these signals stand as your trustworthy compass 🧭 Don’t hesitate to take a look—sincerely hoping they’ll be a huge help to you 🌟 👇

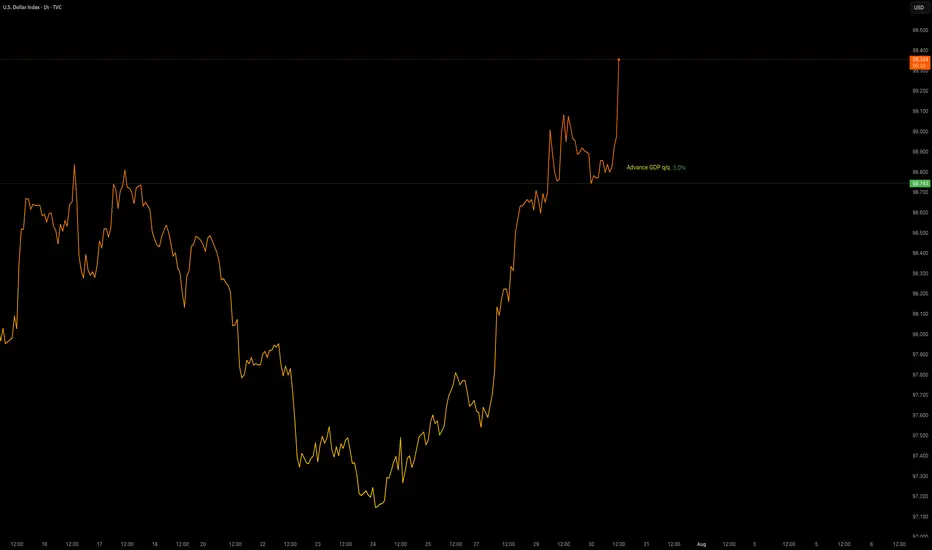
Data Release - Advance GDP q/q (3.0%)Jul 30 2025: ADVANCE GDP q/q (3.0%)
OANDA:XAUUSD sees some downside pressure with positive GDP data.
TVC:DXY gaining strength.
Volatility is increased. This data will be used with Interest Rate Decision later in the day to provide a XAUUSD insight.
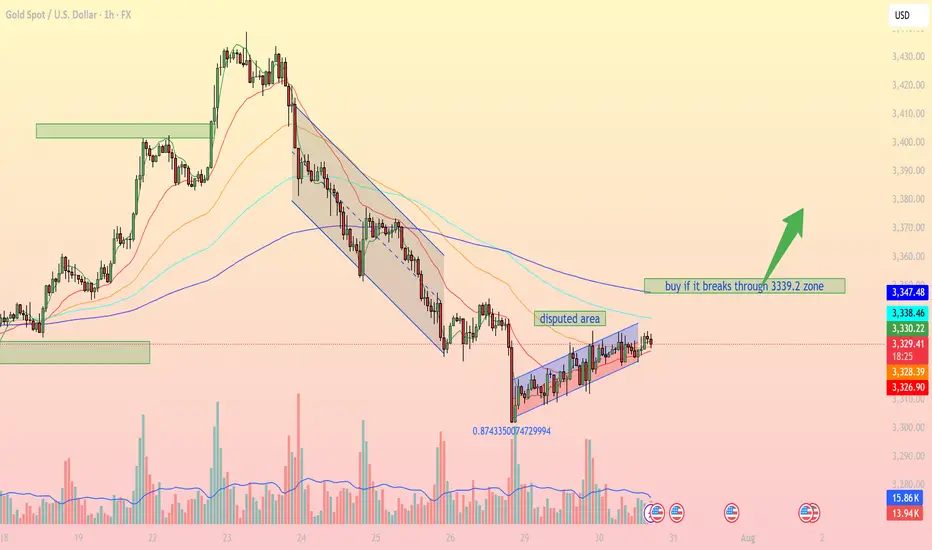
Accumulation pattern awaiting breakout confirmationIntraday Outlook: Accumulation pattern awaiting breakout confirmation
On the 1H timeframe, XAUUSD is forming a clear consolidation pattern within a narrow ascending channel after falling from a prior distribution zone. Buyers are attempting to regain control, but strong resistance remains around the 3,339 – 3,347 USD area.
1. Technical Breakdown:
Trendline & Channel: Price is currently moving inside a small rising channel, indicating a short-term bullish bias, though momentum remains limited.
EMA Dynamics: EMA 20, 50, and 100 are beginning to converge, signaling a potential breakout. A bullish EMA crossover (EMA20 > EMA50) could confirm stronger upward momentum.
Disputed Area: This zone represents heavy indecision between bulls and bears. A clear breakout above or below is needed for directional clarity.
Fibonacci Level: The 0.874 retracement level from the recent low shows strong buyer interest, potentially forming a short-term bottom.
2. Key Support & Resistance Levels:
3,339.2 USD Major resistance – needs to be broken for bullish continuation
3,347.4 USD Next resistance if breakout occurs
3,328.2 USD Immediate support (current price zone)
3,326.7 USD Strong support if price retraces
3. Suggested Trading Strategies:
Scenario 1 – Breakout Buy Strategy:
Entry: Buy if price breaks and closes above 3,339.2 USD on the 1H chart.
Stop Loss: Below 3,328 USD.
Take Profit: First target at 3,347, extended targets at 3,358 and 3,372 USD.
Scenario 2 – Pullback Long Entry:
If price fails to break resistance, consider buying the dip near the 3,326 – 3,328 USD support zone for a better risk-reward setup.
Scenario 3 – Breakdown Sell Setup:
If price breaks below 3,326 USD and exits the channel, a bearish move towards 3,295 – 3,300 USD becomes likely.
Gold is in a key consolidation phase, with the 3,339 USD resistance acting as the decisive breakout zone. Traders should closely monitor price action, volume, and EMA behavior to catch the next directional move.
Follow for more trading strategies like this. Save this post if you find it useful!
Gold Price Analysis July 30Gold (XAUUSD) Consolidating in a Triangle Pattern – Preparing for a Big Breakout
Currently, gold is moving within a triangle consolidation pattern, reflecting the market’s indecision as investors await a series of important economic data from the US this week. This hesitation suggests that a breakout from the triangle pattern could trigger a strong FOMO effect, creating a significant price movement in either direction.
The current price action is similar to a “bull flag” or “pennant” pattern, where a breakout could lead to a clearer and more decisive trend. If the support zone in the pattern fails to hold, the possibility of a sell-off is high.
Trading scenario:
🔻 Activate SELL order:
When price breaks the triangle bottom around 3324
Downside target: 3285, further is the strong support zone at 3250
🔺 Activate BUY order:
When price breaks and holds above the resistance zone 3333
Or: when there is a bearish rejection signal and candle confirmation at the area 3385

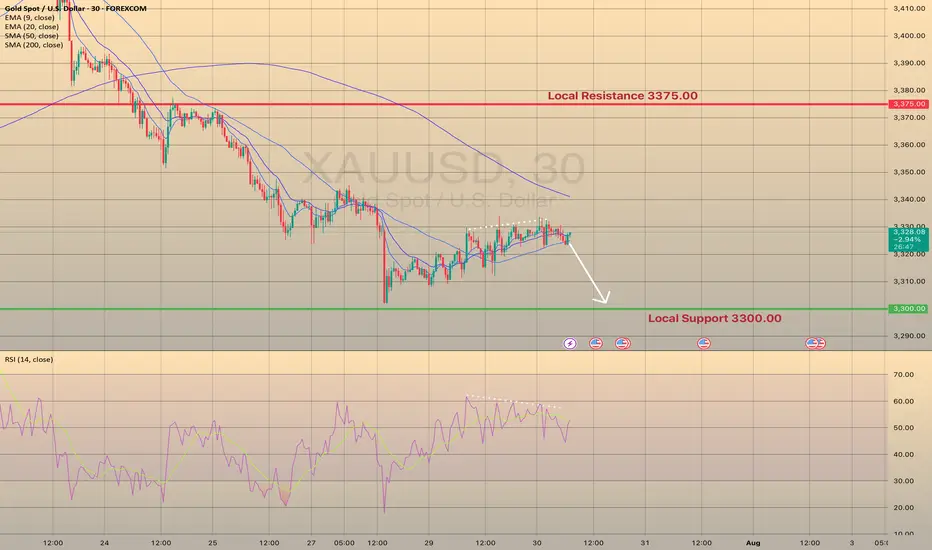
XAUUSD. MINOR UPWARDS CONSOLIDATION BEFORE THE NEXT MOVE.XAUUSD. MINOR UPWARDS CONSOLIDATION BEFORE THE NEXT MOVE.
XAUUSD rebounded from local support level of 3,300.00 and attempted to develop some bullish momentum here yesterday. However, the price went into consolidation, showing us the weakness of this short-term bullish rebound. RSI shows the bearish divergence, the price is ready to drop. Of course, fundamentals of last couple of days don't favor this asset either. The decline towards support level of 3,300.00 is expected.
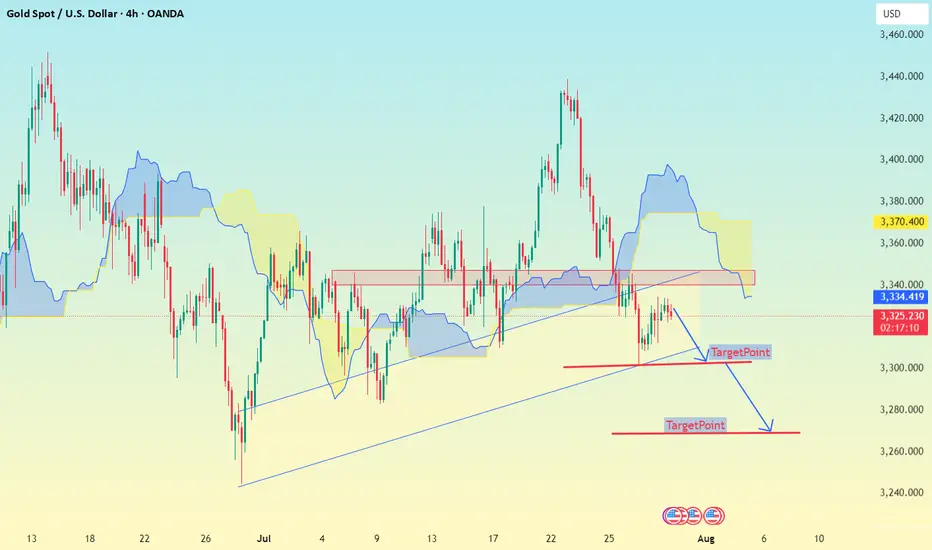
XAU/USD (Gold Spot vs US Dollar) Technical Analysis – 4H Char🔍 XAU/USD (Gold Spot vs US Dollar) Technical Analysis – 4H Chart
Based on my shared image from TradingView, here's a detailed analysis of the current XAU/USD market scenario:
---
🧩 Chart Type & Indicators Used
Timeframe: 4-Hour (H4)
Platform: TradingView
Indicators:
Ichimoku Cloud
Bollinger Bands (BB)
Support/Resistance zones
Trendlines
Price Action with Target Points Marked
---
📉 Current Market Structure
Price: ~$3,324 (Sell/Buy zone shown)
Overall Trend: Turning bearish in the short term.
Price Action:
Price has broken below an ascending trendline, suggesting a shift from bullish to bearish momentum.
The price is trading below the Ichimoku cloud, reinforcing a bearish bias.
Failed retest of the cloud resistance zone (around 3,335–3,340), which now acts as a resistance.
---
🔻 Bearish Signals
1. Trendline Break:
The rising trendline support (mid-July to now) is broken.
This indicates a potential reversal from the previous bullish momentum.
2. Retest & Rejection:
Price attempted to retest the breakdown zone and was rejected from the 3,335–3,340 level.
3. Ichimoku Cloud Bearish Setup:
Price is clearly below the cloud.
Future cloud is bearish (red shaded).
Chikou Span (lagging line) is below price candles and cloud.
---
🎯 Targets
First Target Point: ~3,300
This is the next horizontal support level (near recent lows).
Final Target Point: ~3,270
Stronger support zone and measured move from breakdown.
---
🛡 Resistance Zone
Immediate Resistance: 3,335–3,340
Stronger Resistance: 3,370
---
📌 Conclusion
The XAU/USD 4H chart shows a bearish breakout below the rising channel, with confirmation from Ichimoku and price rejection at cloud resistance. The market is targeting 3,300 as the first support, and if that breaks, 3,270 will likely follow.
---
✅ Strategy Suggestion (if trading):
Bias: Short/Sell
Entry: After a weak pullback or retest near 3,330–3,335
Targets:
TP1: 3,300
TP2: 3,270
Stop Loss: Above 3,345 or near 3,350 zone
Let me know if you'd like this in simpler terms or want me to track the next setup.
XAUUSD analysis - 1H FVG and OB setupsOn the 1H timeframe, price is currently approaching two key supply zones (OB 1H):
🔴 First OB zone: around 3354 – 3360
🔴 Second OB zone: around 3368 – 3370
We're watching these zones for potential short setups, only with confirmation on the lower timeframes (5M or 3M).
If price reacts to one of these OBs, we expect a move down toward the green 1H demand zone around 3280 – 3290, where a long setup may later form.
📌 Key scenarios:
1️⃣ Price hits the first OB → confirmation → short
2️⃣ Price moves to the second OB → confirmation → short
3️⃣ Target for both setups = green OB around 3280
4️⃣ No entry without confirmation from LTF
❗️ Do NOT enter without lower timeframe confirmation.

Are you ready for the BUY BTCUSD signal?✏️ The pennant pattern is forming. After BTCUSD reached a new peak, the past 1 week, BTC price has been accumulating to form a bullish pennant pattern. This is a bullish continuation pattern that signals when breaking the upper boundary of the flag pattern.
📉 Key Levels
BUY Trigger: Break and trade above 199000
Target 128000
Leave your comments on the idea. I am happy to read your views.

7/30: Watch for Sell Opportunities in the 3352–3363 ZoneGood morning, everyone!
After a period of consolidation and decline, gold has found preliminary support near the 3300 level, and early signs of a bottom formation are emerging. The key technical level now lies around the 3332–3337 resistance zone. Based on current price structure, a breakout is likely, with major resistance seen at 3352–3358, while 3323–3316 serves as the primary support range.
However, caution is warranted as today’s ADP employment data may significantly influence short-term price action. Whether gold can hold above the 3337–3343 level depends on the data's impact.
From a broader perspective:
On the weekly chart, the 20-period moving average (MA20) has climbed to around 3276, yet the overall structure remains bearish for bulls
On the daily chart, gold is still trading below the MA60, facing notable resistance
This week's key events — ADP (Wednesday), jobless claims, and NFP (Thursday and Friday) — will likely shape gold’s medium-term trend
Trading Strategy for Today:
Focus on the 3313–3353 trading range, and be highly responsive to data-driven volatility.
Important note: If gold rises to 3343–3358 before the ADP release, then regardless of whether the data is bullish or bearish, the preferred approach is to sell into strength, as a post-data pullback is a likely scenario.

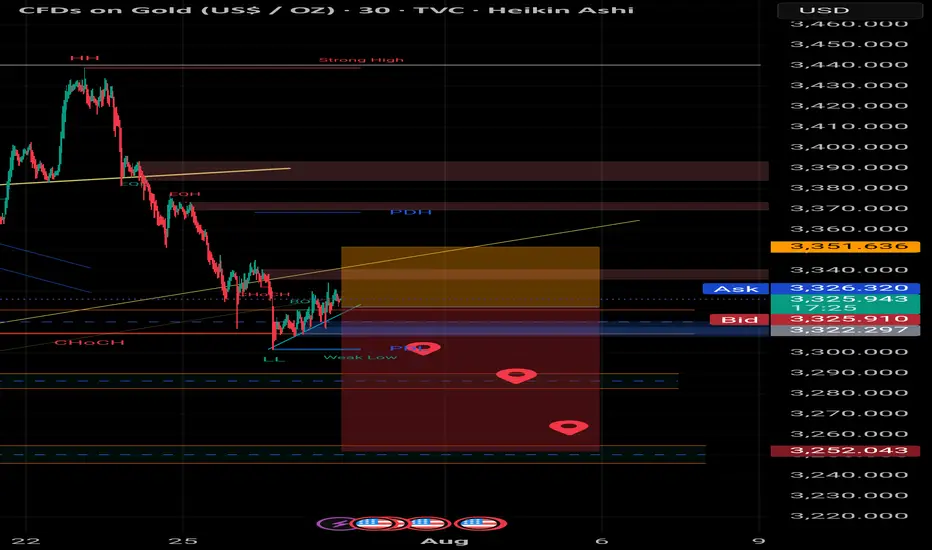
Sell Analysis – 30M Smart Money Concept Sell Analysis – 30M Smart Money Concept
📊 Chart Context:
Timeframe: 30M
Market: Gold (XAUUSD)
Bias: Bearish – Scalp Sell
---
🔍 Key Observations:
Premium Zone Rejection:
Price tapped into a premium supply zone formed after a clear break of structure (BoS) to the downside. This confirms seller dominance at higher pricing levels.
FVG (Fair Value Gap) Fill:
The price filled a previous FVG imbalance and showed rejection without closing above the origin of the impulse. This shows liquidity grab behavior typical in smart money moves.
Bearish Order Block Confirmation:
A bearish OB was respected and reacted to. The latest candle shows strong rejection with a long upper wick and volume tapering — an early confirmation of potential entry trigger for scalp short.
---
🧨 Entry Strategy (Scalp Sell):
Entry Zone:
Inside the reaction to the OB and FVG (just below the premium zone)
✅ 3325 ~3330
Stop Loss:
Just above the last high or FVG origin
✅ 3340
Take Profit:
TP1: Towards the equilibrium of the recent impulse leg
✅ 3300
TP2: Below the discount zone, targeting liquidity under recent lows
✅ 3280
---
⚠️ Risk Note:
This is a scalping setup, not a swing trade. Higher timeframes still show mixed signals, so risk management is key. Avoid over-leveraging.
---
🏁 Summary:
> A high-probability scalp sell setup confirmed by smart money concepts: BOS → FVG Fill → OB Rejection → Liquidity Grab → Bearish Continuation.
Gold Eyes Rebound Toward $3,438 TargetGold (XAU/USD) is trading near $3,314, approaching support along the rising trend line. A potential bounce could target the $3,438 resistance area, as marked in the chart.

BTC's latest trading strategy and analysis layout#BTCUSD
BTC's current technical signals show a bull-bear tug-of-war situation.If a golden cross is formed near the zero axis, it may indicate a new wave of rise; if it falls below the zero axis, we need to be wary of a deep correction.
There are certain opportunities for both bulls and bears in the current market, but global regulatory policies have not yet been unified. Policies such as the US "GENIUS Act" may affect BTC and require continued attention. BTC is currently facing significant buying support around 117,500, but the hourly chart shows that there is still potential for a continued pullback. The current trend has not yet finished. Pay attention to the support level of 116,000 below. If it falls below, it may fall into the consolidation range of 116,000-114,000. For aggressive traders, consider going long at 117,500-116,500, with a target of 118,500-119,500. A break above this level could lead to 120,000.
🚀 117500-116500
🚀 118500-119500

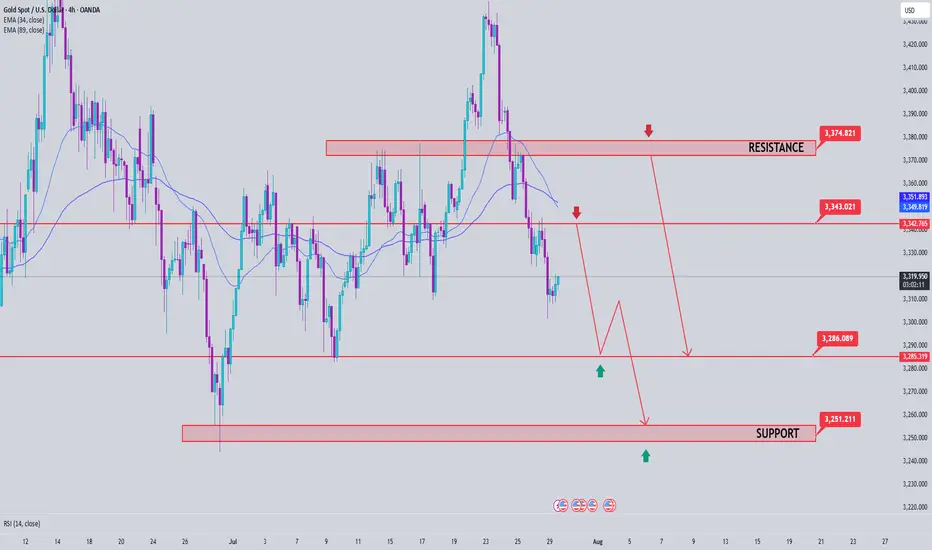
Gold Price Analysis July 29📉 XAUUSD ANALYSIS – IS THE CORRECTION OFFICIALLY STARTING?
Gold has officially broken out of the bullish wave structure and left the rising price channel – an important technical signal that the bearish correction trend has been activated. This development opens up the possibility of retests of the broken trendline, and if that happens in today's session, this could be a good opportunity to look for SELL entry points in the new trend.
📌 Short-term trading strategy:
Potential selling zone: 3343 – 3345
Downside target: 3283 first, followed by the strong liquidity zone around 3250
Confirmation of bearish force: Price continues to maintain below the 3375 area – which will act as an important resistance level. Only when the daily candle closes back above this zone will the uptrend be re-established.
✅ Reverse buying strategy if there is a strong support signal:
Buy trigger zone: Observe the price reaction around the 3285 area - there needs to be a clear bearish rejection signal (pin bar/bullish engulfing candle...)
Deeper buying zone: 3251 - where liquidity is concentrated and there is a possibility of bottom-fishing demand appearing.
GOLD: Time for massive drop? +3000 pips move! Gold has failed to breakthrough the previous resistance indicating a strong sellers hold around $3440 region. Now since the price has stared dropping we can see it dropping around $2800 in long term. In order for this to happen we need strong confirmation, which will help us understand the possible volume.
Agree with our idea?
Like and comment!

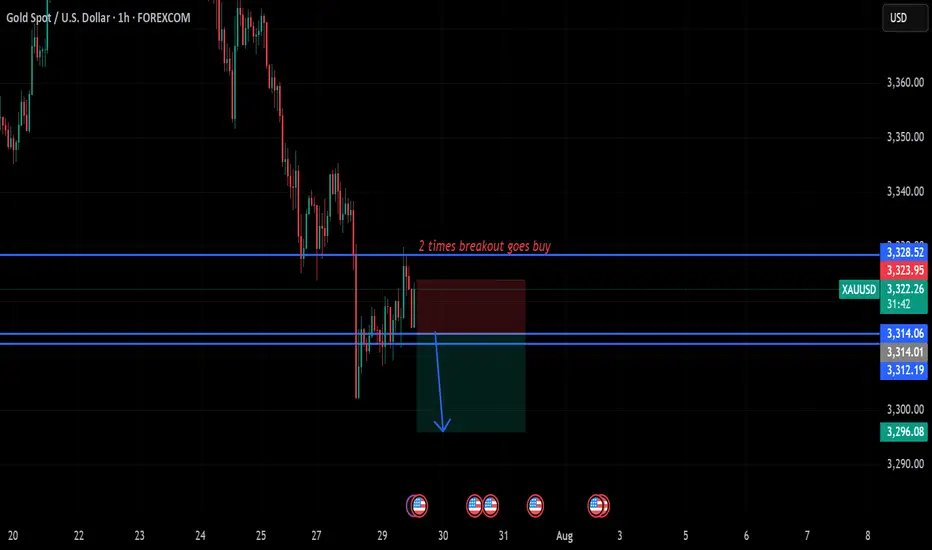
gold on sideways#XAUUSD price await double breakout above 3328.6 for bullish to take place. But now we await for any breakout to take trade.
Below 3314 holds sell continuation, target 3296, stop loss 3324.
Above 3328.6 on 2 times breakout will start bullish till 3340.
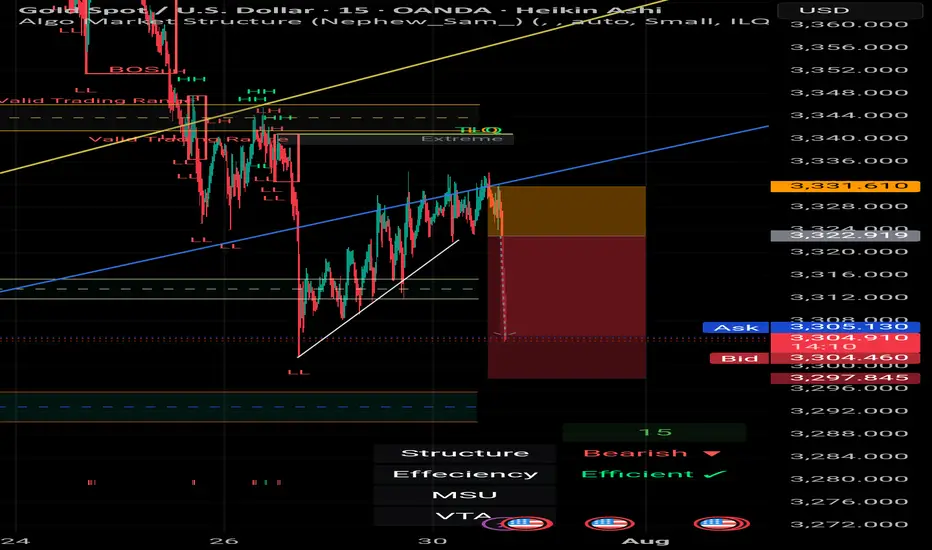
GOLD / XAUUSD TodaySSM Struckture is bearish
I have two scenario to sell setup
Now I open first if hit Sl and still rules to entry I will open next one

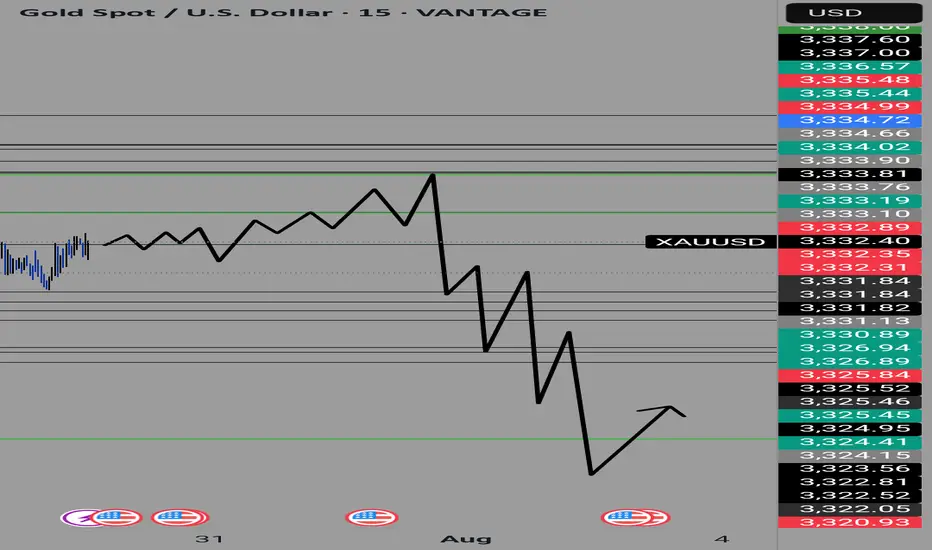
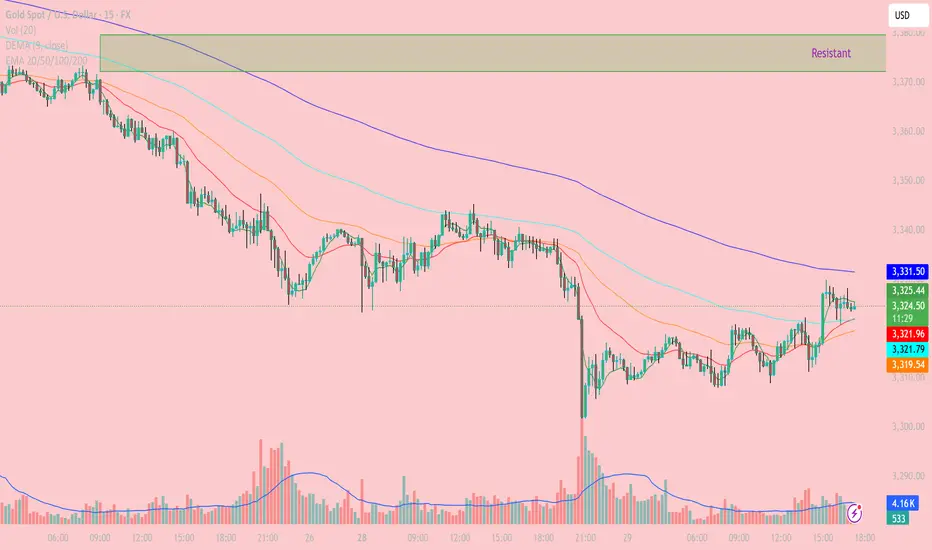
XAUUSD – Gold Intraday Technical Analysis (15-Min Chart) - July Current Price: 3,323.93 USD
Timeframe: 15 minutes
Last update: 17:14 UTC+7
- Trend Overview:
The 15-minute chart shows a minor recovery after a sharp drop in gold prices. However, overall pressure remains bearish as price continues to trade below all key EMAs (50–100–200), and the bulls have yet to break through significant resistance above.
- Key Technical Zones:
Nearby Resistance:
3,331.57 (EMA200): dynamic resistance, repeatedly tested but not broken
3,340 – 3,350: supply zone + 0.618 Fibonacci retracement
3,360 – 3,375: strong resistance zone (purple box), previous major rejection area
Nearby Support:
3,321.70 – 3,319.34 (EMA50 – EMA100): also aligns with 0.382 Fibonacci support
3,309 – 3,310: previous low, potential demand zone on deeper pullback
- Technical Analysis:
EMA & Structure:
Price is testing EMA200 (3,331.57) – a key level to watch for confirmation of any trend reversal. However, the larger trend remains bearish as long as this resistance holds.
EMA9 and EMA20 have crossed above EMA50, suggesting short-term bullish momentum, though not yet strong enough to confirm a full reversal.
Volume Analysis:
Recent bullish candles were supported by higher volume, but the current rally is weakening in volume – a sign of fading buying pressure.
RSI (not shown but recommended):
Watch for RSI break above 60 to signal potential continuation toward higher resistance levels.
- Trading Strategies:
Scenario 1 – Sell at Resistance (Sell on Rally):
Entry zone: around 3,330 – 3,335
Stop loss: above 3,340
Targets: 3,320 → 3,310
Rationale: Price is testing EMA200 and resistance; no confirmed breakout yet
Scenario 2 – Short-Term Buy on Dip:
Entry zone: 3,319 – 3,321 (EMA50/100 confluence)
Stop loss: below 3,308
Targets: 3,330 – 3,335
Rationale: Minor support holding, potential short bounce if price stabilizes
- Conclusion:
Gold is attempting a short-term rebound, but the broader trend remains bearish unless price breaks above 3,340 – 3,350 resistance. For now, focus on short setups at resistance and scalping small bounces from strong support zones.
Follow to receive more daily strategies – and don’t forget to save this if you find it useful.
Got a different view on gold today? Let’s discuss it in the comments!
GOLD Slips as Dollar Gains on Trade Deal – Bearish Below 3349
Gold Pares Gains as USD Strengthens on Trade Deal Ahead of Fed
Gold gave up early gains, pressured by a stronger U.S. dollar after the announcement of the US–EU trade agreement.
Meanwhile, attention shifts to upcoming U.S.–China negotiations later today, as both sides aim to extend the current trade truce and avoid new tariffs.
Investors are also closely watching the Federal Reserve’s policy decision on Wednesday, seeking signals on future interest rate moves.
TECHNICAL OUTLOOK:
Gold maintains a bearish trend while trading below 3349, with potential downside toward 3320.
A 1H candle close below 3320 – 3312 would confirm extended bearish pressure targeting 3285, driven in part by ongoing geopolitical risks.
⚠️ To shift back to a bullish structure, the price must stabilize above 3349.
Key Levels:
• Support: 3320 – 3285 – 3256
• Resistance: 3365 – 3375
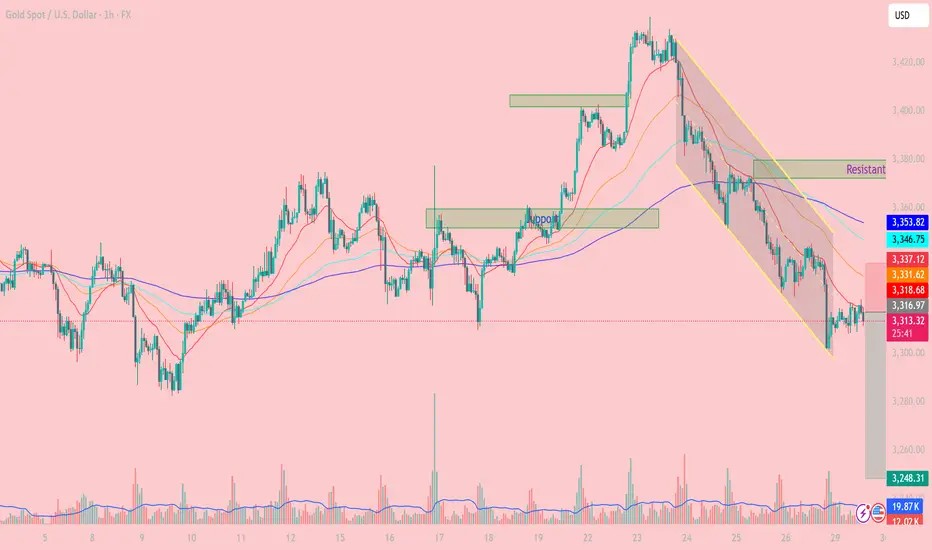
Downward Pressure Resumes After Channel BreakdownXAUUSD OANDA:XAUUSD – Downward Pressure Resumes After Channel Breakdown: Key Levels and Strategy for Today
As of the July 29 session, gold (XAUUSD) remains under short-term bearish pressure, having broken below the descending price channel on the 1H timeframe. The market structure confirms a dominant bearish trend as price continues to trade below the EMAs cluster.
1. Price Action and Market Behavior
XAUUSD is forming a clear sequence of lower highs and lower lows, confirming a short-term downtrend.
Price is currently hovering around $3,316 after breaking below the lower boundary of the channel, signaling potential continuation of the sell-off.
2. Key Resistance and Support Levels
Immediate resistance: 3,337 – 3,346 USD (aligned with EMA20, EMA50 and prior channel resistance).
Major resistance: 3,378 – 3,385 USD (confluence of Fibo and former high).
Near-term support: 3,300 USD (psychological level).
Major support: 3,248 USD (projected target based on measured move from channel height).
3. Technical Indicators
EMA20 and EMA50 are both below EMA200, forming a classic “death cross” – a strong bearish signal.
Volume increased on the breakdown, reinforcing the strength of bearish momentum.
RSI remains below 50, indicating weak bullish retracements and room for further downside.
4. Trading Strategy
Primary Strategy: Sell on Rally
Ideal entry zone: 3,331 – 3,346 USD.
Stop Loss: Above 3,353 USD (above key resistance zone).
TP1: 3,300 USD.
TP2: 3,248 USD (extended target based on breakout structure).
Alternative Strategy: Countertrend Long
Only consider buy setups if strong reversal candles and bullish RSI divergence appear near 3,248 USD.
XAUUSD continues to face downside risk after the channel breakdown. Unless bulls reclaim the 3,337 – 3,346 zone, price is more likely to drift lower toward 3,300 and potentially 3,248. Traders should remain patient and wait for clean setups around these key zones.
Follow for more strategies and remember to save this post if you found it helpful.
Let me know if you'd like a short version for the TradingView caption or hashtags suggestion.
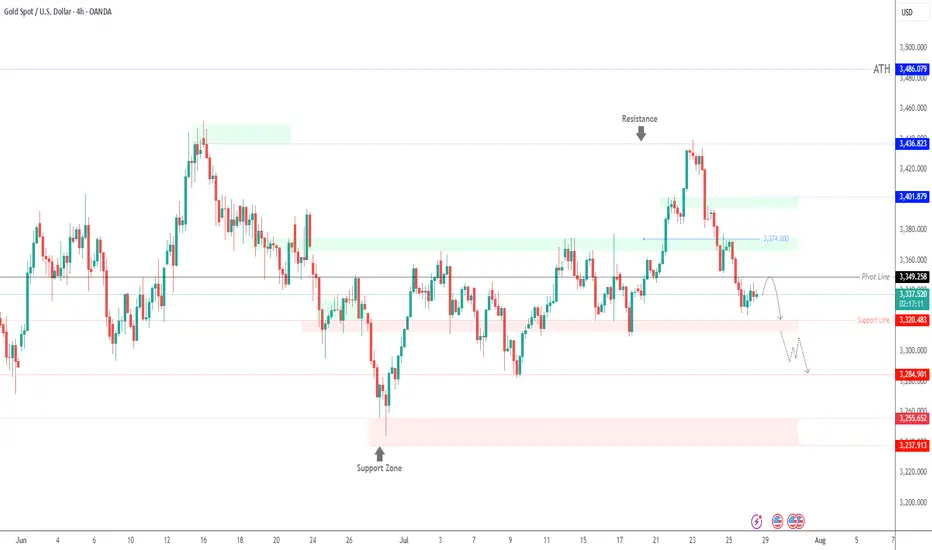
Gold Spot / U.S. Dollar (XAUUSD) 4-Hour Chart4-hour chart from OANDA shows the price movement of Gold Spot (XAUUSD) from mid-July to late August 2025. The current price is 3,425.000, with a slight increase of +0.03% (0.880) to 3,315.325. Key levels include a sell price of 3,315.070 and a buy price of 3,315.590. The chart highlights a recent downward trend with a support zone around 3,313.855 and resistance near 3,350.823, as indicated by the shaded areas.
