Long orders have made profits, gold layout in the evening📰 Impact of news:
1. Economist: The Federal Reserve may cut interest rates sharply in December
2. Lee Jae-myung, candidate of the Democratic Party of Korea, was elected president of South Korea
📈 Market analysis:
Currently, the gold price is in a consolidation pattern, showing an overall volatile pattern during the day. The hourly Bollinger Bands are opening downward, and the MACD indicator is running in a dead cross. In the short term, the bears have a certain advantage. However, observing the 4H level, it can be found that the RSI indicator crosses when entering the overbought area, suggesting that the risk of a correction in the short term has increased. For evening operations, it is recommended to wait for the gold price to stabilize before entering the market, focusing on the important support of 3335-3325. If it obtains effective support and stabilizes in this range, the gold price may resume its upward trend. If it falls below 3325, the bullish momentum will be weakened. Therefore, it is recommended to wait for a pullback to 3335-3325 to go long in the US market, and look to 3350-3370 in the short term.
🏅 Trading strategies:
BUY 3335-3325
TP 3350-3370-3400
If you agree with this view, or have a better idea, please leave a message in the comment area. I look forward to hearing different voices.
TVC:GOLD FXOPEN:XAUUSD FOREXCOM:XAUUSD FX:XAUUSD OANDA:XAUUSD
Xauusdshort
6/3 Gold Analysis and Trading SignalsGood morning, everyone!
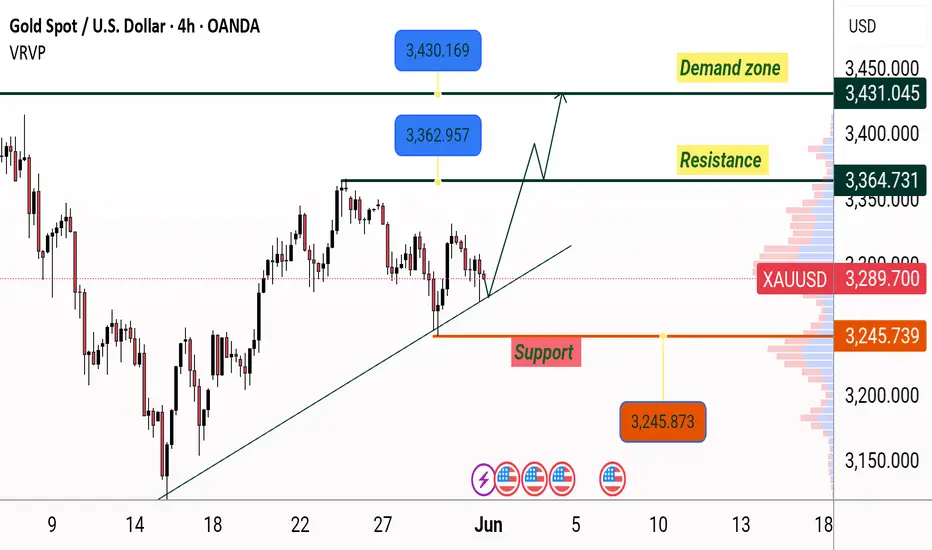
Gold climbed to the 3370 area yesterday without showing any significant pullback, indicating that bullish momentum remains intact. After this morning’s opening, the price continued to rise, and from a technical perspective, there’s still room for further upside. The 3400 level is likely to be tested today, and if accompanied by increased volume, gold may extend gains towards the 3416–3438 resistance zone.
From a tactical standpoint, a technical retracement after today’s rally is the base case scenario, and intraday trades can be structured within the broader 3440–3320 range. On the downside, the 3368 level is the first key support to watch, followed by 3352, which could serve as a pivot area if a pullback occurs.
On the macro front, two economic data releases are scheduled during the US session, along with a Q&A session involving Fed’s Goolsbee, which could inject short-term volatility into the market.
📌 Trade Plan for Today:
Sell within the 3416–3438 zone, with controlled position sizing; short-term strategy preferred.
Buy near the 3338–3321 support area, with a defensive setup and tight risk control.
Flexible trading levels to monitor: 3421 / 3413 / 3397 / 3386 / 3367 / 3358 / 3343
Strategy outlook: Adopt a “sell high, buy dips” short-term strategy today. Avoid chasing breakouts blindly; focus on rhythm and structure.

The latest trend analysis and operation layout of Europeanmarket📰 Impact of news:
1. Speech by the Federal Reserve during the US trading session
2. Geopolitical and tariff issues
📈 Market analysis:
Recently, the escalation of the Russia-Ukraine conflict and global trade tensions has pushed international gold prices to rise strongly. Although Russia and Ukraine reached a consensus on prisoner exchange in the second round of negotiations on Monday, the ceasefire agreement remained deadlocked. Coupled with the US announcement of additional steel tariffs, geopolitical risks and economic uncertainties stimulated risk aversion sentiment.
From a technical perspective, the upward trend of gold since 3120 is clear. After breaking through 3340 on Monday, it accelerated to test the 61.8% Fibonacci resistance level of 3396, but the pressure at the 3400 integer mark is significant. At the same time, 3330 below is still the current key support level. The current decline in gold prices is more like a technical correction to yesterday's rise. Yesterday, we reminded everyone to pay attention to the 3355 level. The intraday operation suggestion for the European session is 3355-3345. You can try to go long and look at the 3370-3380 line. If it breaks through effectively, it will test the 3396 or even 3400 line; if it fails to break through the upper resistance, it will fall into a range of fluctuations.
🏅 Trading strategies:
BUY 3355-3345
TP 3370-3380-3390
SELL 3370-3380
TP 3350-3340-3330
If you agree with this view, or have a better idea, please leave a message in the comment area. I look forward to hearing different voices.
OANDA:XAUUSD FX:XAUUSD FOREXCOM:XAUUSD FXOPEN:XAUUSD TVC:GOLD
Under pressure in the short term, short gold after rebound!In the short term, gold has risen sharply under the simultaneous stimulation of tariffs and geopolitical conflicts, but it has gradually fallen back after reaching around 3392, and has not broken through the 3400 mark in one fell swoop, indicating that the bullish momentum does not have the potential to continue to rise for the time being, so it may still need a certain degree of technical support, so gold has a need to retrace in the short term;
In addition, if gold continues to retrace, then there may be a structural form at the technical level that offsets the short-term double bottom structure support, so gold may also form a double top structure in the short term. The first thing we need to pay attention to is the resistance near 3370, followed by the resistance near 3390; and below we must first pay attention to the support near 3345, followed by the 3330-3320 support area.
Trading strategy:
1. Consider continuing to short gold in the 3370-3380 area, TP: 3355-3345;
2. If gold first retreats to the 3345-3335 area and does not fall below this area, consider going long on gold; TP: 3360-3370
XAUUSD A few hours ago, the gold trade I shared closed with a profit. Congratulations to everyone who took advantage of it. We've now seen a slight pullback, and I'm seizing the opportunity by opening another sell trade on XAUUSD — here are the details for those interested:
🔍 Trade Details:
✔️ Timeframe: 15-Minute
✔️ Risk-to-Reward Ratio: 1:1.50
✔️ Trade Direction: Sell
✔️ Entry Price: 3348.32
✔️ Take Profit: 3339.69
✔️ Stop Loss: 3354.06
🔔 Disclaimer: This is not financial advice. I’m simply sharing a trade I’ve taken based on my personal trading system, strictly for educational and illustrative purposes.
📌 Interested in a systematic, data-driven trading approach?
💡 Follow the page and turn on notifications to stay updated on future trade setups and advanced market insights.

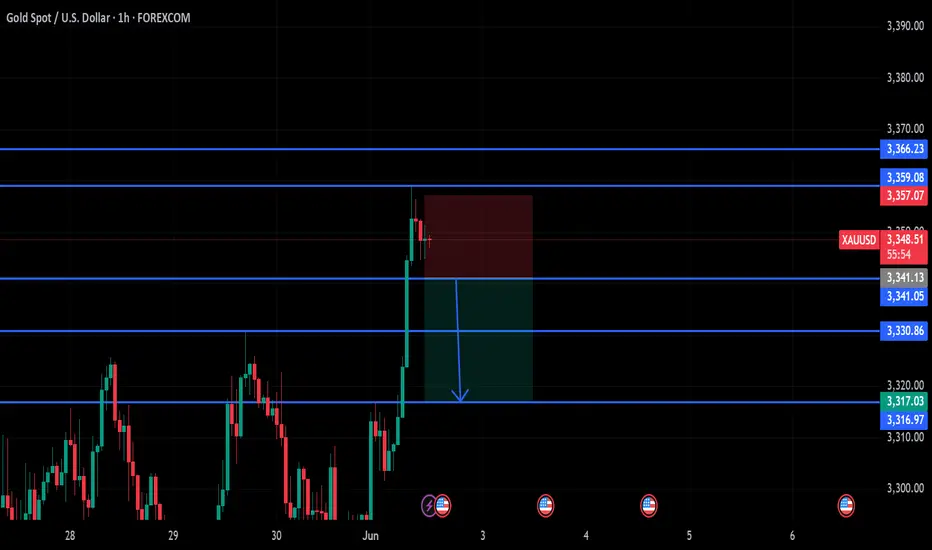
XAUUSDHello traders,
There’s a potential trading opportunity on XAUUSD. I’ve already activated the trade on my end and I’m sharing the target zone with you as well.
🔍 Trade Details:
✔️ Timeframe: 15-Minute
✔️ Risk-to-Reward Ratio: 1:1.50
✔️ Trade Direction: Sell
✔️ Entry Price: 3361.17
✔️ Take Profit: 3351.45
✔️ Stop Loss: 3367.64
🔔 Disclaimer: This is not financial advice. I’m simply sharing a trade I’ve taken based on my personal trading system, strictly for educational and illustrative purposes.
📌 Interested in a systematic, data-driven trading approach?
💡 Follow the page and turn on notifications to stay updated on future trade setups and advanced market insights.

XAUUSD Analysis todayHello traders, this is a complete multiple timeframe analysis of this pair. We see could find significant trading opportunities as per analysis upon price action confirmation we may take this trade. Smash the like button if you find value in this analysis and drop a comment if you have any questions or let me know which pair to cover in my next analysis.

Evening gold analysis and trading point layout📰 Impact of news:
1. Fed's Goolsbee: Despite the unresolved tariff issue, it is still believed that interest rates are expected to fall in the next 12 to 18 months
2. May PMI data is positive
3. Russian media: Russia lists the full withdrawal of Ukrainian troops from Russian territory as one of the ceasefire options
📈 Market analysis:
Judging from the 4H chart, gold is currently fluctuating around the 3370 line, and the bulls are still relatively strong. We should pay attention to the short-term support at 3365-3355 below, and the short-term suppression at 3385-3395 above. If it breaks through the upper suppression, we will pay attention to the 3400 line suppression position. The recent market fluctuations have been relatively large, so bros must set take-profit and stop-loss when trading independently!
🏅 Trading strategies:
BUY 3365-3355
TP 3370-3380-3400
If you agree with this view, or have a better idea, please leave a message in the comment area. I look forward to hearing different voices.
TVC:GOLD FXOPEN:XAUUSD FOREXCOM:XAUUSD FX:XAUUSD OANDA:XAUUSD

XAUUSD/Gold on 3rd May 2025As yesterday I posted that golds is in major uptrend and it is still active. On daily timeframe gold made breakout upward direction of channel and 3382. As I said gold made gap wile opening on Monday so it was strongly bullish, now we want it to fill the gap. And did it is first rejection and coming down. No gold is trading at 3360-65 range, and it is support, soon if it get's break toward downward then price can surge to 3323-3330. Waiting for confirmation and then execute trade.
Key point.
Support - 3364, 3330, 3313
Resistance - 3386, 3400, 3414
If you like it do follow and share.
Any Query Reach Us or comment down.
Follow for more updates.
Rudra Vasaikar Wishes You A Great And Very Amazing Trading Life. Trade Safe, Trade Right.
RISK WARNING 🔴 🔴 🔴
There is high risk of loss in Trading Forex, Crypto, Indices, CFDs, Features and Stocks. Choose your trade wisely and confidently, please see if such trading is appropriate for you or not. Past performance is not indicative of future results. Highly recommended - Information provided by Pro Trading Point are for Educational purpose only. Do your investment according to your own risk. Any type of loss is not our responsibility.
HAPPY TRADING.
#gold #xauusd #xauusdtrading #goldtrading #goldanalysis #forextrading #forex #trendline #goldsignals #goldnews goldlatestanalysis #xauusdtradesetup #forextradingguide #fxgold

Gold Reclaims 3300, Faces Heavy Resistance AheadGold surged after Monday’s market open, reclaiming the 3300 level, and has already made an initial attempt at the 3306–3312 resistance area, where the 2H MA60 lies. Short-term indicators have started to turn bullish, but several resistance levels lie ahead:
3306–3312: First major resistance
3326–3332: Next target resistance area
Around 3357: Previous gap zone, strong pressure
The upside is full of obstacles, and bulls will need strong momentum to push through.
Also, keep in mind:
Rapid upward moves are often followed by pullbacks. If the price retraces, pay attention to:
Support at 3288–3276
If this zone holds, further upside is likely
Watch for support/resistance role reversals:
A resistance level becomes support once broken
A support level becomes resistance once it breaks
Valid breakouts are confirmed when price stays above/below without immediate reversal
This is one of the most reliable and practical trading principles.
📉 Medium-Term Trend Still Bearish
The broader trend is still in a downward correction. Stay cautious and disciplined with short-term bullish moves.
📅 This week is loaded with key macroeconomic events, including:
PMI Manufacturing
ADP Employment
Non-Farm Payrolls (NFP)
Unemployment Rate
Fed-related speeches and economic commentary
Expect high volatility — great for profits if executed well, but dangerous if misjudged. Opportunities come with risks, so manage them wisely.

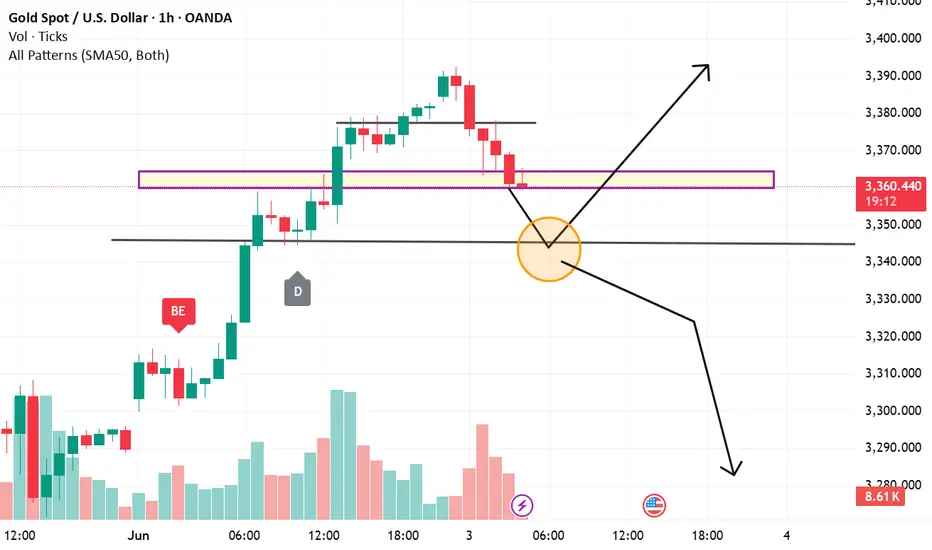
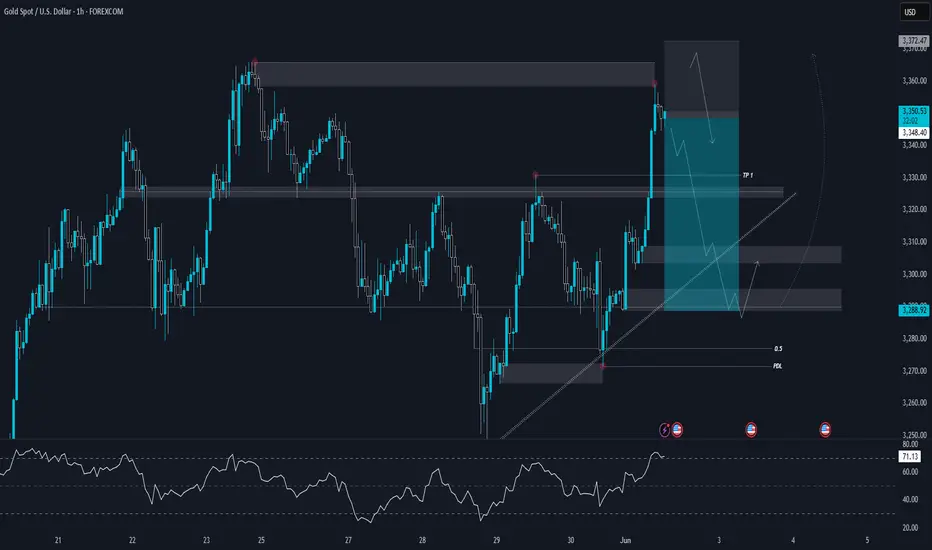
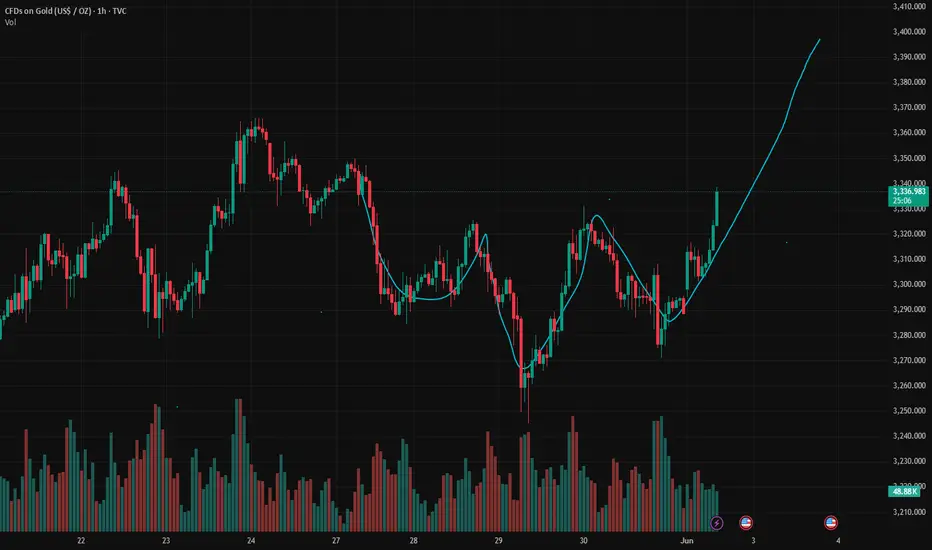
XAUUSD TechnicalsThe chart presents a pivotal moment in Gold (XAU/USD) on the 1-hour timeframe, as price reacts to a key structural zone. After a strong impulsive bullish move earlier in the session, price rallied sharply toward the $3,370–$3,385 range. But now, a visible retracement has pulled it back into a well-defined support zone that previously acted as resistance.
At this moment, the market is at an inflection point — visually represented by the orange confluence circle, where the current price intersects a previous consolidation breakout level and sits right above a deeper support band.
What's happening technically?
Price is now retesting the purple support box, which overlaps closely with the base of the bullish breakout that occurred earlier. This is significant because it could function either as:
Support confirmation: where the market "respects" the previous breakout zone, establishing it as a new demand area and thus signaling the continuation of the uptrend.
Fakeout zone: where the price loses this level, indicating that the prior bullish impulse was unsustainable, setting up for a deeper correction — possibly down toward the $3,335 or even $3,310 regions.
The small candle forming at the support zone shows slowing bearish momentum, which could be interpreted as the first signs of stabilization. But the volume tells us more — earlier bullish momentum came with strong volume spikes, while the recent pullback seems to be on declining volume, which can often indicate profit-taking rather than full-blown reversal pressure.
Interpreting the two potential paths:
If price holds above the purple zone and shows bullish candle confirmation (like a bullish engulfing or a strong pin bar), there's a good probability that gold will resume its bullish leg, potentially retesting $3,385 and stretching further to $3,400+.
However, if price decisively breaks below the orange confluence zone (especially below $3,350 with a large bearish candle and volume spike), then bears could regain control and drive it toward $3,320 or even lower. In this case, the earlier rally would appear as an exhaustion move or news-driven spike.
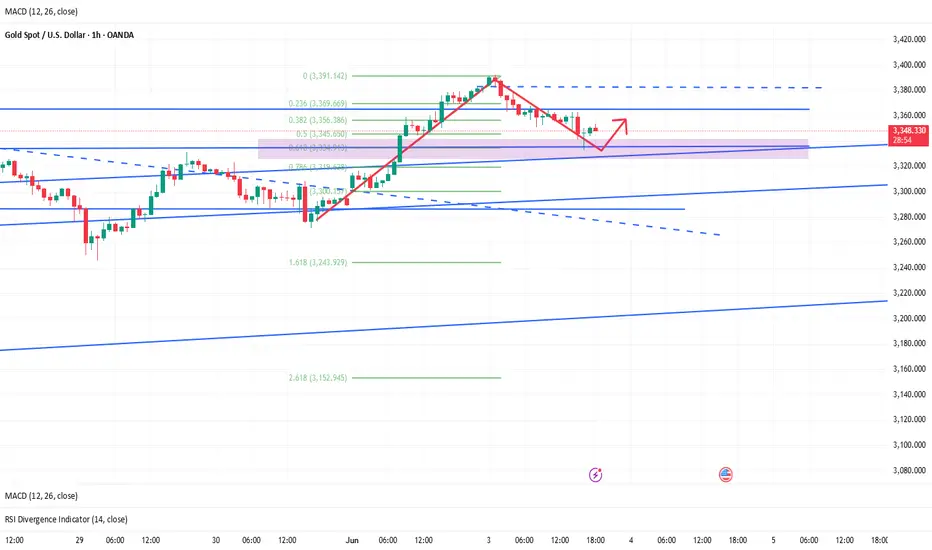
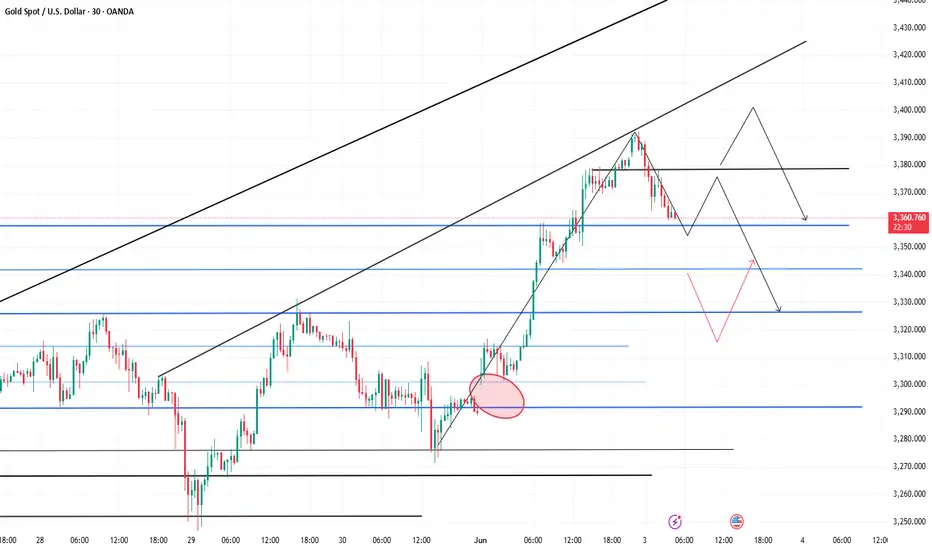
Gold: Two Clear Trading OpportunitiesGold surged to around 3390 after today’s open, but has since started to pull back. The current price is nearing the 30M chart MA60 support zone (around 3352), where a minor rebound may occur.
🔍 Short-Term Focus:
Resistance to watch: MA10 area at 3369–3378
Trading bias: Primarily short from higher levels
🌐 Main Considerations:
There's a large gap left open between 3289–3300, which poses a hidden downside risk.
Resistance remains dense above 3400, and the rally left behind potential to form a double top (M shape) or head-and-shoulders pattern.
Be cautious of bull traps and manage your positions wisely.
📌 Clear Trade Opportunities:
✅ Short above 3400
✅ Look for long entries below 3320
The current structure offers identifiable opportunities. Stay disciplined, manage your risk, and trade with confidence.
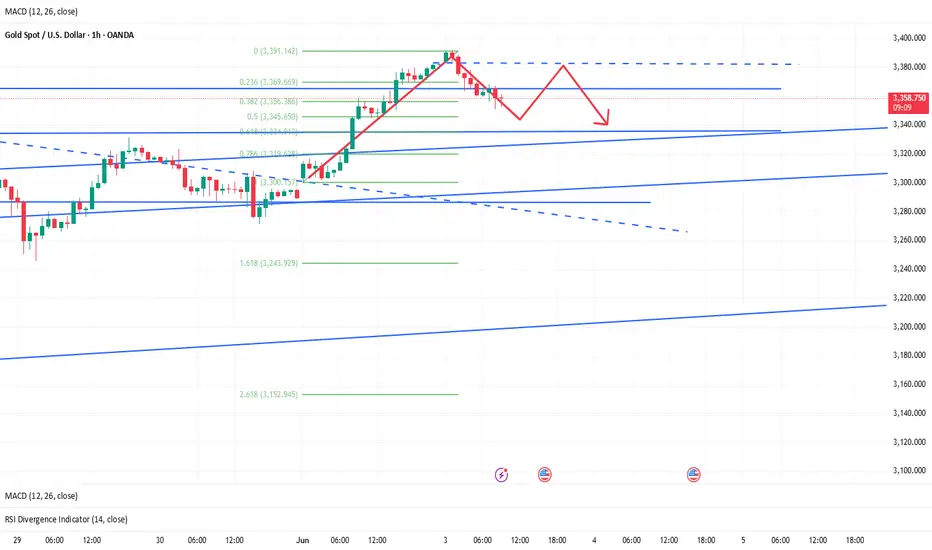
Keep gold shorts open and look forward to profits!After breaking through the resistance areas near 3335 and 3355, gold continued to rise to around 3379; although the rise in gold was relatively large, after gold touched above 3370, the bullish momentum weakened and there were signs of high-level stagflation, so gold is still expected to usher in a wave of retracement in the short term.
After the sharp rise in gold, the current relatively obvious support area is located in the 3345-3335 area. If gold cannot effectively break through 3380, then gold is expected to retrace to test the support of the 3345-3335 area again.
As the trading strategy shared in my previous opinion, I have shorted gold in batches in the 3370-3380 area as planned. At present, we still hold short positions. Let us look forward to the expected retracement of gold!
CAPITALCOM:GOLD OANDA:XAUUSD FOREXCOM:XAUUSD TVC:DXY
Gold:Take a short position
Gold: hourly level to see the top, technical form has the trend of adjustment, short - term can be considered short.
Trading Strategy:
sell@3370-75
tp1:3360
tp2:3345-40
↓↓↓ More detailed strategies and trading will be notified here ↗↗↗
↓↓↓ Keep updated, come to "get" ↗↗↗
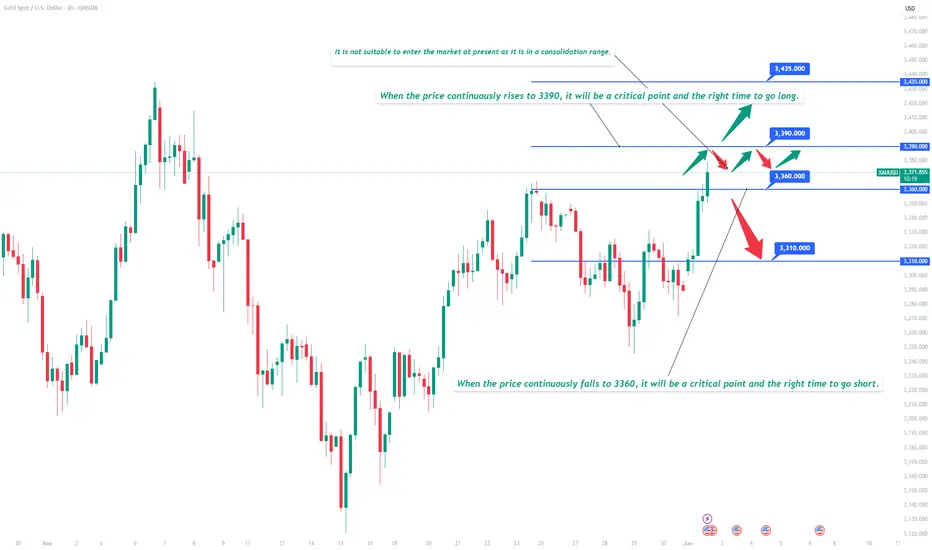
Gold stumbles at 3379 resistance! Bull-bear eyes 3360-3390 zone I. Resistance and Support Levels
Resistance 🚧: The intraday high of 3379 acts as initial resistance, with strong resistance in the 3390-3400 zone 🏔️.
Support 🛡️: Initial support is at 3360-3365, while strong support lies in the 3325-3330 range 📉.
II. Trading Strategies
(1) Aggressive Long Position 🚀
Entry 📊: Lightly initiate long positions when the price pulls back to the 3365-3368 zone and stabilizes (e.g., bullish candlestick patterns appear 🔥).
Stop Loss ⛔: Exit if the price breaks below 3360.
Targets 🎯: First target at 3390; if breached, aim for 3435* (Note: "34350" in the original text is likely a typo—adjust based on actual market conditions ⚠️).
(2) Conservative Long Position 📈
Entry ⏳: Enter long after the price validly breaks above 3379 and retests support at the 3390-3395 zone 🔄.
Stop Loss ⚠️: Exit if the price falls below 3375.
Targets 🎯: Same as the aggressive long strategy 📍.
(3) Short Position 📉
Entry 📊: Lightly initiate short positions if the price rejects resistance in the 3380-3385 zone (e.g., bearish candlestick patterns form 📉) or fails to break above 3390 and drops below 3375 ⬇️.
Stop Loss ⛔: Exit if the price breaks above 3388.
Targets 🎯: First target at 3360; if breached, aim for 3330 🏁.
Professional trading strategies are pushed daily 📊
Lock in precise signals amid market fluctuations 🚀
Confused about market trends? Stuck in strategy bottlenecks?
Real-time strategies serve as your "trading compass" 🌐
From trend analysis to entry/exit points, dissect market logic comprehensively
Refer now 📲
Help you move steadily forward in investments ✨
👇👇👇
Don't chase long positions easily during high-level adjustments📰 Impact of news:
1. The conflict between Russia and Ukraine breaks out again, exacerbating the uncertainty of the situation
2. The tension in the Middle East continues, Iran claims to be ready to defend its airspace at any time, and the Houthi armed forces attack Israeli airports
3. May PMI data released
📈 Market analysis:
In the short term, the double high points above the gold price are suppressed at the 3365 line. The MACD indicators at the 4H and daily levels tend to form a golden cross, releasing bullish signals. In the short term, if you want to confirm a unilateral upward trend, you need to break through the 3365 line. Despite the strong bullish signals, as I just reminded you, the current technical indicators are close to overbought areas, and I still think there is a certain risk of a correction. In the European session, I will consider trying to short at the 3355-3365 line, and pay attention to the short-term support at 3340-3330 line below. Later, after the price gets some support at the support level, we can consider long trades.
🏅 Trading strategies:
SELL 3355-3365
TP 3340-3330-3320
If you agree with this view, or have a better idea, please leave a message in the comment area. I look forward to hearing different voices.
OANDA:XAUUSD FX:XAUUSD FOREXCOM:XAUUSD FXOPEN:XAUUSD TVC:GOLD

6/2 Gold Analysis and Trading SignalsGood evening, traders!
Gold surged more than $70 today, reaching an intraday high of 3363.
If you held short positions from last Friday’s close based on my plan, I hope your SL protected you from major losses.
📉 Technical Insight:
The rapid rally has triggered overbought signals and correction pressure
Watch for pullback support levels at:
3342
3328–3321 zone
If these hold, price might retest 3400 tomorrow
🎯 Trading Plan:
📉 Sell around 3360–3372 (with tight stop)
📈 Buy near 3328–3318 (if price stabilizes)
🔁 Scalp zones:
3332 / 3338 / 3343 / 3352 / 3366
gold on sell retrace#XAUUSD price have been bullish since tension increases, now price is trying to correct before any further movement.
Firstly we await price to fall below 3341 to sell, Target 3331-3317. Stop loss 3357
Any further breakout above the 3366 will form a strong bullish which will reach 3390-3420
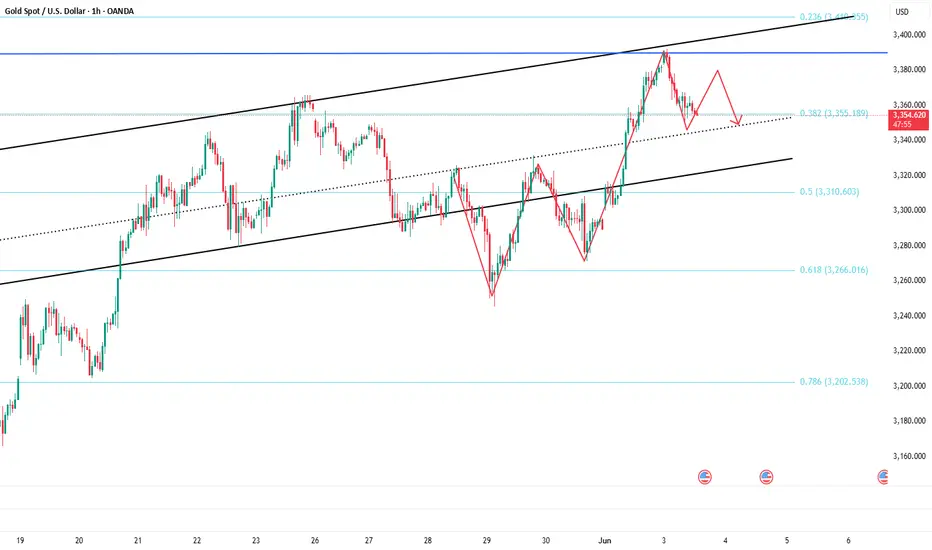
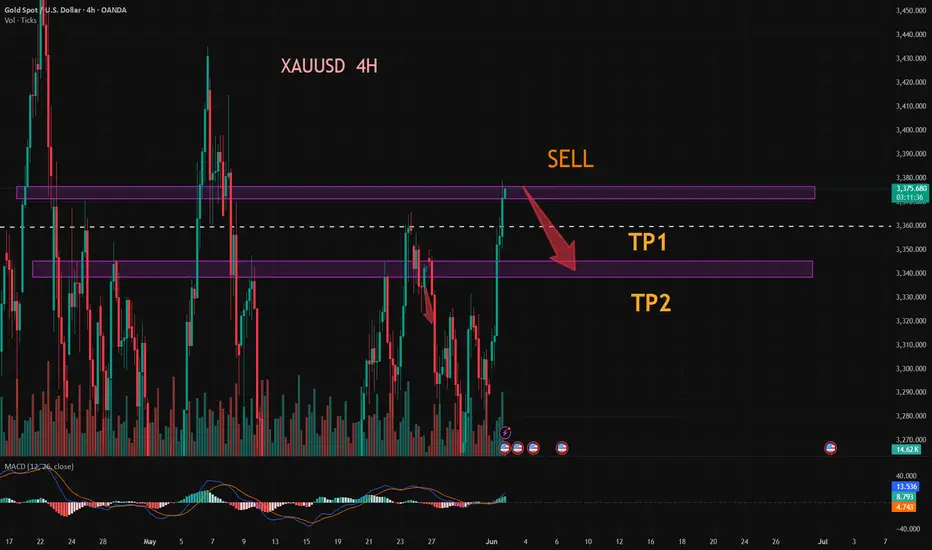
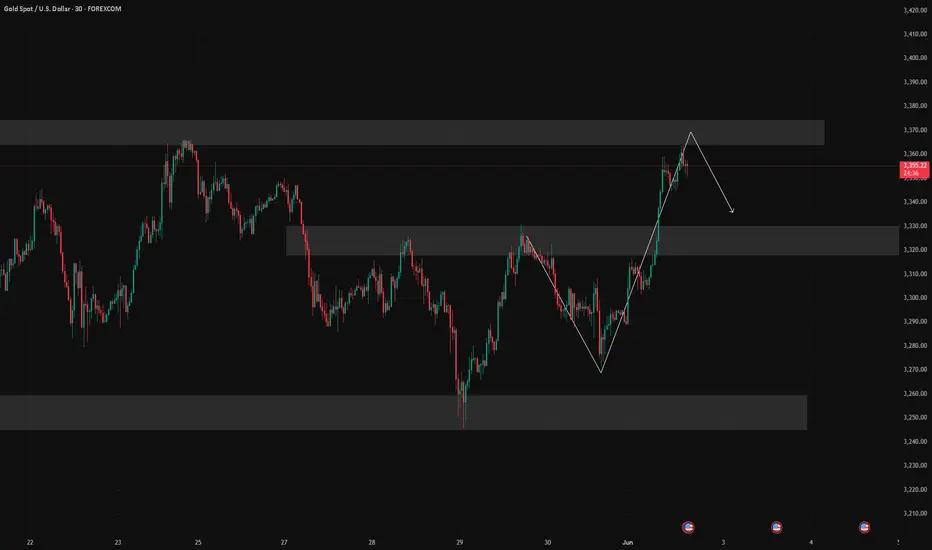
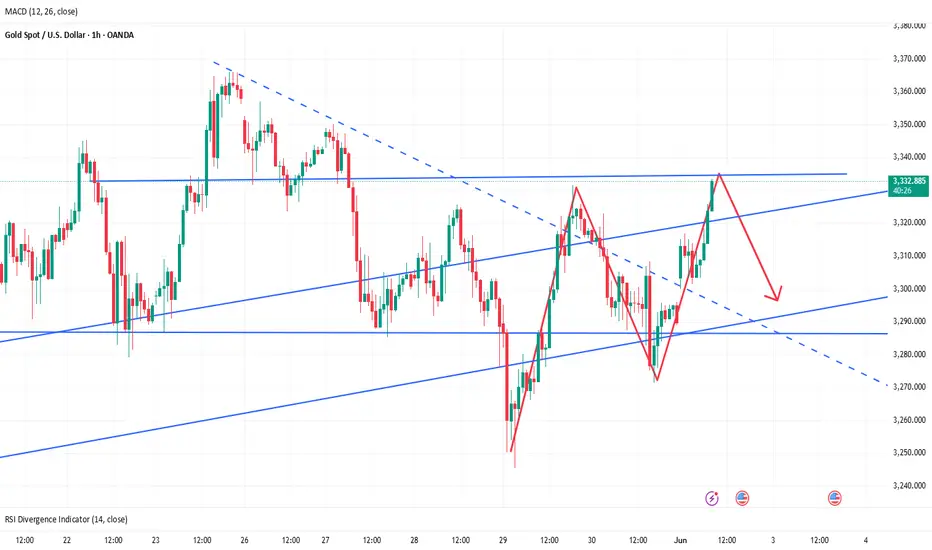
XAUUSD | 1h BearishGold (XAUUSD) 1H Analysis
Currently, gold is showing signs of a potential bearish reversal from a key supply zone. Price tapped into the previous high and reacted with strong rejection, suggesting weakening bullish momentum. This area aligns with a clear zone of interest, where sellers previously stepped in, adding confluence to our bearish bias.
The structure has been respected so far, and price has now broken below the minor trendline support, which previously acted as dynamic support for this bullish leg. A pullback to retest this broken structure or the imbalance zone just above could provide an optimal entry for further downside.
The trade idea is built on a potential shift in market structure:
A double top internal structure formation is visible at the recent high, indicating exhaustion in the uptrend.
Price is expected to push lower, targeting TP1, which sits at the previous strong support zone and aligns with the internal structure break.
Further continuation to the downside could take price toward the 0.5 FIB retracement level and PDL (Previous Day Low)—both strong liquidity areas.
We are anticipating a reaction from these lower zones. If bullish momentum reappears there, it may offer a chance to reposition for long setups later. For now, the bias remains bearish while price holds below the supply zone and structure confirms.
Gold 1D timeframe. What Next Moment?Hello everyone, I am back after 3 years. Finally I have decided to continue my trade journey in forex and crypto professionally.
Here is the analysis of XAUUSD/Gold.
Gold has taken a big bold moment of Uptrend since strong resistance breakout on march of 1st, 2024. Since that time Gold didn't looked back & continued it's rally in uptrend. So our major trend is Uptrend in 1D and 4H timeframe. Gold did some downtrend and sideway rally and again took another uptrend rally on Dec of 18th, 2024. Gold break all top high and made new high 3500.
If I talk in 1D timeframe gold is trading in bullish flag, and I am not wishing it right now to break upward. But has you know it is gold anything can happen. While today is Monday and market opening was in gap. So it needs to fill the gap after that we can execute a trade. Still now needs some confirmation that it will come down. So have patience and watch the market carefully.
Key point.
Resistance - 3356, 3369, 3396
Support - 3343, 3323, 3304
Any Query Reach Us or comment down
Rudra Vasaikar Wishes You A Great And Very Amazing Trading Life. Trade Safe, Trade Right.
RISK WARNING 🔴 🔴 🔴
There is high risk of loss in Trading Forex, Crypto, Indices, CFDs, Features and Stocks. Choose your trade wisely and confidently, please see if such trading is appropriate for you or not. Past performance is not indicative of future results. Highly recommended - Information provided by Pro Trading Point are for Educational purpose only. Do your investment according to your own risk. Any type of loss is not our responsibility.
HAPPY TRADING.
#gold #xauusd #xauusdtrading #goldtrading #goldanalysis #forextrading #forex #trendline #goldsignals #goldnews goldlatestanalysis #xauusdtradesetup #forextradingguide #fxgold

XAUUSD:BUYAfter the good news came out. XAUUSD followed my expectations. Continued to rise above 3300. The current quotation is 3317.
The tariff issue was released again over the weekend. Inflation fermented again, and the Russian-Ukrainian negotiations reached a tense and uncertain stage again.
Traders who followed me to buy near 3290 successfully made good profits.
Trading reference
XAUUSD:
Pressure position: 3360-3350
Support position: 3305-3295
BTCUSD:
Pressure position: 107000-106000
Support position: 103000-102000
This week, there is the impact of the release of non-agricultural data.
Usually divided into the front, middle, and back end of the triple impact. For traders, every time is a good trading opportunity. The impact is also very large.
This week, we will focus on the impact of news and the stimulation of news to layout the wonderful transactions of XAUUSD and BTCUSD. Remember not to trade independently to avoid losses. If you have any ideas, remember to leave a message to me and my assistant.
Is the positive news fading? The latest analysis of gold📰 Impact of news:
1. The conflict between Russia and Ukraine breaks out again, exacerbating the uncertainty of the situation
2. The tension in the Middle East continues, Iran claims to be ready to defend its airspace at any time, and the Houthi armed forces attack Israeli airports
3. May PMI data released
📈 Market analysis:
As geopolitical conflicts between Russia and Ukraine and the Middle East broke out again over the weekend, gold jumped higher today. From a technical perspective, the 1H chart shows a bullish arrangement, but the gold price is in a downward channel at the daily level. The gold price is currently near the middle track of the Bollinger Band and is obviously suppressed by the downward channel. The 4H level Bollinger Bands narrowed, the moving averages adhered, the long and short positions were in a stalemate, and the MACD indicator hovered around the 0 axis. 3330 - 3335 above is the key resistance area. If it breaks through 3340, it is expected to continue to see new highs. At the same time, there is short-term support in the 3285-3280 range below. 3270 - 3265 becomes the key important support. If it falls below, it may fall to 3245. For short-term operations in the Asian and European sessions today, if the resistance area of 3325-3335 cannot be effectively broken through, you can consider shorting and look towards 3310-3290 in the short term.
🏅 Trading strategies:
SELL 3325-3335
TP 3310-3290
If you agree with this view, or have a better idea, please leave a message in the comment area. I look forward to hearing different voices.
TVC:GOLD FXOPEN:XAUUSD FOREXCOM:XAUUSD FX:XAUUSD OANDA:XAUUSD
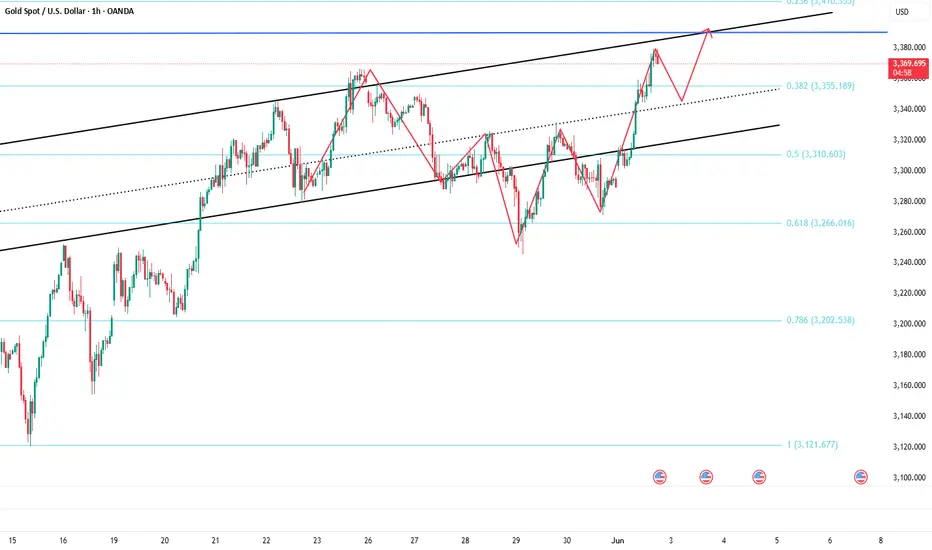
Here's a weekly buy-side analysis🟢 Bias: Bullish (Buy)
Gold remains in a long-term uptrend, with fundamental and technical factors supporting continued upside.
50 & 100 EMA: Price is well above both EMAs, confirming bullish momentum.
RSI: Around 60–70 on the weekly; no bearish divergence yet.
MACD: Histogram ticking upward with bullish crossover in play.⚠️ Risk Factors
Sudden USD strength due to surprise Fed hawkishness.
Strong U.S. labor or inflation data that pushes bond yields higher.
Gold profit-taking near ATH could cause sharp but temporary pullbacks.