XAUUSD[GOLD]; Is it the beginning of the major correction? XAUUSD dropped from 3265$ to 3127$, as predicted in our previous analysis. However, after touching 3127$, the price has retraced slightly and is currently trading at 3178$. In our opinion, the price can go up to $3220 maximum and reject at that level. We need to wait and see how prices behave. Another possible entry point is at 3178$, which is the current trading price. We believe this region is good for selling because the price has struggled to break through it. Please use a proper trading plan while trading gold.
As always, this analysis doesn’t guarantee that price will move as described in the chart. Please use your own knowledge and trading plan while trading gold. Good luck and trade safely.
Want to support us? Do the following ❤️
-LIKE THE IDEA
-COMMENT YOUR VIEW
-SHARE IF YOU AGREE
Much love ❤️
Team Setupsfx_
Xauusdshort

Gold still has room to fall and rebounds to continue to shortGold fell as expected in the Asian session, which was in line with our thinking and expectations. Our short position was shorted near 3237-38 and exited with profit, and then shorted near 3194 and exited with profit again, and we made good profits both times. There are many people who followed the trend and went long in today's market, or even chased the long position, and without exception, they were trapped and wailing. We have repeatedly emphasized that we should treat it with a sweeping approach, and different market rhythms should be responded to with different methods. Judging from the current market trend, the European session continues to weaken. The focus should be on the gains and losses of 3180 support. If it breaks through, it will continue to look at 3150 and 3120. In this case, the short-term will return to weakness. If it does not break, we will look at a wide sweeping range. The upper pressure will focus on 3200, 3215, and 3230. The rebound will be mainly high. The weekly line will be closed tonight, and volatility will intensify.
Gold Free fall to 3080/3050 ?Gold just broke the channel.
I expect a rapid decline the following hours to 3080 and if that breaks, 3050
Gold Sell to 3080? Gold just broke the channel.
There is a potential bearish move to 3080 and if that breaks, 3050
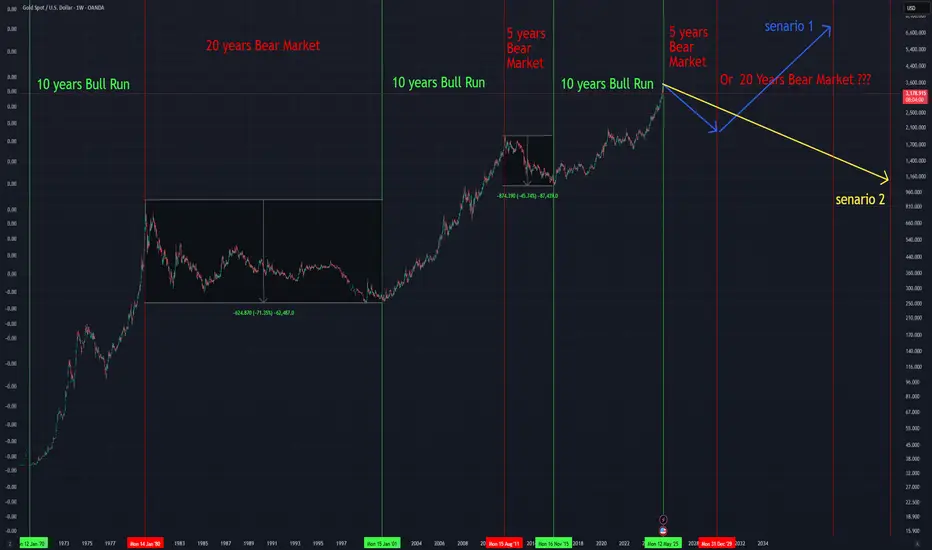
Technical & Historical Key TakeawaysThis chart analyzes the historical price cycles of Gold (XAU/USD) over the past decades, focusing on the alternation between long bull runs and prolonged bear markets.
You highlighted clear phases:
1970 - 1980: 10-year Bull Run
Massive price rally, followed by a sharp correction.
1980 - 2001: 20-year Bear Market
Prolonged sideways and downward movement.
2001 - 2011: 10-year Bull Run
Strong upward trend, reaching new all-time highs.
2011 - 2016: 5-year Bear Market
Significant correction but shorter in duration.
2016 - 2025: 10-year Bull Run
Another strong bullish phase, possibly ending in May 2025.
🔮 Scenarios projected:
Scenario 1 (Blue path):
A shorter bear market (5 years) similar to 2011-2016 correction, then continuation of the long-term uptrend.
Scenario 2 (Yellow path):
Gold enters a long-term 20-year bear market, similar to what happened post-1980.
You are asking if Gold is now entering a short bear phase (Scenario 1) or will fall into a multi-decade bear market (Scenario 2).
Cyclicality of Gold:
Gold has shown repetitive cycles of 10-year bull runs followed by either short (5-year) or long (20-year) bear markets.
These cycles seem to reflect macroeconomic shifts (inflation, interest rates, global crises).
Current Cycle (2016 - 2025):
If we respect the pattern, May 2025 might mark the end of the current bull cycle, opening the door to a corrective phase.
Scenario 1 favors a soft correction:
Based on the last cycle (2011-2016), a 5-year bear market might occur.
This would keep the long-term bullish trend alive, especially if macroeconomic conditions stay inflationary or geopolitical risks remain high.
Scenario 2 warns of a harsh bear market:
If history repeats the 1980-2001 phase, gold could enter a multi-decade bear market, driven by reduced inflation fears, strong dollar cycles, or financial system stability.
Key Indicators to watch:
Real interest rates.
USD strength vs global currencies.
Demand from central banks and emerging markets.
Geopolitical tensions and inflation expectations.
Long orders are trapped,what should we do with the US gold marke🗞News side:
1. India considers using new Indus River project to cut water supply to Pakistan.
2. Pay attention to the news of Russia-Ukraine ceasefire negotiations today
📈Technical aspects:
Gold once fell to around 3170, which is in line with our judgment of bullish weakness. This is why we are not in a hurry to participate in long orders today. I know that many bros also listened to the outside world and went long around 3200, which led to being trapped. At present, the gold price is constantly testing the 3170 support line. If it falls below, it will look to the 3150 support line. If it does not break, it will be treated as a shock. On the top, temporarily pay attention to the 3205-3215 line of resistance. If it encounters resistance and pressure, go short. On the bottom, first pay attention to the 3170 support line, and then pay attention to the 3150-3140 support line. Hold if it breaks.
If you agree with this view, or have a better idea, please leave a message in the comment area. I look forward to hearing different voices.
OANDA:XAUUSD FX:XAUUSD TVC:GOLD FXOPEN:XAUUSD FOREXCOM:XAUUSD

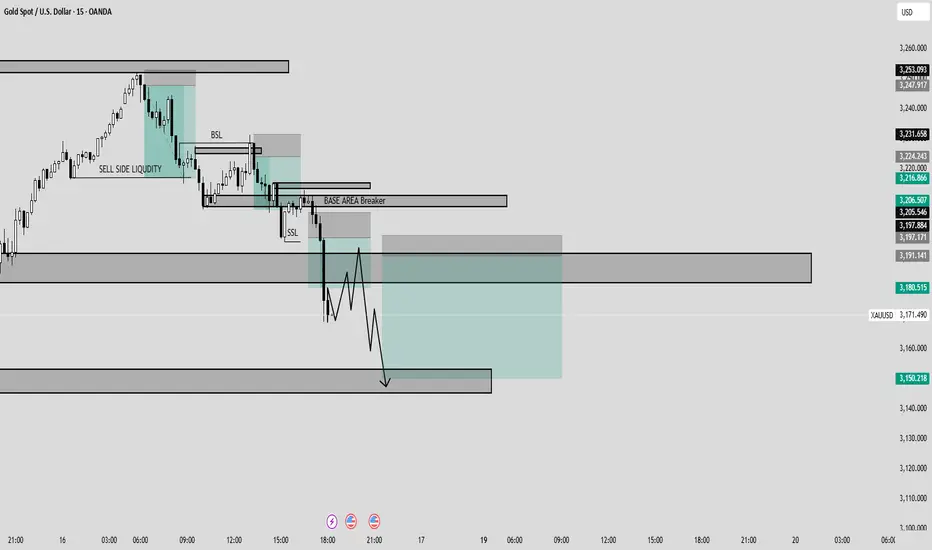
XAUUSD Intraday Swing Friday Timeframe: 15-Minute (M15)
📉 Current Price: Around 3,173.805 USD
📌 Key Zones & Structure on the Chart:
1. Order Block (OB)
Located at the top (around 3,253 – 3,231).
This is a strong supply zone that triggered a sharp sell-off.
Price previously grabbed liquidity before sharply rejecting from this zone.
2. Sell-Side Liquidity (SSL) & Buy-Side Liquidity (BSL)
SSL: Taken out → strong indication that smart money is pushing price lower.
BSL: Also taken before the drop → confirming a false breakout and reversal to the downside.
3. Breaker + Base Area
Breaker block has been tested but failed to push price higher.
This confirms the area has flipped from support to resistance (bearish flip zone).
4. Bearish Target
Projected drop toward the next demand zone around 3,150 – 3,145 (lower gray box).
Marked by the arrow pointing down, indicating potential bearish continuation.
📊 Price Structure:
Trend: Bearish (Lower Highs – Lower Lows forming)
Strong rejection from breaker area → confirms bearish bias.
Current price is performing a minor pullback and is expected to continue dropping toward the demand zone.
✅ Summary of Analysis:
Bias: Bearish
Potential Entry: After a pullback into supply or breaker area (3,180 – 3,191)
Target: 3,150 – 3,145 (major demand zone)
Additional Confirmation: Watch for price rejection during pullback + rising volume during support break.
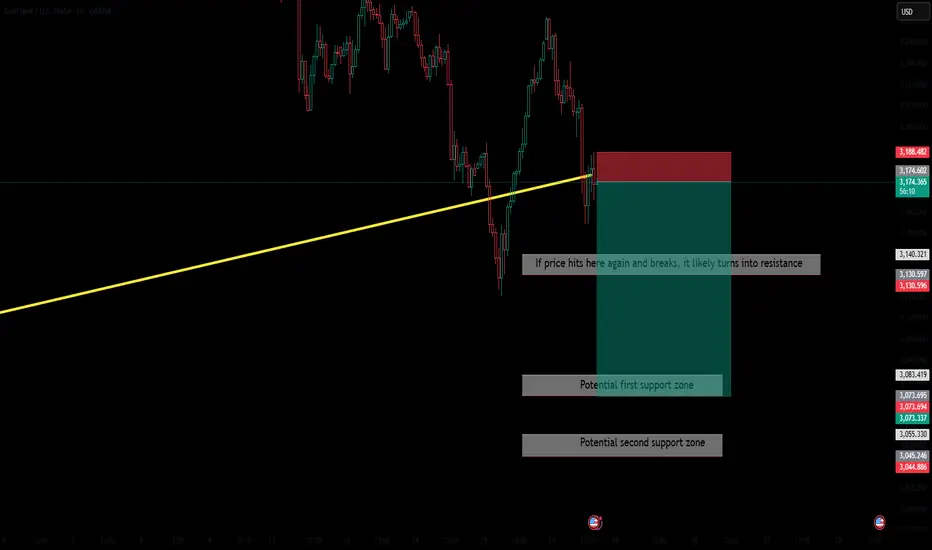
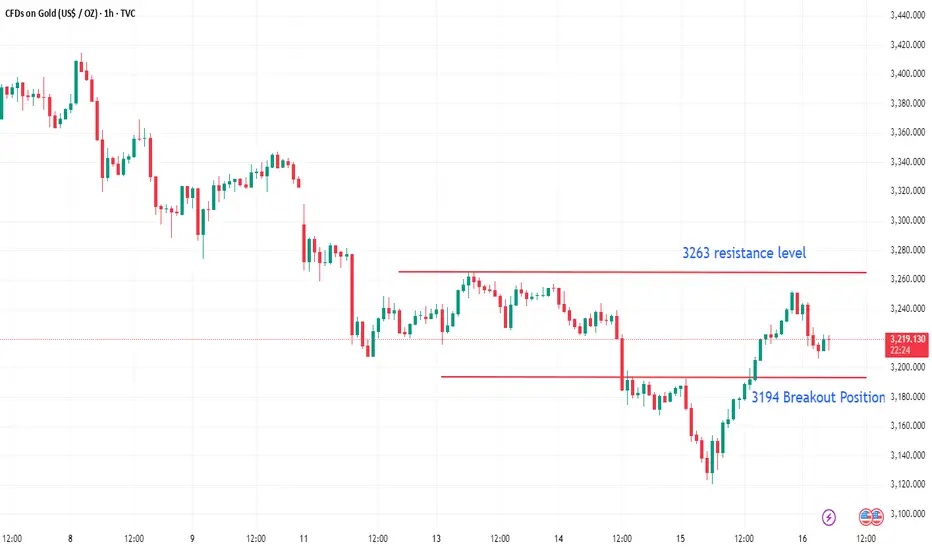
GOLD Update – Short Opportunity After Pullback! Gold traders! 💛 Our key support zone (3,212 - 3,196) has just been broken, and price is now consolidating below! 🎯
We previously took big profits from this level (our followers know!), and now we’re waiting for a pullback to enter a high-probability short trade!
⚡️ Golden Rule:
✅ If price retests the level as new resistance, go SHORT!
✅ If it reverses and breaks back above, consider a LONG!
📌 Always trade with a strategy—be ready for any scenario!
💸 The Secret to Trading Success:
🔹 Keep losses small & controlled.
🔹 Let profits run & grow!
🔹 We can’t control the market, but we CAN control our risk!
🚀 Gold is always hot—what’s your take?
👇 What’s your analysis on this move?
For detailed entry points, trade management, and high-probability setups, follow the channel:
ForexCSP

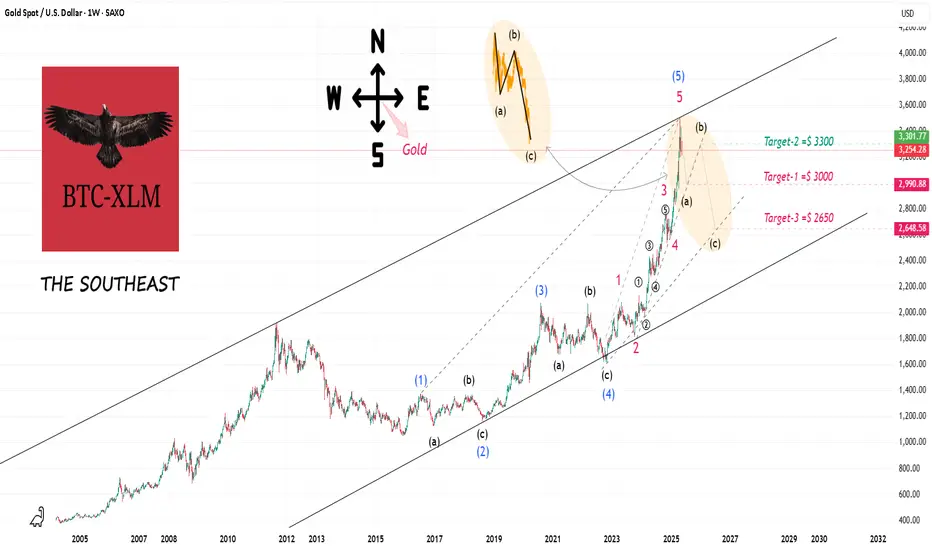
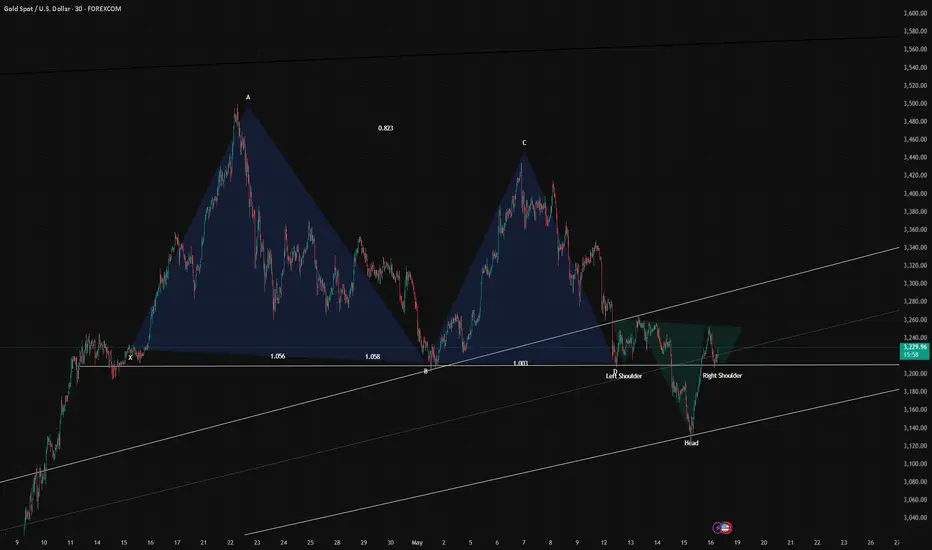
THE SOUTHEASTEveryone would sell out and go,
everyone who counts.
Technical Section:
ABC bear market (the price of gold must come down)
Target-1 =$ 3000
Target-2 =$ 3300
Target-3 =$ 2650
We shall see.
The focus of gold today is 3200!News:
The US economic data in April was weak across the board, with the producer price index (PPI) unexpectedly falling by 0.5%, retail sales growth plummeting to 0.1%, and manufacturing output falling by 0.4%, which severely hit the market's confidence in the US economy. Affected by this, the US bond market fluctuated violently, with the 10-year US bond yield plummeting by 11 basis points and the 2-year yield plummeting by 9.2 basis points; the US dollar index fell by 0.2%, and the real interest rate fell. At the same time, geopolitical risks continue to heat up. The Russia-Ukraine peace talks have reached a deadlock, Putin refused to meet with Zelensky, and the Iran nuclear agreement negotiations have not progressed smoothly. Against this background, the safe-haven attribute of gold has been highlighted, and market attention has increased significantly. Looking ahead to this trading day, a number of important US economic data will be released soon, and the progress of the Russia-Ukraine talks and Trump's dynamics are also attracting much attention. These factors will continue to affect market trends.
Technical aspect: From the perspective of the daily line, gold can no longer be regarded as a unilateral decline after yesterday's bottoming out and rebounding. It should be directly followed by the idea of oscillation! The primary focus today is still the position of the dividing line of 3200.
Trading idea: Go long if it doesn’t break around 3200, sl3190, target 3230
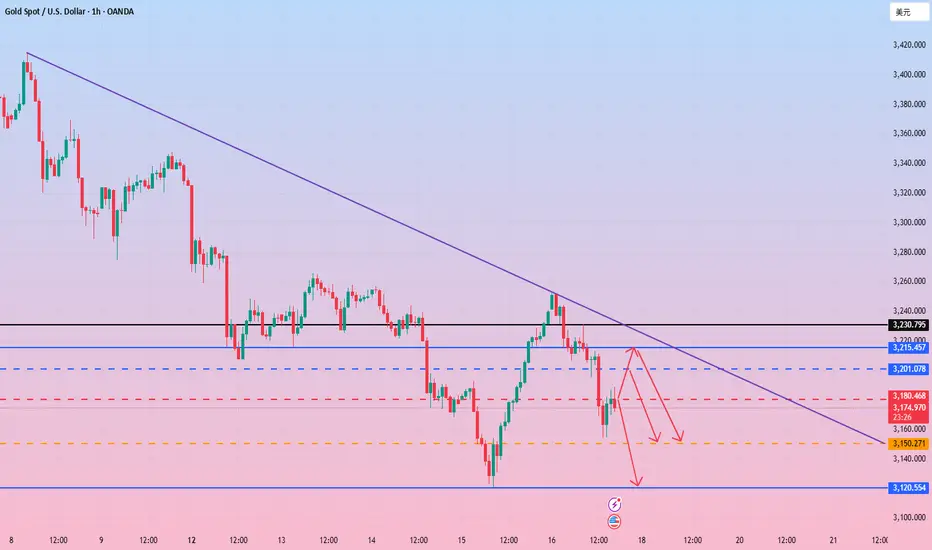
XAUUSD remains bearish unless it breaks 3265🗞News side:
1. India considers using new Indus River project to cut water supply to Pakistan.
2. Pay attention to the news of Russia-Ukraine ceasefire negotiations today
📈Technical aspects:
Today's opening correction is due to technical repair and adjustment, which is why I shorted. The support of 3200-3210 is of great significance to the short-term trend. If it can be supported here again, it may further promote the upward expansion space. However, after the rebound in the morning Asian session, it did not break through the 3265 line. On the contrary, the bulls began to weaken. Today is Friday, and the market is not expected to show a unilateral strong attitude. It will be treated as a shock during the day. Before breaking through 3265 above, we can short at a small level during the intraday rebound. Short-term operation suggestions, temporarily look at 3235-3240 on the upper side, and look at the support of 3210-3200 on the lower side.
If you agree with this view, or have a better idea, please leave a message in the comment area. I look forward to hearing different voices.
FOREXCOM:XAUUSD FXOPEN:XAUUSD TVC:GOLD FX:XAUUSD OANDA:XAUUSD
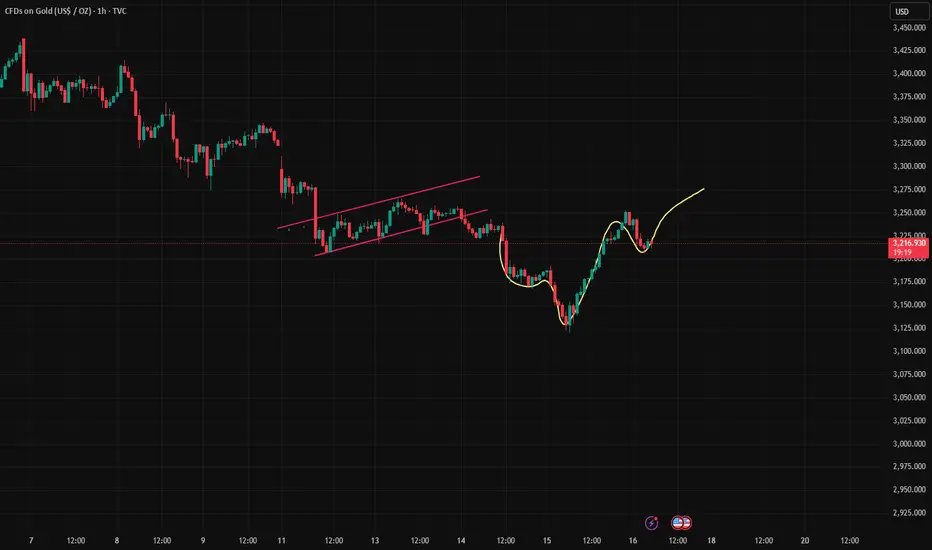
Gold has a strong deep V, 3200 support is good for longThe 1-hour moving average of gold begins to turn and continue, so the momentum of gold bears begins to weaken, and gold bulls may begin to exert their strength. However, gold started to rise all the way from 3120 to 3252 yesterday. Gold rose by about 130 points, so the volatility began to increase. Therefore, we must wait patiently for gold to adjust. Because of such a large fluctuation, an adjustment will also be tens of dollars. We must wait patiently for the adjustment and stabilize before going long. After gold breaks through 3192, it is considered a strong deep V breakthrough of important resistance. Then 3192 of gold has now become an important support level. If it falls back to 3192 in the Asian session, go long on dips. If gold falls back to near the 3200 mark, you can try to go long.
Since gold has started to reverse strongly, gold bulls have begun to show their muscles. In the short term, we should not be stubbornly bearish anymore. We should be flexible and adapt to the market. The market is like this, changing rapidly. We should adapt to the market and not be too obsessed with bears or bulls. Obsession is a trap. Gold bulls are strong now, so gold is now the home of bulls. Go long when the Asian session falls back.

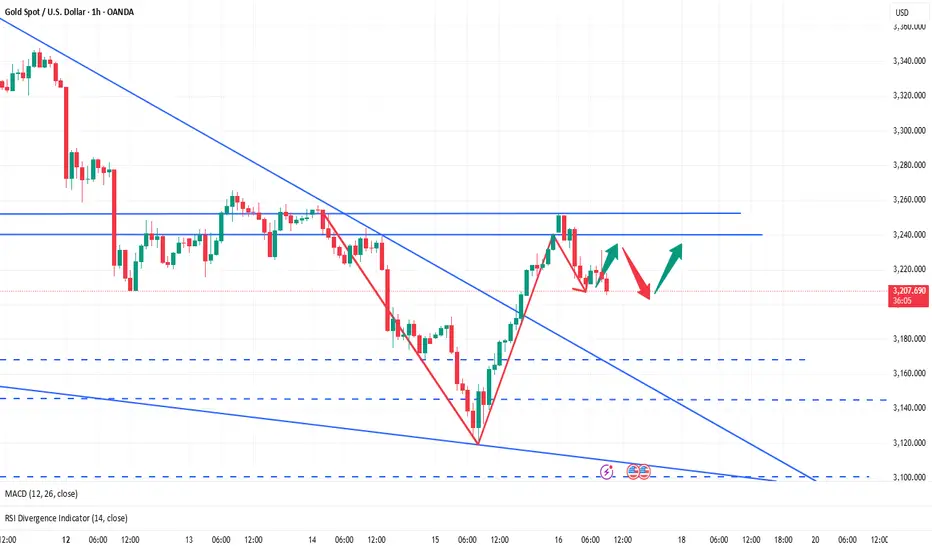
5/16 Gold Trading Signals
🌇Good afternoon, everyone!
Gold made a strong one-way rally from 3120 to above 3200 yesterday, perfectly achieving our bullish target with substantial profits.
Today, after a slight uptick at the open, gold started to pull back and enter a consolidation phase. Technically, this is a normal correction after a $120 surge. However, the key question now is:
🔍 Is this just a healthy pullback, or a bearish continuation pattern?
There’s some uncertainty in the current structure:
On the larger scale, the market still appears to be forming a double top.
On the shorter-term, this week’s pattern resembles a head and shoulders bottom, and price is now testing the neckline zone.
🧭 So, while the direction remains unclear, we can still identify key trading zones to act on.
🗞 News Watch:
Several important U.S. data releases are scheduled during the New York session. They may provide crucial directional signals for gold.
📌 Today’s Gold Trading Strategy:
🟢 Buy Zone: 3176 – 3148
🔴 Sell Zone: 3265 – 3287
🔄 Flexible Trading Zones (watch for reversals or breakout plays):
▫️3187-3198-3209-3237-3258-3267
✅ Reminder: With the structure being complex and direction unclear, avoid aggressive positioning. Focus on scalp or short-term trades near key zones and react to market post-data.
Latest trading opportunities for XAUUSD.The market went to the target position smoothly as expected.
Due to the sharp decline this week, there was a huge rebound in technical demand on Thursday. The highest broke through 3175/3200/3250. There were some pullbacks in the Asian market. So what positions should we pay attention to now? How to trade?
From the news side. The results of today's meeting between Russia and Ukraine are very important. The delay of one day in yesterday's negotiations has increased geopolitical uncertainty again. This is the biggest black swan event and the factor affecting the rise of XAUUSD. Before the results are announced today. There are still uncertain factors, which are the support for the decline of XAUUSD. However. If the results of the meeting are announced on the news side, then XUAUSD will have a corresponding response in the market. Then we can naturally choose the direction of trading.
Two results. Stop or extend the truce, then XAUUSD will fall further. If no agreement is successfully reached, then it is an opportunity to buy. So the impact of today's news results is very large. It needs to be paid attention to.
The basic data needs to pay attention to the support of 3200. Maintain the principle of long.
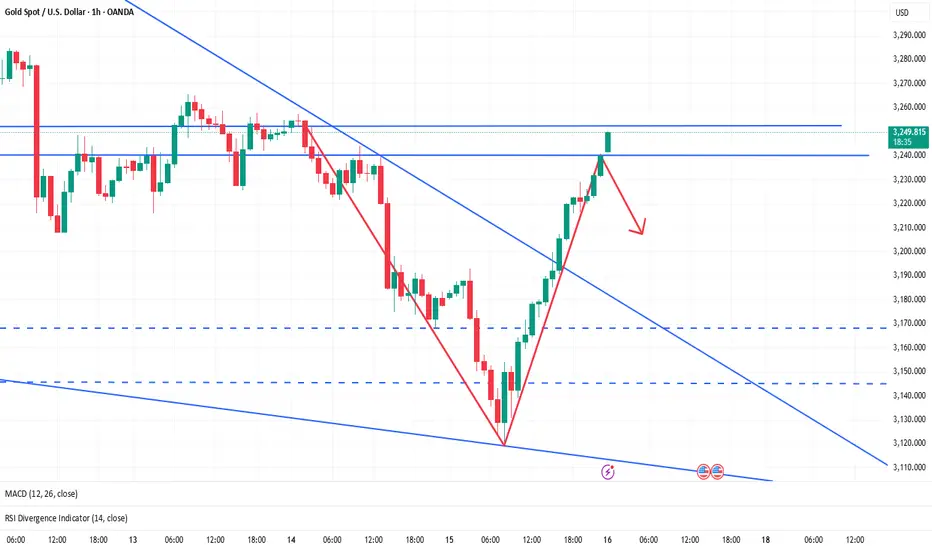
Can a V-shaped reversal continue the bull market?🗞News side:
1. Hamas official: If a permanent ceasefire is achieved, control of the Gaza Strip can be handed over
2. Fed Chairman Powell: The Fed is adjusting its overall policy-making framework. Zero interest rates are no longer a basic situation. The wording of underemployment and average inflation rate needs to be reconsidered. PCE is expected to fall to 2.2% in April.
3. Russia and Ukraine reached a ceasefire at the technical level
📈Technical aspects:
Yesterday, the gold price staged a V-shaped reversal and once rose to close near 3244. Although the technical indicators in the hourly chart show a favorable situation, there has been no correction in the current round of gold price increase, and the rise is slow. In addition, the RSI has entered the overbought area, so we need to be alert to the possibility of gold price correction today. Focus on the 3250-3260 resistance on the top and the 3210-3200 support on the bottom.
SELL 3245-3250 TP 3210-3200
If you agree with this view, or have a better idea, please leave a message in the comment area. I look forward to hearing different voices.
OANDA:XAUUSD FX:XAUUSD TVC:GOLD FXOPEN:XAUUSD FOREXCOM:XAUUSD
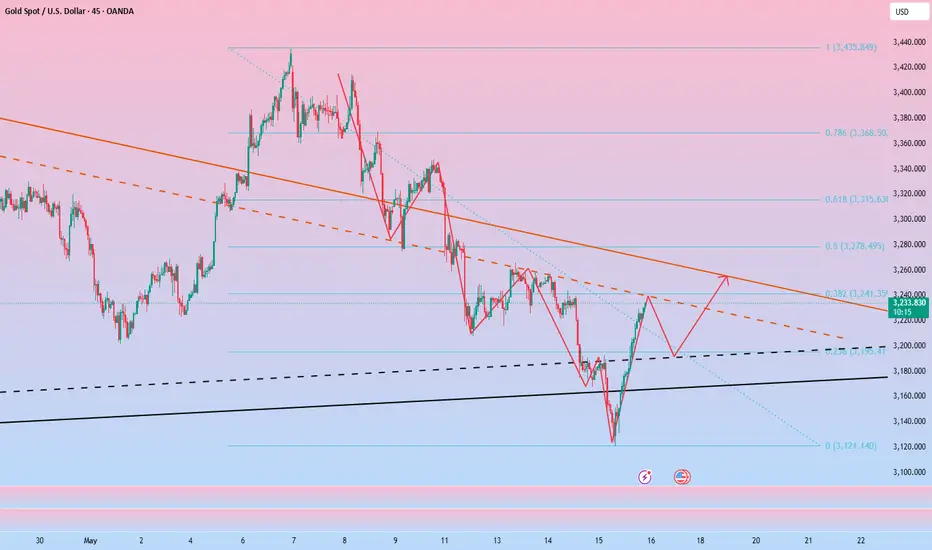
Is there still a chance for short sellers to make a profit?At present, gold continues to rebound to around 3230, and the intraday rebound has reached $100. Today, both short trades have touched SL, giving back most of the profits of the long positions in the morning. So are there still opportunities for shorts to make profits?
I think there are still considerable profit opportunities for shorts. Although gold has rebounded strongly to around 3230, it will soon face the short-term resistance area of 3240-3245, which happens to be the 38.2% split area when it retreats from 3435 to 3120, so this area has a certain suppression effect on gold in the short term! Then there is the suppression effect of the area around 3260; so I think there are still considerable profit opportunities for gold shorts. As gold rebounds, the short-term support below is raised to 3200-3190, followed by 3175-3165.
Trading strategy:
Consider trying to short gold in the 3235-3245 area, TP: 3200-3190
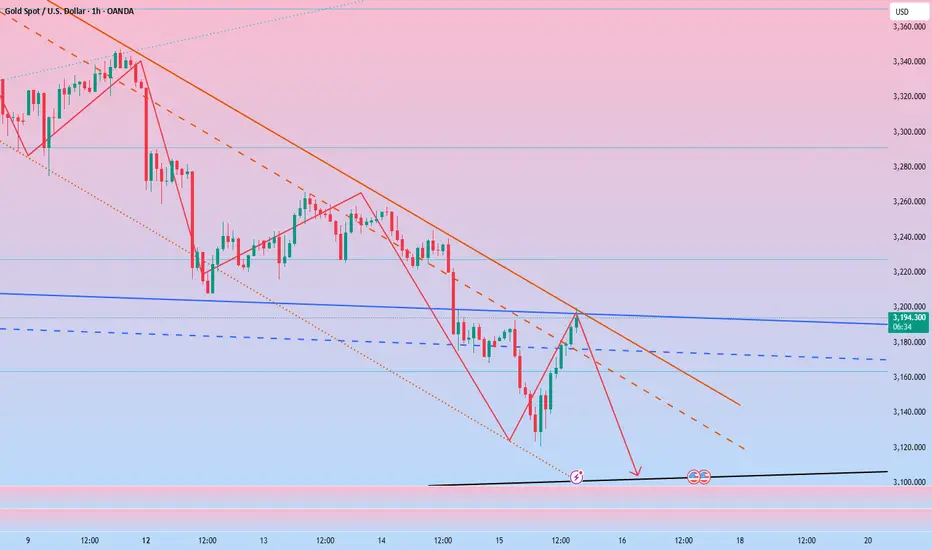
Continue to short goldTechnical aspect:
Gold rebounded gradually after hitting 3120, and has now rebounded to around 3200. Where will gold rebound? Is there still a chance to continue to short gold?
In fact, from the current structure, gold has not shown a clear bottoming signal, so this wave of rebound can only be regarded as a technical repair after the decline; however, the rebound from 3120 to around 3200 is not small, which will significantly increase the probability of 3120 as a short-term bottom; so where will gold rise? I think gold is currently under resistance in the 3200-3210 area, and it may be difficult to break through this resistance area in a short period of time. When facing this resistance area, gold may fall under pressure and test the 3165-6155 area again;
If gold really needs to form a reversal structure, it is necessary for gold to retest the 3165-3155 area support again and form a "W" double bottom structure with the 3120 low; only in this way can a complete reversal structure be formed.
Trading strategy:
Consider continuing to short gold in the 3195-3205 area, TP: 3165-3155
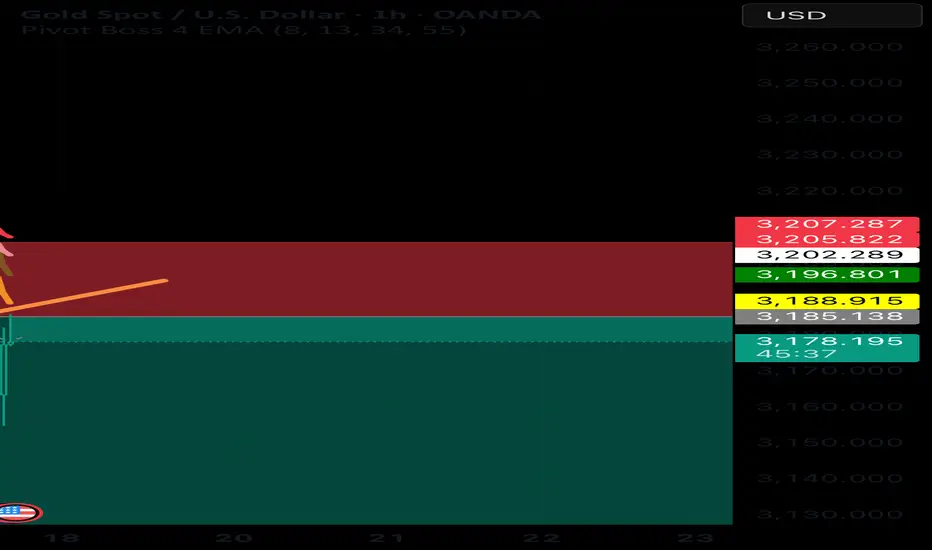
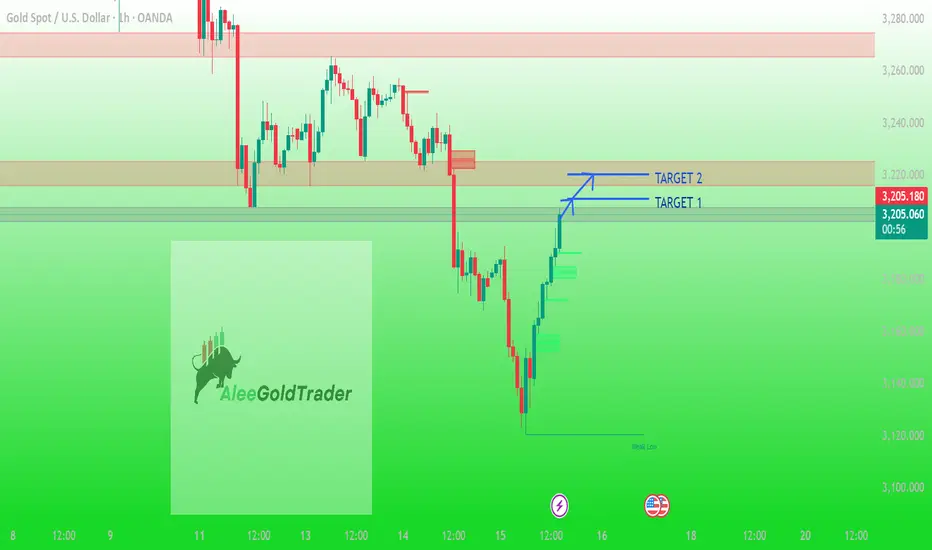
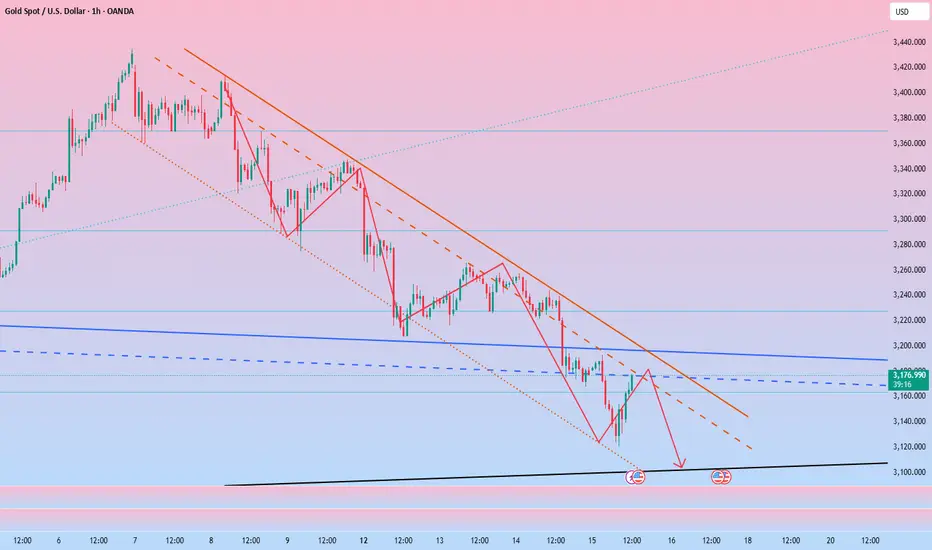
XAU/USD 1-Hour Chart Analysis – Bullish Momentum Towards Supply This 1-hour chart of Gold Spot (XAU/USD) from OANDA shows a strong bullish reversal following a recent sell-off. The price is approaching a key supply zone, where two potential target levels are identified:
Target 1: ~3,210 USD
Target 2: ~3,220 USD
The chart highlights previous resistance zones and current price action suggesting momentum toward these targets. The bullish run follows a reversal from a "Weak Low" area near 3,115 USD. Zones are color-coded for supply/resistance (red) and demand/support (green). The setup indicates possible short-term buying opportunities as price tests previous consolidation zones.
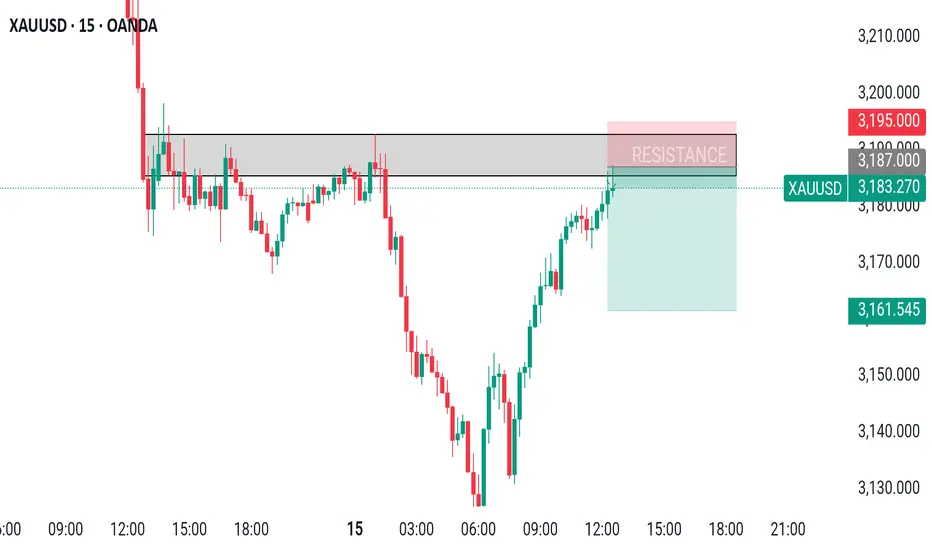
XAUUSD SHORT SELLING RESISTANCEHere I Created This XAUUSD Chart Analysis
Pair : XAUUSD (Gold)
Timeframe: 15 - Minutes
Pattern: Resistance
Momentum: Bearish/ SELL
Entry Level : SELL 3187
Resistance zone : 3190
Target Will Be : 3160
Disclaimer : This signal is based on personal analysis for learning purposes. Trade at your own risk and always use proper risk management.
5/15 Gold Trading Signals🌇Good afternoon, everyone!
Yesterday, gold broke the support after some sideways movement and touched the buy zone near 3170, but profit was limited.
Today, after opening, gold rebounded to above 3190 but faced resistance and started dropping again. Notably, the 1-hour chart shows bullish divergence, and although not yet corrected, such divergence usually leads to a rebound of at least $60 — a potential opportunity worth watching.
🗞 News Highlights:
U.S. Initial Jobless Claims
Research conference on monetary policy and economy
These events may significantly impact gold, so stay alert.
📌 Today’s Trading Strategy:
🟢 Buy Zone: 3113 – 3076
🔴 Sell Zone: 3208 – 3223
🔄 Flexible Trading Ranges:
▫️3123-3152-3168-3187-3198
✅ Maintain cautious, flexible positioning. Watch for divergence correction opportunities for a potential sharp rebound.

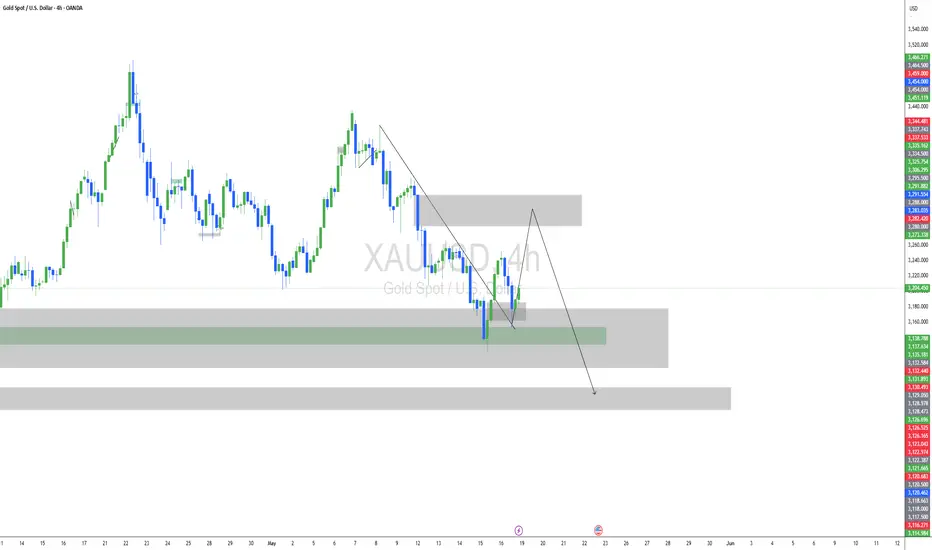
Continue to short gold after the reboundFundamentals:
1. Focus on Powell's speech at the Thomas Laubach Research Conference;
2. Pay attention to the situation of the Russia-Ukraine negotiations;
Technical aspects:
Gold has successively broken through the important support area of 3200 and 3160, and continued to around 3120; the short-term bearish trend is very obvious; although gold has rebounded to around 3170 again in the short term, I think the reason is one of the technical rebound repair after the decline; the second is the result of profit-taking of some short positions. So I fully believe that gold has the need to fall again after the rebound;
At present, we need to focus on the resistance of the 3175-3180 area, followed by the resistance of the 3195-3200 area; if gold cannot break through this resistance area during the rebound, gold is expected to fall again and continue to the area around 3100.
Trading strategy:
Consider the opportunity to short gold after gold rebounds to the 3275-3285 area; TP: 3150
TVC:DXY FOREXCOM:XAUUSD OANDA:XAUUSD CAPITALCOM:GOLD
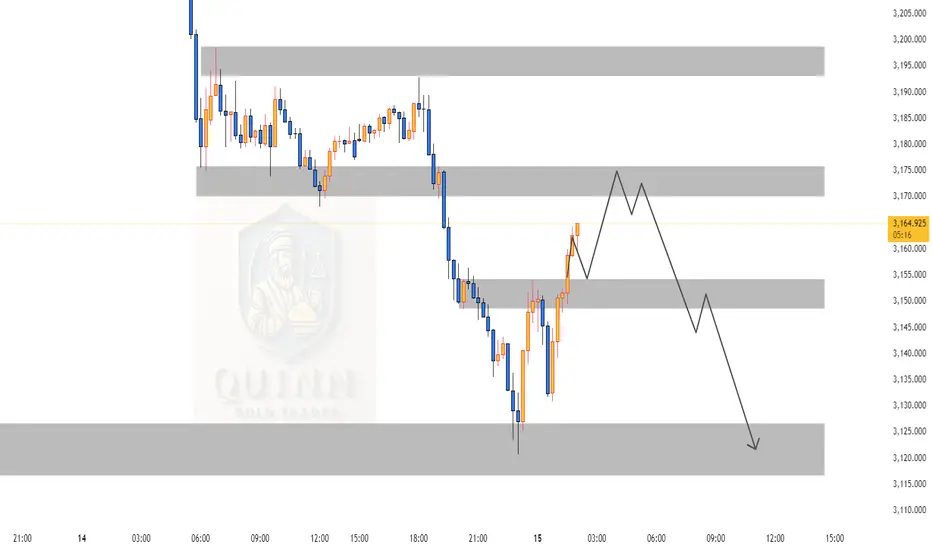
Gold XAUUSD Possible Move 15.05.2025Key Supply Zones to Watch for Short Opportunities:
3170–3175 Zone:
→ Strong supply area.
→ If price rejects this zone with confirmation (e.g., bearish engulfing, M5/M15 BOS or CHoCH), enter sell.
3150–3155 Zone:
→ Mid-level supply.
→ If price fails to reach 3170 and breaks below this level, wait for a break & retest of this zone for potential sell entries.
📉 Trade Signal (Sell Bias):
Scenario 1 – Rejection at 3170–3175:
Sell Entry: On confirmation at 3170–3175
SL: Above 3178
TP1: 3155
TP2: 3145
TP3: 3125 (final target – next demand zone)
Scenario 2 – Break of 3150–3155:
Sell Entry: On retest of 3150–3155 zone after breakdown
SL: Above 3160
TP1: 3135
TP2: 3125
✅ Confirmation Tools:
Candlestick pattern (e.g., bearish engulfing / M15 BOS)
Lower timeframe structure shift (M5-M15 CHoCH)
Volume spike or momentum fade at zone
Kindly follow, comment, like and share.