GOLD Intraday Chart Update For 15 July 2025Hello Traders,
Welcome to the US CPI Day, as you can see that market is in tight range for now and all eyes on the breakout for now
Only clear breakout of 3380 we will consider market will be bullish towards 3400 & 3425
If markets sustains below 3335 it will move towards 3305 or even 3285
All eyes on US CPI
Disclaimer: Forex is Risky
Xauusdsignal

XAUUSD:Today's trading strategies for buying and selling
The gold price reached a peak of 3374.69 during the Asian trading session. Overall, it remains in a bullish uptrend. From the half-hour and hourly charts, the 30-day line provides support at around 3353. Therefore, when trading within this fluctuating range, it is important to note that in a situation where the bullish trend is strong, short selling should be conducted with a light position.
Trading Strategy:
BUY@3353-57
TP:3370-75
SELL@3375-80
TP:3360-63
More detailed strategies and trading will be notified here ↗↗↗
Keep updated, come to "get" ↗↗↗

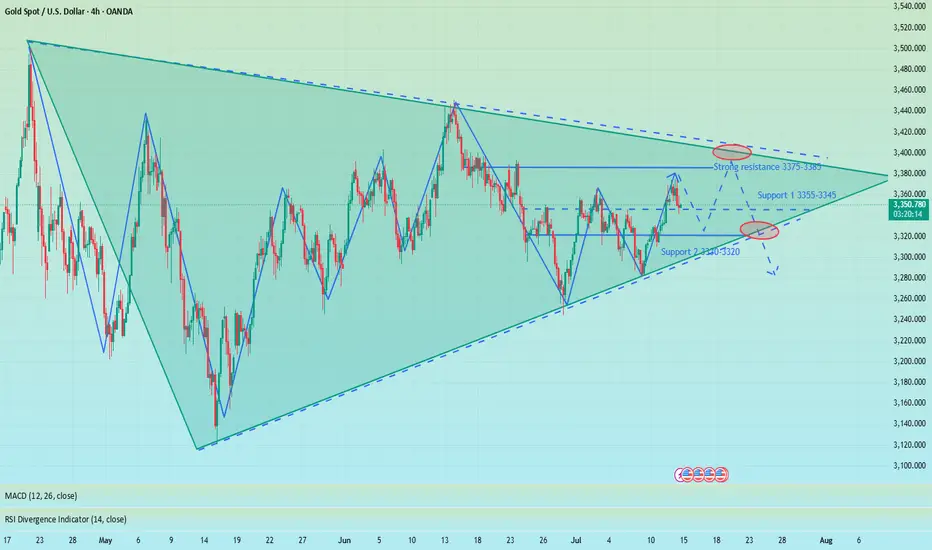
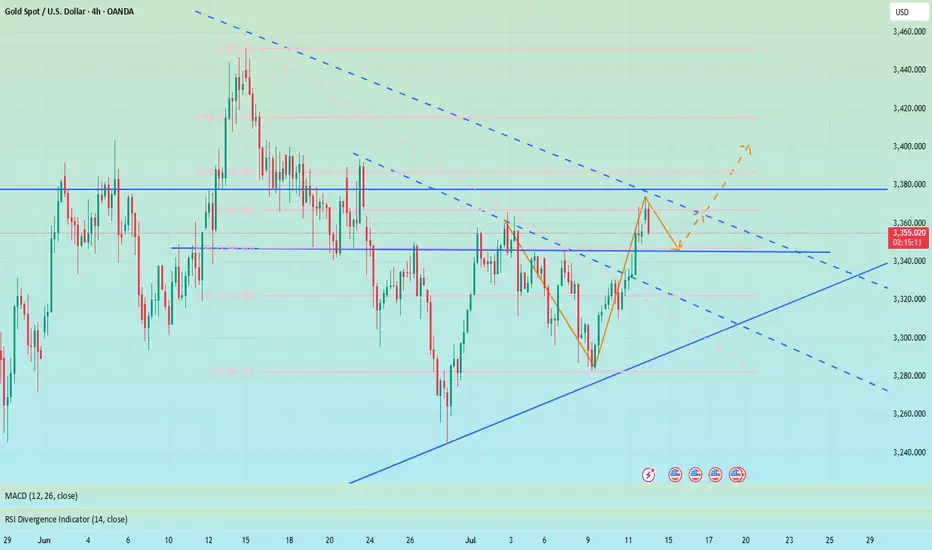
Converging triangle, may rise again in the short termUnder the influence of recent tariffs and the Federal Reserve's interest rate cuts, the main trend of the gold market remains bullish, but from the weekly and monthly level analysis, there is a high probability that it will pull back again after this round of highs and maintain a large range of fluctuations at a high level. Technical analysis shows that gold currently does not have the conditions for a unilateral surge at the daily level. Although the key level of 3345 has been broken, the continuity of the market is extremely poor, and volatility is still the main theme. At present, the trend of gold has formed a converging triangle pattern, and it may rise again in the short term. However, we need to be vigilant that the weekly line may form a high-rise and fall pattern, and the price of gold may fall back to 3300! Therefore, in today's late trading, you can consider retreating to the 3335-3330 area to go long
OANDA:XAUUSD
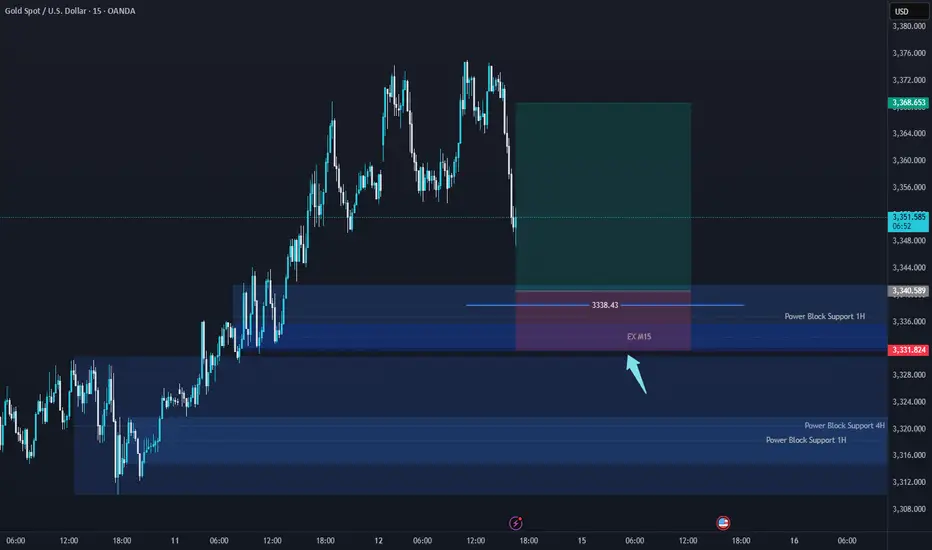
XAUUSD 4H – Break & Retest With Bullish Continuation | SMC🚨 Gold (XAUUSD) is setting up for a potential bullish move after a successful break and retest of a key resistance zone at 3346 – 3348, now turned into fresh support.
🔍 Technical Breakdown:
📌 Structure:
Gold previously formed a strong resistance near 3346, which aligned with multiple rejections in past sessions. After a liquidity sweep and break above this level, price retraced for a textbook break-and-retest setup.
📌 CHoCH & BOS (Break of Structure):
The market showed a bullish Change of Character followed by a clean Break of Structure to the upside, confirming bullish intent.
📌 Smart Money Perspective:
Institutional demand was respected at 3296–3305 zone.
Liquidity below this zone has been taken.
Current bullish candles are printing higher highs and higher lows.
📌 Confluences:
✅ Break & Retest of major structure
✅ Clean demand zone below
✅ Imbalance filled
✅ Bullish market structure
✅ SMC confirmation (CHoCH + BOS + Mitigation)
📈 Trade Idea (Long Setup):
💰 Buy Entry: 3359
🔻 Stop Loss: 3305 (below demand + structure)
🎯 Take Profit 1: 3400
🎯 Take Profit 2: 3440 – 3442 (major resistance)
🧮 Risk-to-Reward: 1:2+
This setup provides a strong bullish continuation opportunity targeting the upper resistance zone. Monitor candle confirmations and session volume for more precise entries.
📢 💬 Like this idea? Follow for more Smart Money trades on Gold, US30, NAS100, and V75!

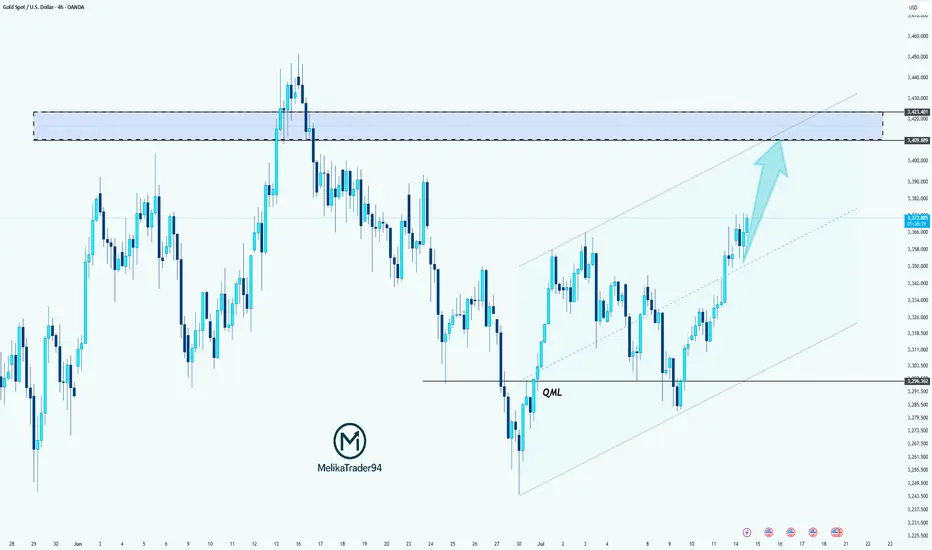
Gold Aiming Higher: Bullish Momentum Toward Key S&D ZoneHello guys!
The main bullish trend remains intact on Gold. After forming a solid base near the QML level, price has been respecting the ascending channel structure and is now pushing toward the upper boundary of that channel.
The current price action shows strength and momentum, and with the recent breakout above the midline of the channel, it signals that buyers are likely to push price toward the next key area of interest.
The target is clearly defined: the supply zone around 3409–3423, which has previously acted as a major resistance area.
Core idea:
Main trend: Bullish
Structure: Ascending channel
Support confirmed: QML zone bounce
Current behavior: Price moving along the top of the channel
Target: 3409–3423 supply zone
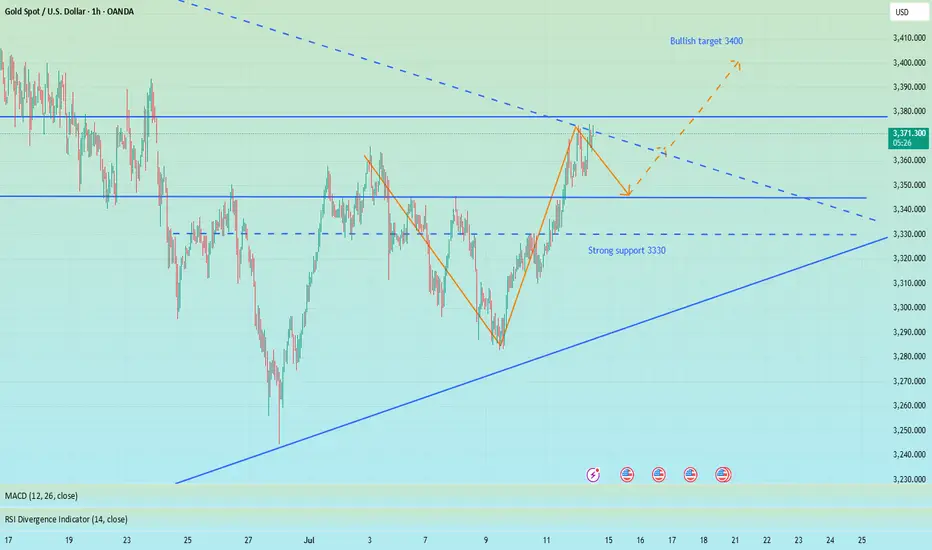
XAUUSD: Trading Strategy Before the US SessionAhead of the release of key US session data, gold is oscillating in a narrow range between $3340 and $3375. The daily chart shows a balance between bulls and bears. On the 4-hour chart, $3375, which coincides with the 61.8% Fibonacci retracement level, serves as a critical watershed for the market trend.
In terms of trading strategy, it's advisable to trade within the aforementioned range and follow the trend once there is a clear breakout. If gold stabilizes above $3360 and breaks through $3375, it could rally towards $3400. Conversely, if it falls below $3340 and loses the $3310 - $3320 range, it may test $3300. It's essential to confirm the direction in conjunction with fundamental news and avoid blind trading.
I am committed to sharing trading signals every day. Among them, real-time signals will be flexibly pushed according to market dynamics. All the signals sent out last week accurately matched the market trends, helping numerous traders achieve substantial profits. Regardless of your previous investment performance, I believe that with the support of my professional strategies and timely signals, I will surely be able to assist you in breaking through investment bottlenecks and achieving new breakthroughs in the trading field.

Gold's Bullish Momentum: Trading Strategy for TodayTechnically, gold prices continued their strong bullish rally to break new highs last Friday 😎. During the Asian and European sessions, prices broke through the 3320 mark and extended their upward momentum with sustained strength 💹. In the afternoon European session, gold prices kept surging, breaking through and standing above the 3340 mark, accelerating the upward trend 🔥. In the evening US session, the price further accelerated its rally, piercing the 3369 level before pulling back and closing strongly 📈. The daily K-line closed as a fluctuating and high-breaking bullish candle 🌞. On the daily chart, there has been a strong bullish rally breaking new highs for three consecutive trading days, and the overall price has returned to the 3360 mark, re-entering a strong bullish one-sided pattern.
This morning, gold prices opened with a further gap higher, piercing the 3370 mark and continuing to fluctuate strongly 😜. Today's trend should focus on buying on dips 🙌. Although gold gapped up and surged for a while, the momentum is not strong. There must be a pullback for adjustment; otherwise, it will be difficult to maintain the upward momentum 🚶♂️.
From the 4-hour chart analysis, the short-term support below today should focus on the hourly neckline around 3340-45 📍, with key attention to the 3325-30 support level. During the day, we should continue to take the opportunity of pullbacks to go long as the main strategy 😏. The key dividing line for the short-term bullish strength is the 3325 mark. As long as the daily chart stabilizes above this level, we will continue to maintain the strategy of buying on dips to follow the bullish trend. Before breaking below this level, we will keep the strategy of buying on dips to follow the trend 💪
Accurate signals are updated every day 📈 If you encounter any problems during trading, these signals can serve as your reliable guide 🧭 Feel free to refer to them! I sincerely hope they'll be of great help to you 🌟 👇

Gold Bulls Are Back – Eyes on 3450 GOLD – Bulls Regain Control After Defending 3280
🟡 Last week was a dynamic one for Gold traders.
The week began with signs of an upside reversal, followed by a drop to test the 3280 support. That dip held—and from there, we saw a strong push higher, ending the week right at the top of the range.
📌 Friday’s close left behind a continuation Pin Bar on the weekly chart – a strong signal in favor of the bulls.
- This week started with a new local high at 3375,but we’re now seeing a pullback in the 3355 area at the time of writing.
What’s next?
Given last week’s price action, bulls seem to have won the battle and appear ready to challenge the 3400 level.
My plan for this week:
I’m looking to buy dips, and as long as nothing changes, my target is the 3450 zone.
Disclosure: I am part of TradeNation's Influencer program and receive a monthly fee for using their TradingView charts in my analyses and educational articles.

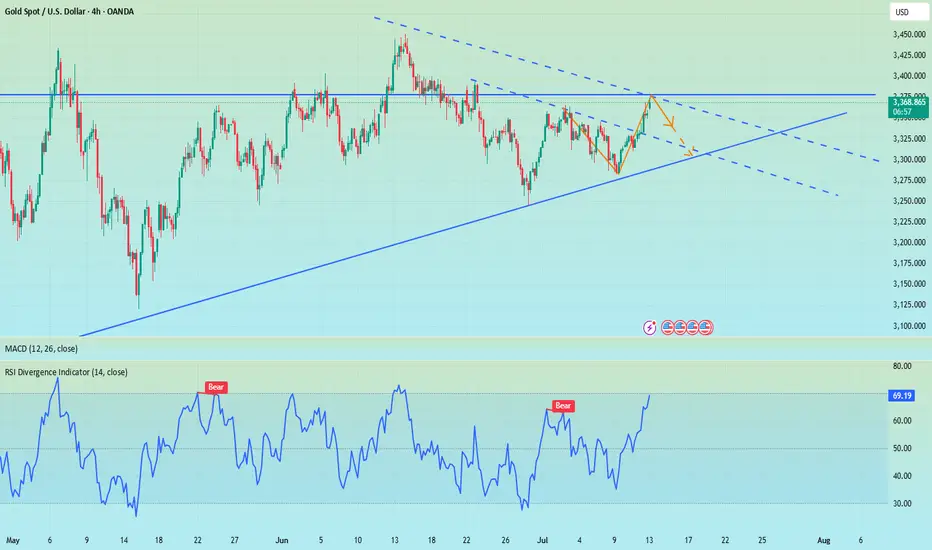
The market is bullish, but I am bearish. Don't regret it.📰 News information:
1. Focus on tomorrow's CPI data
2. Bowman's speech at the Federal Reserve
3. Tariff information outflows and countries' responses to tariff issues
📈 Technical Analysis:
This week, the US CPI data, consumer index, tariff issues and geopolitical situation are all key points to pay attention to. In the morning, both our long and short positions had good gains, making a good start to the week. The best way is to follow the trend and grab limited profits!
In the 4H cycle, the current trend shows a Zhendan upward pattern, and bulls still occupy the dominant low position in the short term. At the daily level, three consecutive positive days at the end of last week broke through the middle track, and the high point broke through the previous high, indicating that the short-term adjustment is over, and the rise in the market to test 3400 will be a high probability event. At present, the MACD daily line is bullish, the Bollinger Bands are flat, and the gold price is above the middle track. The bulls are strong, but there is still a need for a correction. Intraday trading focuses on the strength of the European session. If the European session is strong, the US session will continue to rise, and if the European session is weak, the US session will bottom out again. In the short term, if it touches 3370-3375 again, you can consider shorting and look towards 3365-3355 SL 3380.
🎯 Trading Points:
sell 3370-3375
tp 3365-3355-3345
In addition to investment, life also includes poetry, distant places, and Allen. Facing the market is actually facing yourself, correcting your shortcomings, facing your mistakes, and exercising strict self-discipline. I share free trading strategies and analysis ideas every day for reference by brothers. I hope my analysis can help you.
FXOPEN:XAUUSD TVC:GOLD FX:XAUUSD FOREXCOM:XAUUSD PEPPERSTONE:XAUUSD OANDA:XAUUSD
XAUUSD Bullish Signal | Technical + Custom AlgoSmart Trend Signal | Technical Analysis + Custom Algorithm
This signal is the result of a combination of classic technical trend analysis and a proprietary software I personally developed.
Beware of the market's trap of luring more investors, short 3335Regarding recent trading strategies, I believe you have also seen my trading win rate. I often inform the future trend of gold several hours or even days in advance, because my many years of trading experience have made me an excellent poisonous wolf in the trading market. Now I see a lot of bullish voices in the market, but my wolf’s sense of smell has discovered danger signals. In the short term, I think that without the influence of news, the market needs to digest the overbought momentum of the bulls. From the 4H chart, the middle track of the Bollinger Band is at 3332, which is very close to the strong support of 3330 given by us during the day. Therefore, I think that at least within 4 hours, gold will fall back to test the support below 3340-3330, or even 3320. Since most people want to follow the crowd, let them go. They will only fall into the trap set by the market. Let's prove with facts whether following the wolf pack will make you hungry or well fed.
OANDA:XAUUSD

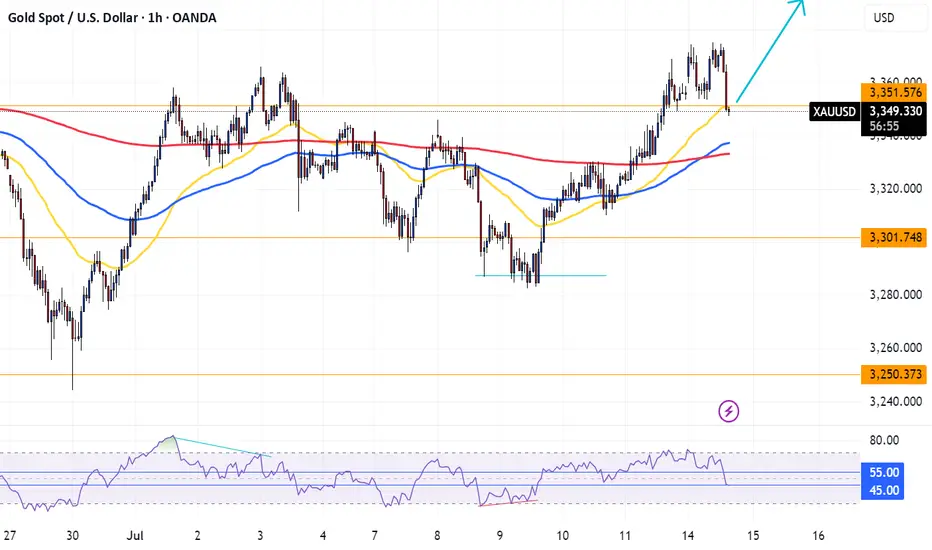
XAUUSD Long OpportunityXAUUSD is bullish per the 4 hour and 1 hour timeframe with continued bullish momentum coming out of the fundamentals around tariff uncertainty. There is clear bullish market structure.
XAUUSD is currently sitting on the pivot level of $3350 (Resistance turned support) after a retracement prior for the NY opening bell which gives rise for a long opportunity from this level towards the next Pivot point at $3391.
On the hour timeframe, price is trading above the 50 and 200 SMA and is currently sitting upon the 21 SMA which XAUUSD has used push point from in the past trending markets. RSI is currently sitting in a sweet spot region of the RSI between 45-55 indicating this is a valid retracement and price is looking to turn bullish again soon.
This provides 4 points of Bullish confluence within the momentum in favour of further bullish movements
7/14: Sell High, Buy Low Within the 3400–3343 Range for GoldGood morning, everyone!
At the end of last week, renewed trade tariff concerns reignited risk-off sentiment, prompting a strong rally in gold after multiple tests of the 3321 support level. The breakout was largely driven by fundamental news momentum.
On the daily (1D) chart, the price has fully reclaimed the MA60 and broken above the MA20, signaling an emerging bullish trend. The key focus for this week includes:
Monitoring whether MA20 holds as support on any pullbacks
Watching the 3400 resistance zone for signs of exhaustion or continuation
From a 30-minute technical perspective, gold is currently trading within a short-term resistance band of 3372–3378, with a stronger resistance zone between 3387–3392. Key support levels are:
Primary support: around 3358
Secondary support: 3343–3332 zone
Given the recent increase in volatility due to geopolitical and macroeconomic headlines, flexible intraday trading is recommended within the 3378–3343 range, while broader trades can be framed around the 3400–3325 zone, still favoring a sell-high, buy-low approach.
Lastly, as we move into the mid-year period, I may have more personal commitments, and strategy updates could be less frequent. I appreciate your understanding, and as always, feel free to leave a message if you have any questions or need trading guidance—I’ll respond as soon as I can.

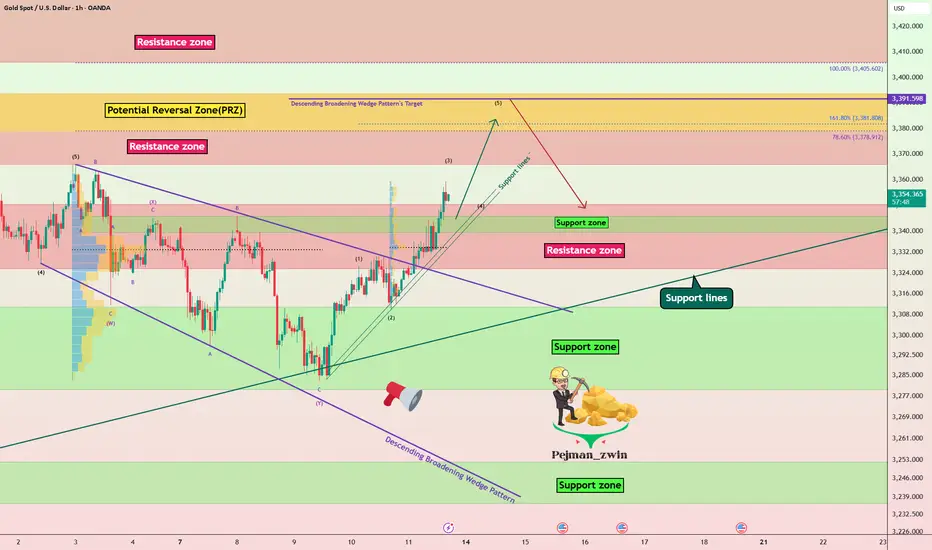
Gold Roadmap=>Short termGold ( OANDA:XAUUSD ) currently appears to have broken through the Resistance zone($3,350-$3,325) .
The Resistance zone($3,350-$3,325) was broken with the help of the Descending Broadening Wedge Pattern , the upper line of this classic pattern having served as an important resistance line for us in previous ideas .
In terms of Elliott wave theory , Gold has completed the Double Three Correction(WXY) within the Descending Broadening Wedge Pattern . It is currently completing the next five impulse waves . Wave 5 of these waves could end in the Potential Reversal Zone(PRZ) .
I expect Gold to rise to the Potential Reversal Zone(PRZ) , and of course, given the momentum of gold approaching PRZ , we can also look for Short positions in PRZ .
Note: Stop Loss (SL) = $3,329
Gold Analyze (XAUUSD), 1-hour time frame.
Be sure to follow the updated ideas.
Do not forget to put a Stop loss for your positions (For every position you want to open).
Please follow your strategy; this is just my idea, and I will gladly see your ideas in this post.
Please do not forget the ✅ ' like ' ✅ button 🙏😊 & Share it with your friends; thanks, and Trade safe.
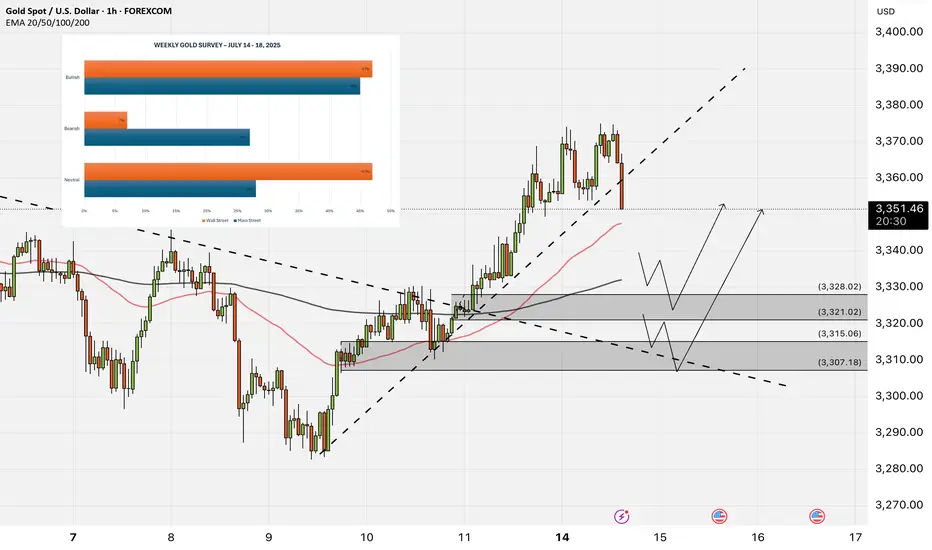
XAUUSD - Gold Awaits Tariff News?!Gold is trading above the EMA200 and EMA50 on the hourly chart and is trading in its medium-term ascending channel. We remain bullish on the commodity and can expect to see $3,400. A correction towards the demand zones would provide us with a better risk-reward buying opportunity.
Gold markets experienced significant volatility this past week, largely driven by global trade developments and speculation over future Federal Reserve actions. Although gold posted a positive weekly performance, it remained confined within its recent trading range and continued to trade cautiously.
Marc Chandler, CEO of Bannockburn Global Forex, noted, “Gold saw declines on Monday and Tuesday, but a three-day rally brought the week to a positive close. It appears that the announcement of new U.S. tariffs played a major role in this rebound. However, it remains uncertain whether the consolidation phase following the historic high near $3,500 has concluded.”
Adam Button, head of currency strategy at Forexlive.com, said that since the passage of the “Big, Beautiful Bill” last week, markets have split into two opposing camps. “The optimists are enthusiastically buying equities, while the pessimists are flocking to precious metals. The bulls believe the budget deficit could stimulate growth, but the bears are concerned about the long-term burden of repaying it.”
He continued: “This divide is evident across the market. Bearish capital is flowing into bitcoin, silver, and gold. While retail traders are largely focused on bitcoin and silver, gold remains the preferred safe haven for central banks and global reserve managers. These institutions are likely observing Trump’s policies and the political landscape carefully before reducing reliance on the U.S. dollar and reallocating reserves toward gold.” He added, “Among retail traders, patience seems to have worn thin, and many are ready to enter the market aggressively.”
Button also stated that the markets are no longer reacting seriously to Trump’s tariff rhetoric. “The reaction of the Canadian dollar after the 35% tariff announcement on Thursday clearly reflected this indifference. Even the Brazilian real barely moved despite facing unexpected tariffs. Now all eyes are on the potential tariffs on Europe—an announcement that could come at any moment and serve as a key test. Still, I expect the market will shrug it off. The only question is whether that indifference lasts an hour or even less.”
Meanwhile, Deutsche Bank has issued a warning that financial markets may be underestimating the risk of Federal Reserve Chair Jerome Powell being dismissed by Trump. According to Bloomberg, George Saravelos, the bank’s senior strategist, said that such a move could result in a 3–4% drop in the U.S. dollar and a 30–40 basis point surge in Treasury yields within a single day.
He emphasized that removing Powell would be a significant blow to the Fed’s independence and would raise concerns about direct political interference in monetary policymaking. The market’s long-term response would depend on Trump’s nominee to replace Powell, how other Fed officials react, and the overall state of the economy. Deutsche Bank also warned that the U.S.’s weak external financing position could amplify market volatility well beyond the initial shock.
Looking ahead to next week, investors will be closely watching developments around trade tariffs, but special attention will also be paid to the U.S. Consumer Price Index (CPI) for June. According to the ISM Purchasing Managers Index (PMI), prices in the manufacturing sector have slightly accelerated, while price components in the non-manufacturing sector have dropped notably. Since manufacturing only accounts for 10% of U.S.GDP, the risks to CPI appear skewed to the downside. A slowdown in inflation may lead some market participants to reassess the likelihood of a July rate cut—potentially halting the recent upward momentum of the U.S. dollar.
On Wednesday, June’s Producer Price Index (PPI) data will be released, followed by June retail sales figures on Thursday. Additionally, Friday will see the preliminary results of the University of Michigan’s consumer sentiment survey for July. This report is closely watched for its one-year inflation expectations. The annual rate surged to 6.6% in May before dropping to 5% in June. If this downward trend continues, it could reinforce the view that inflation risks are easing, potentially leading to a modest pullback in the dollar.
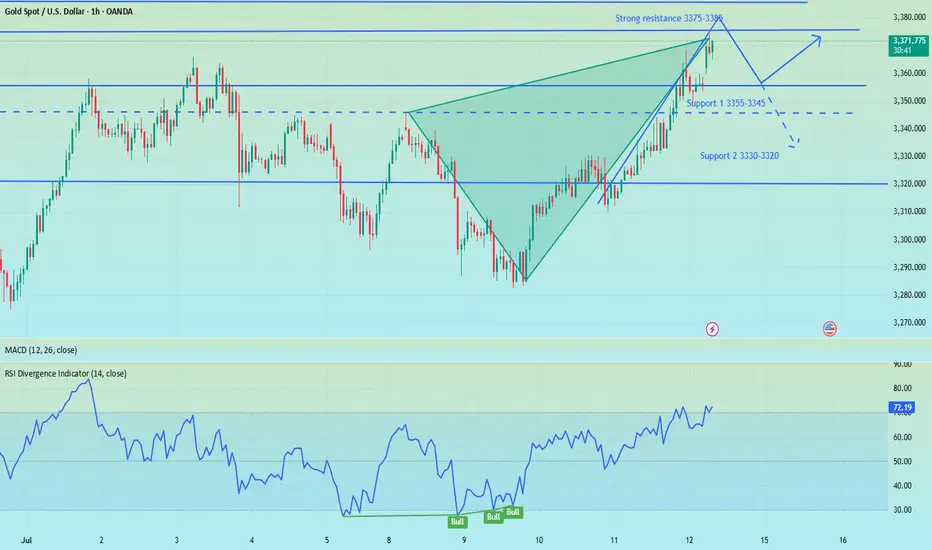
GOLD H2 Intraday Chart Update for 14 July 2025Hello Traders,
we have no major news today, But Tariff News remains agendas for now
All eyes on 3380-3400 zone breakout for further upside, only below 3350 GOLD will move towards 3330 level with continuation of 3310 level
Disclaimer: Forex is Risky

Gold gaps up and open higher,beware of going long at high levelsBros, the Asian session opened higher in the morning. Currently, gold is falling back to the SMA1O moving average. We will continue to be bullish after it falls back and stabilizes. At present, it has broken through the key resistance level of 3360. The daily line has shown a strong pattern of three consecutive positives. The gold price remains in the rising channel, and the bullish trend is obvious. As the gold price moves up, the short-term moving average moves up with it. At present, 3355-3345 constitutes an important support in the short term, and 3375-3385 above constitutes a short-term resistance area. Whether it can stand firmly above 3360 this week is the key.
Severe overbought in the short term, there are trading risks for long positions at high levels. Short-term operation suggestions for the Asian and European sessions: consider shorting when it touches 3365-3375, and stop loss when it breaks 3375. The target focuses on 3355-3345, and the breakout looks at 3330-3320. On the contrary, if it stabilizes at 3355-3345, you can consider going long.
Short position profit, focus on 3355-3345 support📰 News information:
1. Focus on tomorrow's CPI data
2. Bowman's speech at the Federal Reserve
3. Tariff information outflows and countries' responses to tariff issues
📈 Technical Analysis:
The short-term bears have successfully hit the TP to realize profits, and the trading strategy is still valid. Continue to pay attention to the 3355-3345 support during the day. If effective support is obtained here, you can consider going long. For the rebound, the first TP can focus on the 3365 line. If the gold price breaks through 3380 in the future, it will not be far from 3400. If it falls below, pay attention to the support of 3330-3320 below. It is expected that this is the limit position of short-term bearishness. The impact of tariffs is still there, and the bullish trend remains optimistic in the short term, unless Europe, Japan and other countries have a new solution to tariffs.
🎯 Trading Points:
BUY 3355-3345
TP 3365-3380-3400
In addition to investment, life also includes poetry, distant places, and Allen. Facing the market is actually facing yourself, correcting your shortcomings, facing your mistakes, and exercising strict self-discipline. I share free trading strategies and analysis ideas every day for reference by brothers. I hope my analysis can help you.
OANDA:XAUUSD PEPPERSTONE:XAUUSD FOREXCOM:XAUUSD FX:XAUUSD TVC:GOLD FXOPEN:XAUUSD
XAU/USD: Analysis and Strategy Amid Trade ConflictsA rate cut this month is highly unlikely, with the earliest possible delay to September. Currently, the gold market trend is still dominated by tariff factors. Although the tariff war was extended for 90 days in April, the 10% base tariff imposed on all trading countries during this period has already made the total tax revenue of these three months reach 70% of that in previous years.
Trump's launch of the tariff war has clear core goals: first, to directly increase U.S. fiscal revenue; second, to boost exports through policy inclination, while helping enterprises increase profits to expand the tax base; third, to promote the growth of domestic employment. Just last weekend, his administration announced that it would impose a 30% tariff on the European Union and Mexico, and the new regulations will take effect on August 1.
Against this backdrop, the escalation of trade conflicts has become increasingly obvious. For gold, this means continuous and strong support, and the certainty of its upward logic has been further enhanced. From a long-term perspective, the gold market is not expected to see a deep correction in the second half of the year.
After pulling back to around $3,280 last week, the price has embarked on a sustained upward trajectory and now fluctuates within the range of $3,345-$3,380. For this interval, a strategy of buying low and selling high would be appropriate.
I am committed to sharing trading signals every day. Among them, real-time signals will be flexibly pushed according to market dynamics. All the signals sent out last week accurately matched the market trends, helping numerous traders achieve substantial profits. Regardless of your previous investment performance, I believe that with the support of my professional strategies and timely signals, I will surely be able to assist you in breaking through investment bottlenecks and achieving new breakthroughs in the trading field.

XAUUSD 1H | Bullish BOS & OB Retest | Targeting 3390+🚀 Gold (XAUUSD) 1H Timeframe is showing a clean Bullish Market Structure with multiple Breaks of Structure (BOS ↑) confirming upside momentum.
🔹 Price retraced back into a strong Demand Zone (OB) and has started pushing upward again, indicating strong buyer interest.
🔹 Clear Order Block Retest after BOS confirms Smart Money Entry.
🔹 Target is marked around 3390+, based on previous liquidity and imbalance zones.
📈 Expecting continuation of bullish trend until the marked Target Point is reached.
💡 This setup follows pure SMC principles: BOS → OB Retest → Expansion.
🟢 Buy Bias Active | 📊 High Probability Trade Setup
#XAUUSD #Gold #SMC #BreakOfStructure #OrderBlock #LiquidityGrab #TrustTechnicallyAnalysis

Affected by tariffs, gold rose again.On Saturday, Trump announced that he would impose a 30% tariff on goods imported from the European Union and Mexico from August 1. This news triggered a rise in risk aversion in the market. As a traditional safe-haven asset, gold was once again sought after. The price continued the rise on Friday and continued to open high in the early Asian session. As of now, the highest price reached around 3373.
From the current market point of view, after breaking through the triangle pattern last Friday, there was a sharp rise. The price successfully stood on the short-term moving average, showing an overall bullish trend. However, it should be noted that the short-term moving average has not yet formed an upward cross, which means that there is a high possibility of a confirmation process in the future. Looking back at the trend in the past two months, gold rarely opens high and then continues to rise. Most of them open high and go low. Therefore, under the current situation, although it is bullish overall, it is not advisable to blindly chase more. It is more suitable to wait for a decline before arranging more orders. The key lies in grasping the decline position.
From the perspective of pressure level, 3380-3385 is the first pressure level, and the second pressure level is 3395-3400. The support level below is around 3345, which is also the pressure level that has been emphasized in the early stage, and the top and bottom conversion position. For today's operation, Quaid recommends low-to-long.
Operation strategy:
Short near 3380, stop loss 3390, profit range 3360-3345
Long near 3345, stop loss 3335, profit range 3360-3380
Gold trend forecast for next week, continue to go longAfter the gold broke through on Friday, we started to turn long, and gold rose strongly. Gold finally rose as expected, and the gold bulls are still strong. If there is no major change in the news over the weekend, the decline next week will not be large, and we can continue to buy. The gold 1-hour moving average continues to cross upward and the bulls are arranged and diverge. The strength of gold bulls is still there, and the gold moving average support has also moved up to around 3330. After gold broke through 3330 yesterday, gold fell back to 3330 and stabilized and rose twice. The short-term gold 3330 has formed a strong support. Gold will continue to buy on dips when it falls back to 3330 next week.

The impact of tariffs continues, shorting is expected to retrace📰 News information:
1. Focus on tomorrow's CPI data
2. Bowman's speech at the Federal Reserve
3. Tariff information outflows and countries' responses to tariff issues
📈 Technical Analysis:
During the weekend, the Trump administration's tariff information continued to come out, causing a large amount of funds to flow into the safe-haven market, triggering an escalation of market risk aversion. Although the collapse in the previous tariff remarks did hit the market's buying enthusiasm to a certain extent, the strong rise on Friday also stimulated the market's buying enthusiasm again. This, whether it is on the way down or on the way up, has attracted retail investors to a certain extent. As we judged on gold on Friday and the weekend, short-term bulls are undoubtedly strong. However, I think it is very dangerous to continue to chase long positions at high levels. Therefore, I tend to short-term and then consider continuing to chase long positions after the market retreats to the support level.
First of all, the CPI data will be released tomorrow. With inflation in the United States currently heating up, the Federal Reserve is undoubtedly resisting a rate cut in July. This has, to some extent, dampened the enthusiasm of bulls. Secondly, it is necessary to pay attention to the response of Europe and Japan to the tariff issue. Due to the timeliness, the current market expectations are undoubtedly limited.
In the short term, the RSI indicator is already seriously overbought. For today's operation arrangement, it is recommended to short at the rebound of 3365-3375. If the gold price continues to maintain a strong trend in the short term and breaks through this resistance area, it is time to stop loss. First of all, we should pay attention to whether 3355-3345 can be broken. Once it falls below the support of 3355-3345, we will need to see the 3330 line below, and it may even fall below 3300. Therefore, we also need to take precautions and follow up.
🎯 Trading Points:
SELL 3365-3375
TP 3355-3345
In addition to investment, life also includes poetry, distant places, and Allen. Facing the market is actually facing yourself, correcting your shortcomings, facing your mistakes, and exercising strict self-discipline. I share free trading strategies and analysis ideas every day for reference by brothers. I hope my analysis can help you.
FXOPEN:XAUUSD TVC:GOLD FX:XAUUSD FOREXCOM:XAUUSD PEPPERSTONE:XAUUSD OANDA:XAUUSD