Gold Price Setup: Bullish Continuation or Rejection? 🧠 Chart Analysis (XAU/USD – 1H):
Key Structure Highlights:
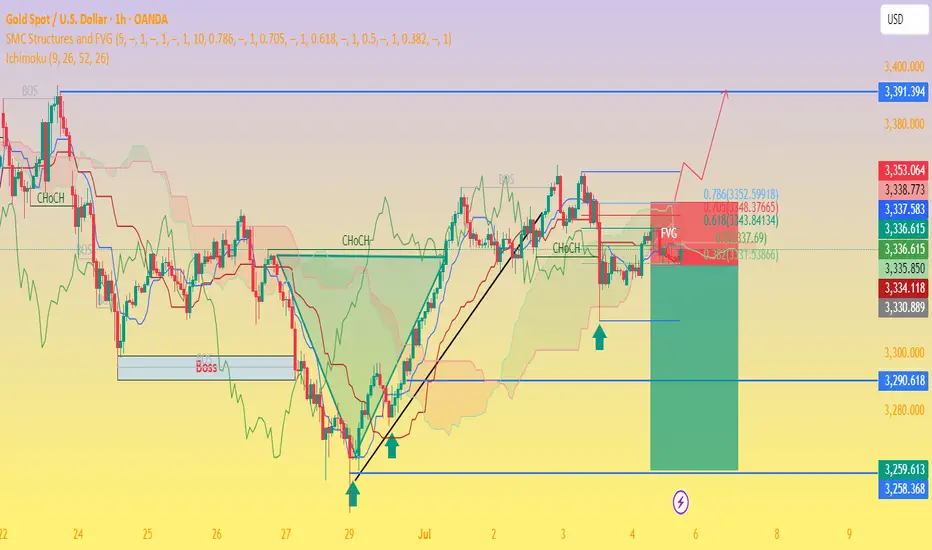
CHoCH (Change of Character) zones marked both up and down indicate a battle between bulls and bears.
Recent bullish CHoCH followed by a fair value gap (FVG) retest suggests potential continuation to the upside.
Price recently bounced strongly from demand zone, shown by the green arrows and strong candle reaction.
Ichimoku Cloud:
Price is trying to break back above the Kumo (cloud), a sign of bullish momentum building.
However, resistance is still present with the Kijun and Tenkan lines converging.
FVG (Fair Value Gap):
The current price is attempting to fill and break above the FVG zone.
A successful breakout above this area confirms bullish intention.
Fibonacci Levels:
Price is hovering around the 0.5 - 0.618 retracement zone, often a strong reversal or continuation point.
Upside targets lie near the 0.786 retracement (3352) and ultimate target at 3391, a major resistance level.
Risk Management:
Trade setup shows an excellent Risk:Reward ratio.
Stop-loss placed just below the last structure low.
Potential downside to 3290–3258 if breakout fails.
🟢 Possible Next Move:
Bullish Scenario: If price clears the FVG and breaks above 3353, expect continuation to 3391.
Bearish Rejection: If rejected at FVG/0.618 level, watch for a drop back to 3290 or even 3259.
Xauusdsignal
The shock continues, and the retracement continues to go long📊 Gold Day Trading Strategy (Recommendation index ⭐️⭐️⭐️⭐️⭐️)
📰 News information:
1. The lasting impact of new tariffs
2. The impact of geopolitical conflicts
3. The Fed’s interest rate cut
📈 Technical Analysis:
From the hourly chart, gold has formed a head and shoulders bottom. At present, 3320 below has formed a certain support in the short term. For now, the daily line still cannot close below 3320. If the daily line closes below 3320, the decline may open further. On the contrary, the current upper suppression position of gold is near 3350. If the daily line stands above 3350 again, it will be a bull-dominated trend and may test 3380-3390 above. In the short term, pay attention to the support line of 3325-3315 below. If it retreats to the support level, you can consider going long. Look to the resistance range of 3340-3350 above, and pay special attention to the suppression line of 3365-3370. At the same time, if the European session is always suppressed below 3345 and sideways, there is no performance, so you should consider selling it, and there may be further retreat in the evening.
🎯 Trading Points:
BUY 3330-3325-3315
TP 3340-3350-3365
In addition to investment, life also includes poetry, distant places, and Allen. Facing the market is actually facing yourself, correcting your shortcomings, facing your mistakes, and exercising strict self-discipline. I share free trading strategies and analysis ideas every day for reference by brothers. I hope my analysis can help you.
TVC:GOLD OANDA:XAUUSD FXOPEN:XAUUSD FX:XAUUSD FOREXCOM:XAUUSD PEPPERSTONE:XAUUSD
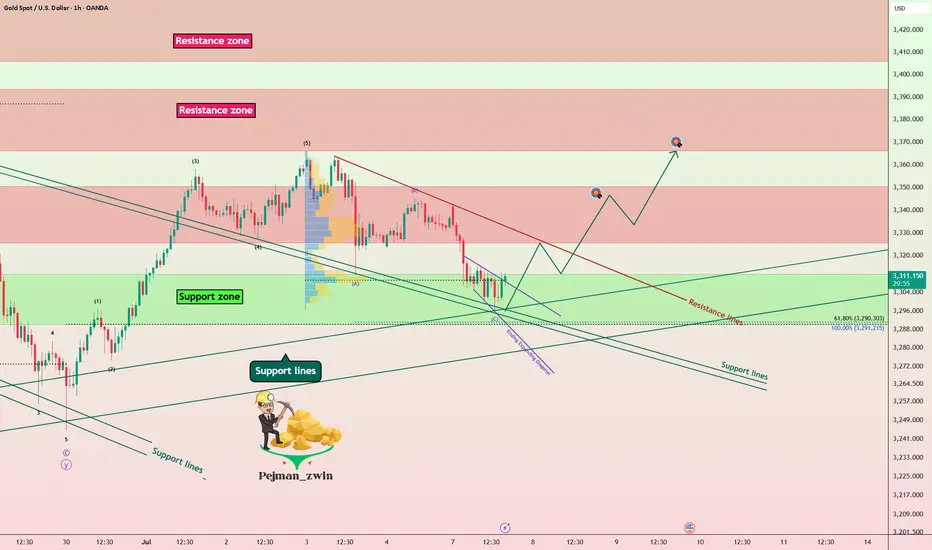
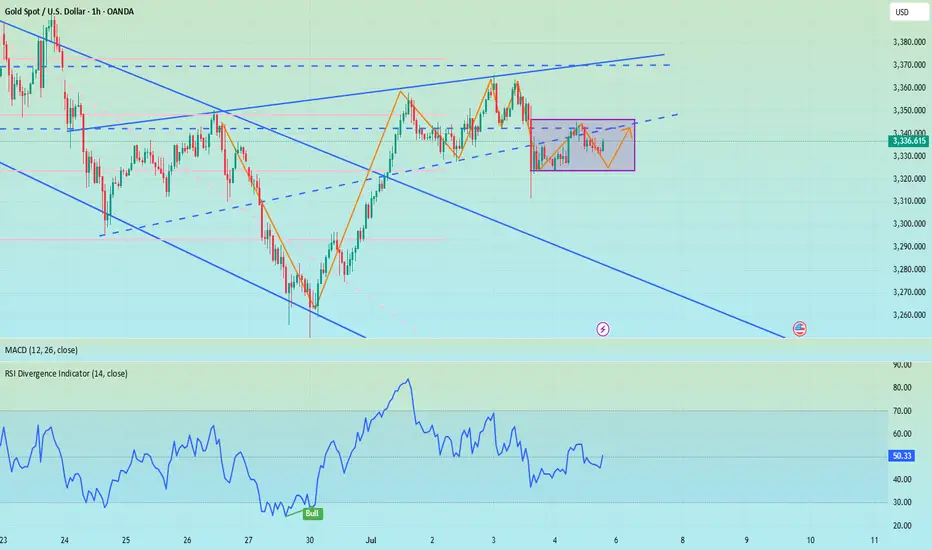
Gold Finds Supports – Is the Rebound About to Begin?Gold ( OANDA:XAUUSD ) declined to the Support zone($3,312-$3,290) and Support lines as I expected in the previous idea .
Gold is currently trading in the Support zone($3,312-$3,290) and near a set of support lines .
In terms of Elliott Wave theory , it seems that Gold has completed the Zigzag Correction(ABC/5-3-5 ) and we should wait for the next 5 impulse waves . One of the confirmation signs of the end of these corrective waves could be the break of the resistance line .
I expect Gold to trend higher in the coming hours and rise to at least $3,343 AFTER breaking the Resistance line .
Second Target: $3,364
Note: Stop Loss (SL) = $3,287
Gold Analyze (XAUUSD), 1-hour time frame.
Be sure to follow the updated ideas.
Do not forget to put a Stop loss for your positions (For every position you want to open).
Please follow your strategy; this is just my idea, and I will gladly see your ideas in this post.
Please do not forget the ✅ ' like ' ✅ button 🙏😊 & Share it with your friends; thanks, and Trade safe.
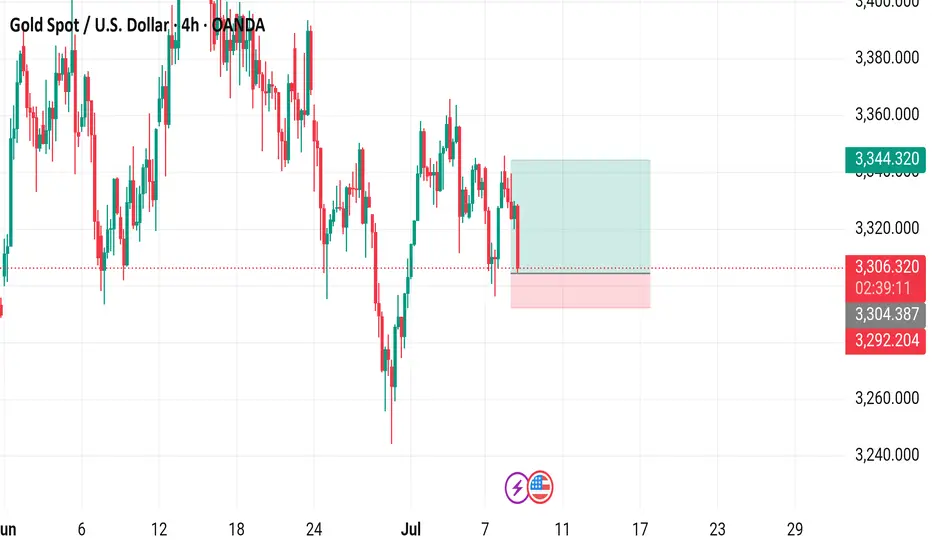
Gold Spot / U.S. Dollar (XAUUSD) 4-Hour Chart - OANDA4-hour chart from OANDA displays the price movement of Gold Spot (XAUUSD) against the U.S. Dollar. The current price is $3,805.780, reflecting a decrease of $30.660 (-0.92%). Key levels include a sell price of $3,305.390 and a buy price of $3,305.940. The chart highlights recent volatility with a shaded area indicating a potential support or resistance zone around $3,344.320. The time frame spans from late June to early July 2025, with the latest data point at 02:41:15 on July 8, 2025.
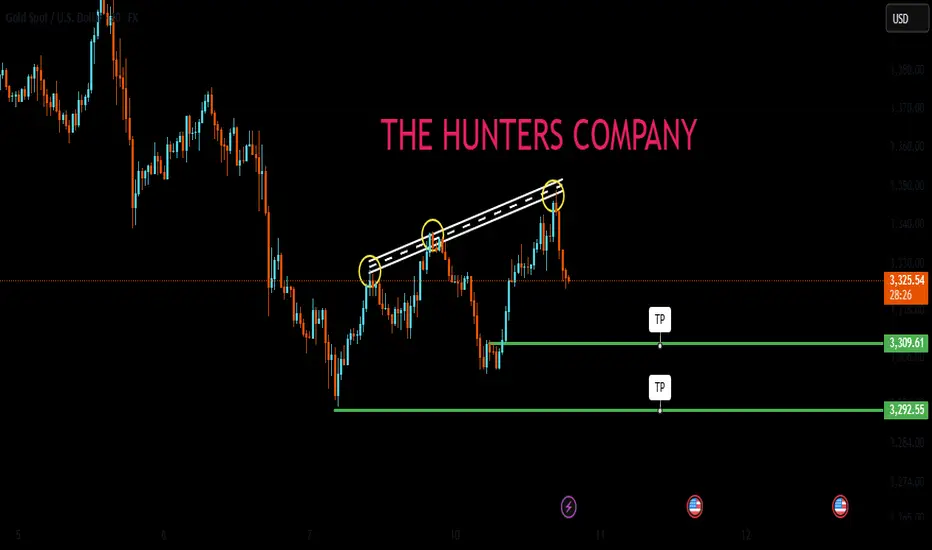
Setupsfx_ | XAUUSD(Gold):07/07/2025 Update | Gold dropped nicely when the market opened last night, dropping around 600 pips. However, it couldn’t hold on to the gains and came right back to the selling zone. There are two entry points and two potential targets.
Good luck and trade safely!
Team Setupsfx_
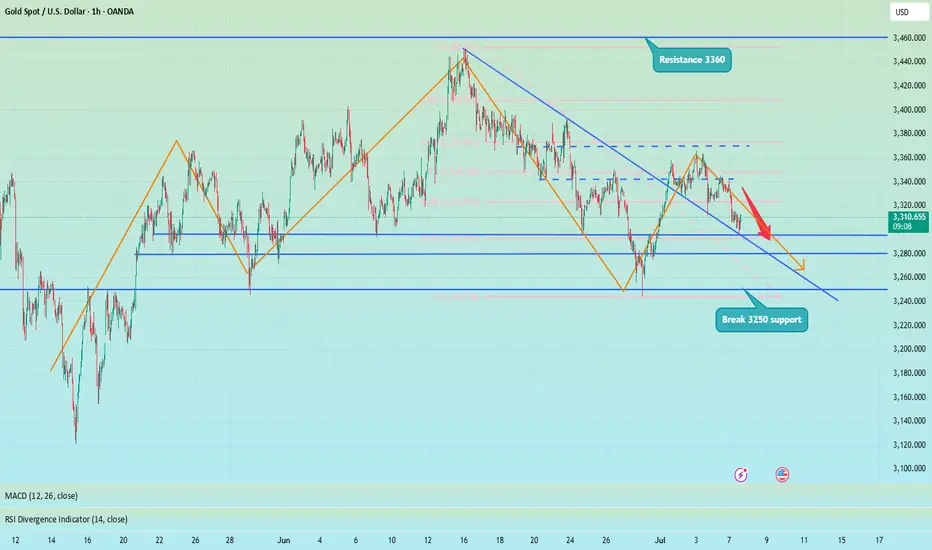
Gold is expected to regain bullish momentum and continue to 3360Yesterday, gold rebounded from 3296 and was able to reach around 3345. Although the process was rather painful, we have to admit that gold bulls still have the energy to wrestle with bears, and the gold market is not one-sidedly dominated by bears. As gold gradually tested and confirmed the effectiveness of support during the retracement process and then rebounded effectively, the short-term structure of gold gradually changed and began to favor bulls.
After gold hit bottom and rebounded yesterday, we can clearly see from the short-term structure that gold has successfully constructed a head and shoulders bottom structure in the three areas of 3295-3244-3296 in the short term, thus playing an absolute supporting role in the structure; and in the process of repeated testing of gold, there are signs of constructing a head and shoulders bottom structure in the three areas of 3310-3296-3325 locally again. Under the effect of the structural support resonance of the head and shoulders bottom, gold may not go below 3320 again, and may even regain the bullish trend and continue to the 3345-3355 area.
So I think there is a lot of profit potential in going long on gold. We can go long on gold with the 3330-3320 area as support and look towards the target area: 3340-3350-3360
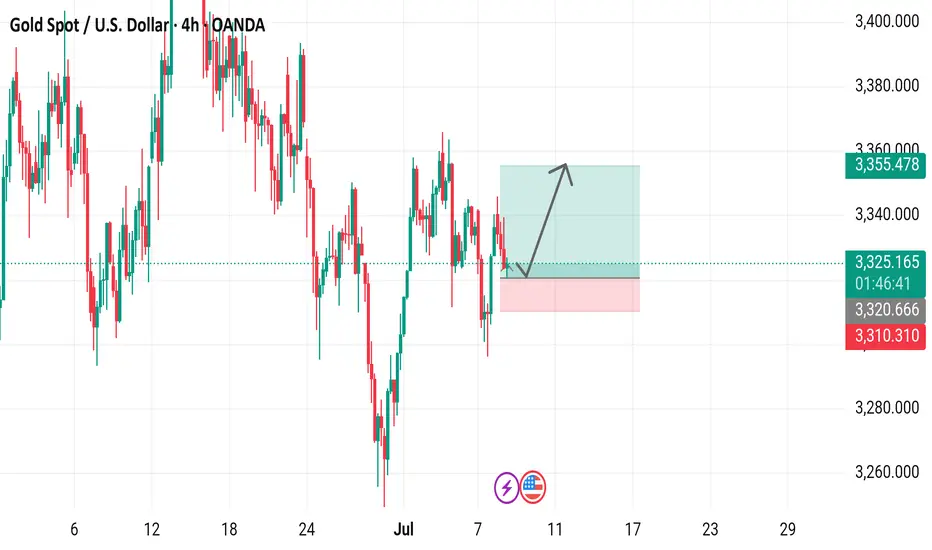
Gold Spot / U.S. Dollar (XAU/USD) 4-Hour Chart4-hour chart from OANDA displays the recent price movement of Gold Spot (XAU/USD) against the U.S. Dollar. The current price is $3,325.120, reflecting a decrease of $11.320 (-0.34%). The chart highlights a recent upward trend with a buy signal at $3,325.410 and a sell signal at $3,324.830, indicating a potential trading range. A shaded area suggests a possible price target or support/resistance zone around $3,355.478, with historical price levels marked on the right side. The timeframe covers the period around July 7-8, 2025.
4‑Hour Technical Framework- 8th July 2025Current Price: ~$3,330
Timeframe Focus: 4‑Hour and 1‑Hour
Directional Bias: Neutral-to-Bearish
Methodologies Used:
✅ Price Action, Fibonacci Levels, Support & Resistance
✅ Supply & Demand Zones
✅ ICT / Smart Money Concepts (BOS, CHoCH, Liquidity, OB, FVG)
4‑Hour Market Structure Analysis
Gold has shifted into a neutral-to-bearish regime on the 4‑hour timeframe, after a decisive Break of Structure (BOS) below prior swing lows at ~$3,345 and a clear Change of Character (CHoCH) as bulls failed to sustain above the ~$3,350 level. Price currently hovers around ~$3,330, consolidating within a bearish Fair Value Gap (FVG) left by the recent impulsive drop.
Key Observations:
A liquidity grab above $3,349 (stop sweep) preceded a sharp reversal, validating this as a sell-side liquidity zone.
The 4H supply zone / bearish Order Block (OB) at $3,345–$3,350 remains unmitigated and likely to attract sellers.
Immediate downside is cushioned by a 4H demand zone & FVG at $3,300–$3,305, which has acted as support during the prior dip.
A deeper daily demand zone rests around $3,280–$3,290, which aligns with historical support and unmitigated buy‑side liquidity.
Key 4‑Hour Levels to Watch
Price Level Type Notes
$3,360–$3,365 Supply / Fib 61.8% Strong resistance
$3,345–$3,350 Supply / OB + 50% Fib Primary sell zone
$3,330–$3,334 Bearish FVG Active imbalance
$3,300–$3,305 Demand / FVG Primary buy zone
$3,280–$3,290 Demand (daily OB) Secondary buy zone
The neutral-to-bearish bias is reinforced by the fact that price has failed to reclaim prior support and continues to respect supply zones.
1‑Hour Intraday Trade Ideas
Zooming into the 1‑hour chart, we align intraday setups with the broader 4H directional bias: selling into supply and covering into demand.
Setup 1: Short at 4H Imbalance
Entry: ~$3,332–$3,334 (inside active FVG)
Stop-Loss: Above $3,335
Targets:
TP1: $3,305
TP2: $3,280
Confluences: BOS + CHoCH, 4H FVG, sell‑side liquidity above.
Setup 2: Short on Retracement
Entry: ~$3,345–$3,350 (50% Fib + OB)
Stop-Loss: Above $3,352
Targets: Same as Setup 1.
Setup 3: Aggressive Long (Countertrend)
Entry: ~$3,300–$3,305 (demand + FVG)
Stop-Loss: Below $3,295
Target: $3,327
Note: Only valid if strong bullish reaction occurs in demand.
The Golden Setup
Sell at ~$3,332–$3,334 (active 4H imbalance) with a target of $3,300.
This setup offers maximum confluence — bearish FVG, BOS, and supply rejection — with tight risk parameters and favorable reward/risk ratio.
Summary Table
Bias Levels of Interest
Directional Bias Neutral-to-Bearish
Strong Sell Zones $3,330–$3,334 and $3,345–$3,350
Strong Buy Zones $3,300–$3,305 and $3,280–$3,290
Closing Notes
Gold continues to respect Smart Money footprints on the 4‑hour chart, suggesting more downside unless bulls reclaim $3,350 decisively. Today’s focus remains on short opportunities at premium levels into supply and imbalances, targeting well‑defined demand areas below.
Watch price action closely in the $3,332–$3,334 zone for the highest‑probability short entry of the session — The Golden Setup.

XAUUSD Outlook: How Risk Sentiment Could Shape the Next MoveI’m currently analysing XAUUSD (Gold) 🟡, which has come under bearish pressure 📉, showing signs of downside momentum. In the video 🎥, we also explore the inverse correlation between Gold and risk assets like the NASDAQ 📊.
Keep a close eye on NASDAQ movements—if risk assets break bullish 🚀, we may see further weakness in Gold. On the other hand, if risk sentiment shifts and risk assets break bearish 🛑, Gold could attract safe-haven demand and gain strength 💪.
We also dive into the price action, market structure, and pull up the volume profile 🧩. Gold is currently trading around the Point of Control (POC) ⚖️—a key level where significant volume has accumulated. A clean break above or below this area could act as a technical trigger for the next move 📈📉.
As always, this is not financial advice ⚠️—just my market view.

GOLD H2 Intraday Chart Update for 8 July 2025Hello Traders
Gold is still in a range between 3300 - 3350 Psychological level, all eyes on breakout of both mentioned psychological levels for now
Intraday Strong support zone is located 3290-3300
Intraday Strong Resistance zone is located 3350-3360
US TARIFF WAR remains agenda for now
Disclaimer: Forex is Risky

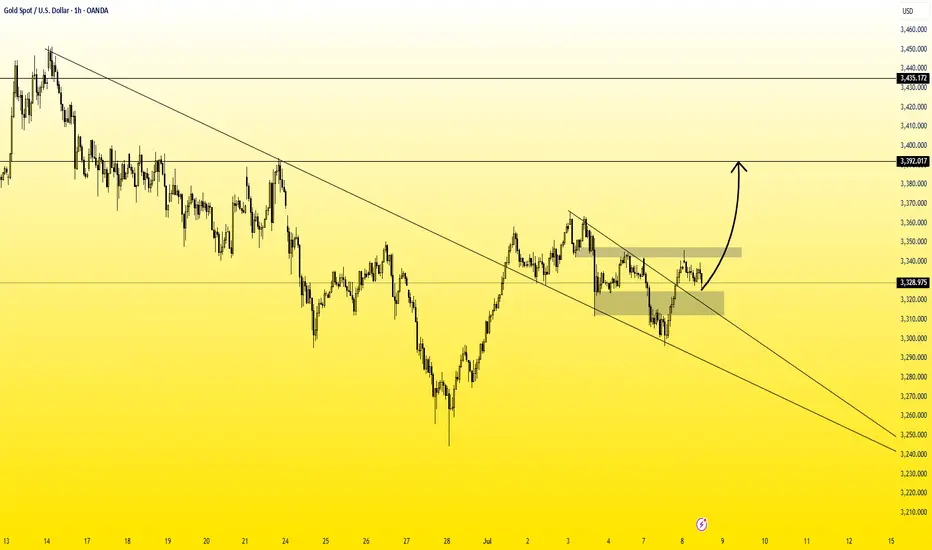
XAUUSDHello traders,
Today we're taking advantage of a great buying opportunity on the XAUUSD pair. This setup is ideal for both medium- and long-term positions. I anticipate that the price will rise toward the 3392.82 USD level in the coming weeks.
That’s why I’ve positioned this trade as a medium-term opportunity.
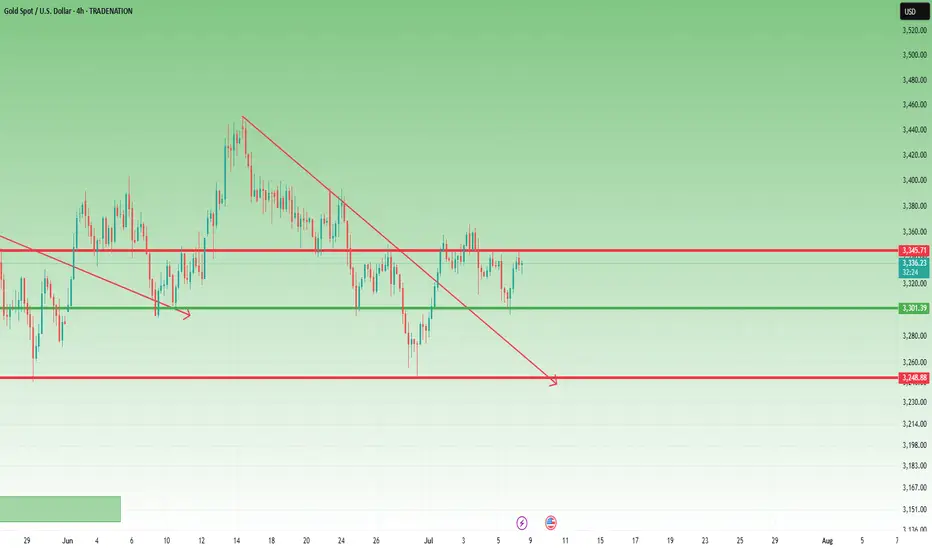
Gold Reverses with a Pin Bar – Is the Drop Over?📈 What happened yesterday on Gold (XAU/USD)?
Gold had a tricky session – during the early hours it dipped just below 3300, testing support. But by the New York session, bulls stepped in strongly, pushing price back up and closing near the daily highs. The result? A strong daily Pin Bar with a long tail, signaling possible bullish reversal.
________________________________________
❓ Is the drop over, or will the market fake out again?
That's the big question now. Yesterday’s close definitely leans bullish, but we need to see confirmation.
________________________________________
📌 Why a continuation to the upside is possible:
• Price rejected sub-3300 levels pretty strongly.
• A daily Pin Bar formed, signaling buyer strength.
• A break above yesterday’s high would confirm bullish intent.
• 3390–3400 is the next key resistance zone on the radar.
________________________________________
🧠 My trading plan:
I closed my short near break-even – no need to fight the price action. Now I'm patiently waiting for a clean break above yesterday’s high to enter long trades, aiming for the 3390–3400 resistance area.
Disclosure: I am part of TradeNation's Influencer program and receive a monthly fee for using their TradingView charts in my analyses and educational articles.
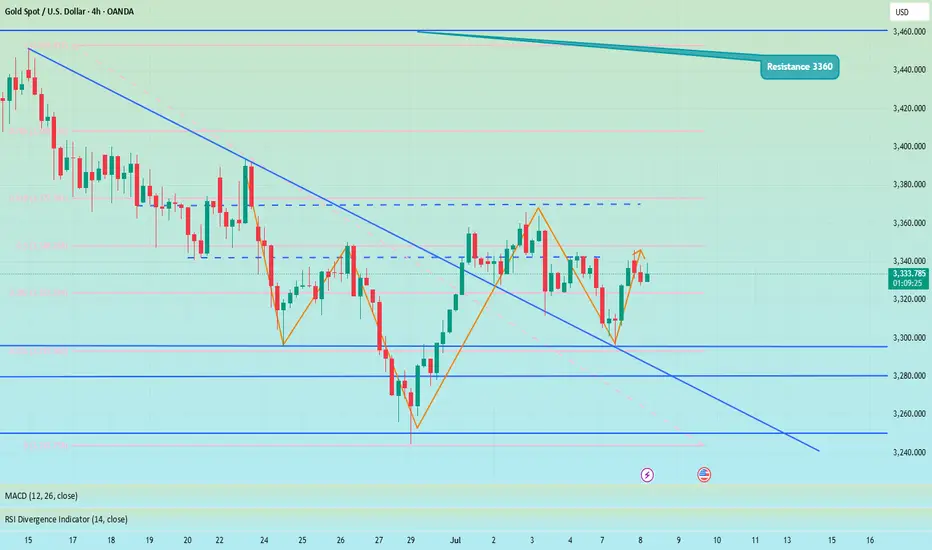
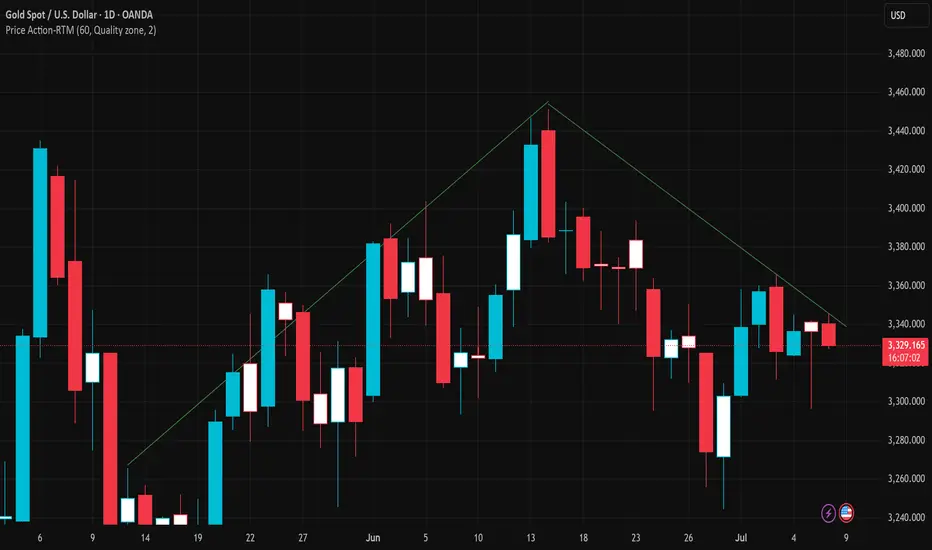
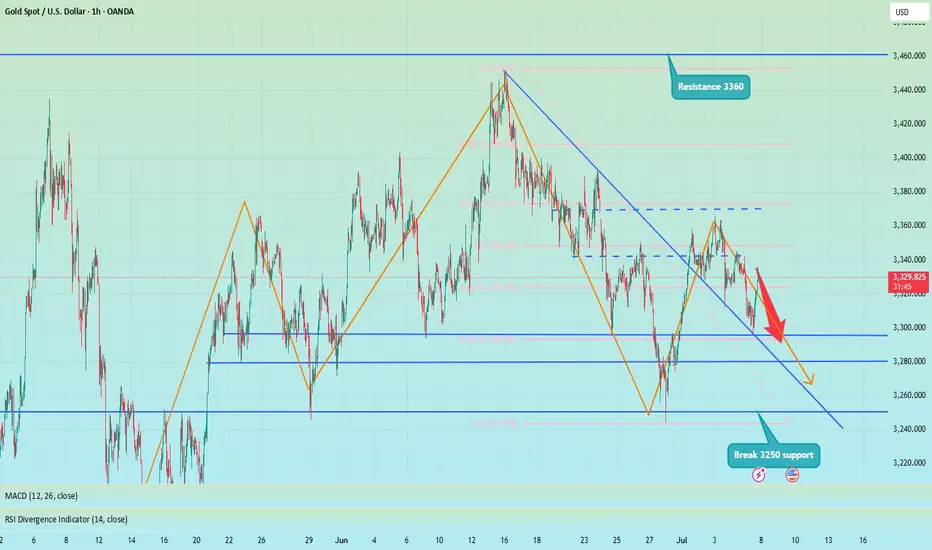
XAUUSD D1 – Gold Under Long-Term Bearish PressureGold is currently trading around 3,328 USD after failing to break above the descending trendline that started from the mid-June peak. On the chart, the price forms a series of lower highs and lower lows — a classic signal of a medium-term downtrend.
The descending trendline (green) acts as dynamic resistance. Each time price approaches it, strong selling pressure pushes it back down, showing sellers are in control.
In the short term, the 3,300 – 3,310 USD area serves as immediate support. If this zone is broken, price could drop further toward the major support zone around 3,260 – 3,270 USD.
Conversely, a confirmed reversal would only be valid if price breaks above the descending trendline and closes sustainably above 3,371 USD — a historically significant distribution zone.
The most recent daily candle is a small-bodied red candle with a long lower wick, indicating weak buying pressure and market indecision — typical in a consolidation phase before further downside.
Strategy Summary:
Favor short positions on pullbacks to the descending trendline.
Avoid bottom-fishing until a confirmed breakout above major resistance.
Traders should monitor the 3,300 USD zone closely in upcoming sessions.
Note: The analysis above is for informational purposes only and does not constitute investment advice. Stay tuned for further updates and adjust your trading plan accordingly.
What’s your take on the next move for gold? Share your thoughts in the comments!
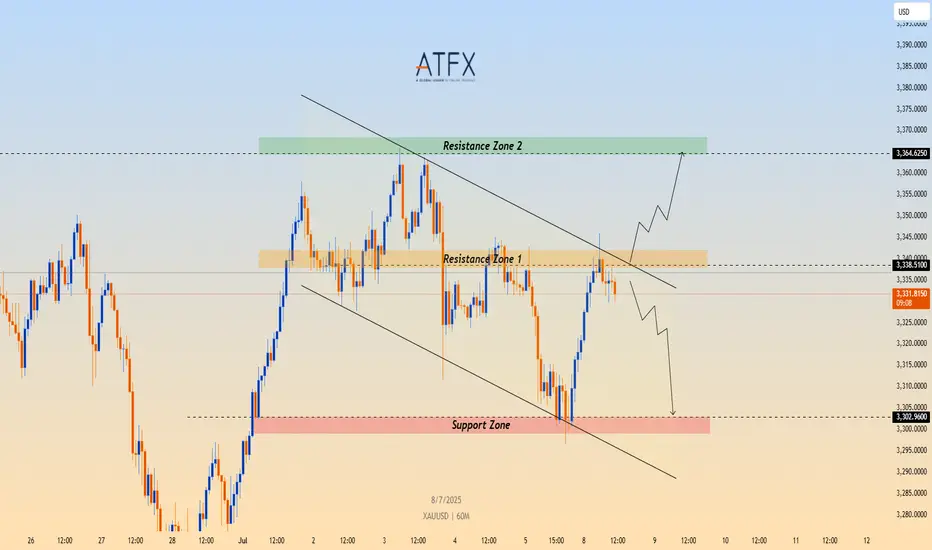
XAU/USD Eyes Key Resistance Amid Fresh Tariff Fears🟡 TVC:GOLD Gold Price Forecast: XAU/USD Eyes Key Resistance Amid Fresh Tariff Fears
OANDA:XAUUSD Spot gold (XAU/USD) is recovering from intraday lows near $3,296, now trading around $3,330 as fears over renewed U.S. tariffs fuel safe-haven demand. President Trump has begun issuing formal letters announcing fresh import tariffs—25% on South Korea, additional measures on Japan, and a 10% universal tariff on countries aligning with BRICS. With the 90-day tariff pause expiring August 1 and no trade progress in sight, geopolitical and economic uncertainty continue to support gold’s floor.
📉 Technical Structure
XAU/USD remains within a descending channel on the 1H chart, with price currently approaching the $3,338–$3,340 Resistance Zone 1. A clean breakout above the upper channel boundary could trigger a move toward the broader $3,364 Resistance Zone 2. Conversely, failure to break above Resistance Zone 1 would keep the bearish channel intact, with downside targets toward the $3,302–$3,305 support zone.
📌 Key Technical Zones
Resistance Zone 1: $3,338–$3,340
Resistance Zone 2: $3,364
Support Zone: $3,302–$3,305
Channel Structure: Bearish unless broken to the upside
📘 Strategy Summary
XAU/USD is showing signs of short-term recovery, but remains technically capped unless it breaks through $3,340 resistance. As long as the descending channel holds, rallies may be sold into. A confirmed break above $3,340 could shift bias toward $3,364, while rejection may reopen the path to $3,305 and potentially lower.
⚠️ Disclaimer
This analysis is for informational purposes only and does not constitute investment advice. Please consult a licensed financial advisor before making trading decisions.
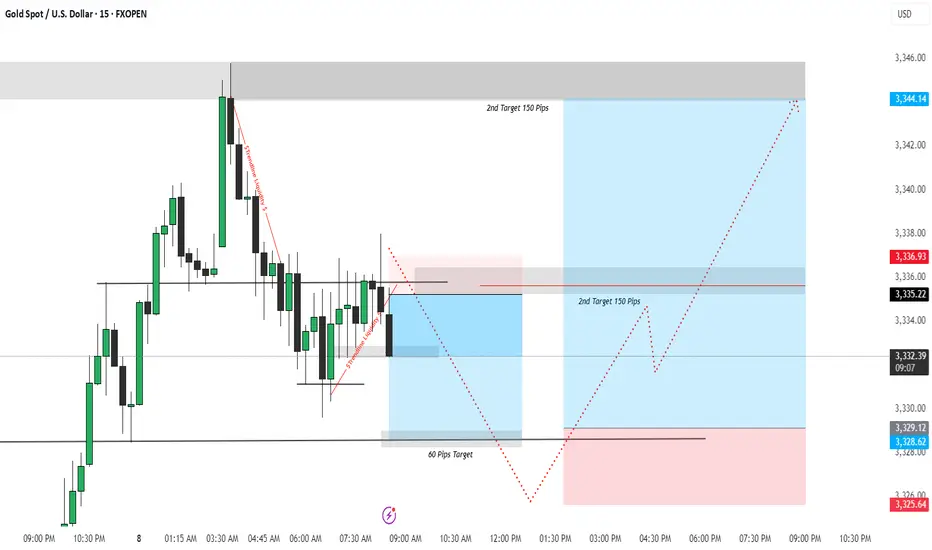
XAUUSD - Liquidity Sweep & Smart Money Play | Dual Setup BreakdoFOREXCOM:XAUUSD
Liquidity Sweeps
Smart Money Concepts (SMC)
Trendline Liquidity
Demand/Order Blocks
Risk-Reward Structure
🔻 First Trade Idea – Short Position (Sell Setup)
🧠 Psychology & Liquidity Insight:
The market formed equal lows before a sudden rally which attracted retail traders.
Price created a bearish structure with lower highs, signaling weakness.
A strong liquidity sweep occurred by breaking trendline liquidity twice (as shown by red lines), targeting early buyers' stop losses.
A supply zone (red box) was respected near 3337, providing an ideal entry point for shorting.
📉 Trade Logic:
Entry: Near 3336.93 (Supply Zone)
SL: Above 3344.14 (Liquidity Sweep zone)
TP: 3328.62 / 3325.64 (Targeting demand imbalance & internal liquidity)
R:R: Approx. 1:2+
🔺 Second Trade Idea – Long Position (Buy Setup)
🧠 Psychology & Liquidity Insight:
After the initial selloff, price taps into the demand zone (blue box) created by the last impulsive move.
Internal liquidity is built again near 3328–3330, where retail traders expect a continued fall — ideal for smart money to reverse.
Price is expected to accumulate and reverse with a strong rally toward the upper liquidity resting above 3344.
📈 Trade Logic:
Entry: Near 3328.62 (Demand Zone Tap)
SL: Below 3325.64
TP: 3344.14 (Major Liquidity Target)
R:R: Over 1:3 – a high-quality reversal play.
🎯 Why This Trade Setup is Powerful:
✅ Both trades are liquidity-driven, not just indicator-based.
✅ Incorporates smart money logic and price structure.
✅ Clear risk-to-reward, validated by price behavior and institutional order flow.
Shorts trapped? No, the head and shoulders top is still downOver the weekend, I gave a trading strategy for going long at 3315-3305. Today, I updated and optimized the long order trading, maintained the high-short-low-long trading strategy, and began to rebound near the 3300 line, and successfully touched the long TP 3333. At present, I am executing short trades again according to the trading strategy and holding short orders.
Although gold has only retreated to around 3330, I am not worried about losses and failures in short trades. As I wrote in today's post, the daily K-line chart has a head and shoulders top pattern. As long as the bulls fail to recover 3360, it is still a short trend. Therefore, in the short term, I still think that the rebound is a good opportunity for us to go short.
At present, the short-term bullish momentum of gold has been consumed and the downward trend continues. Therefore, I still insist on holding short orders in the short term.
In addition to investment, life also includes poetry, distant places, and Allen. Facing the market is actually facing yourself, correcting your shortcomings, facing your mistakes, and being strict with yourself. I share free trading strategies and analysis ideas every day for reference by brothers. I hope my analysis can help you.
FXOPEN:XAUUSD PEPPERSTONE:XAUUSD FOREXCOM:XAUUSD FX:XAUUSD FXOPEN:XAUUSD OANDA:XAUUSD TVC:GOLD
90-day tariffs expire, how to position gold next week📰 News information:
1. 90-day tariffs are about to expire
📈 Technical Analysis:
With the Trump administration's massive tax cut and spending bill officially implemented, the U.S. Treasury may start a "supply flood" of short-term Treasury bonds to make up for the trillions of dollars in fiscal deficits in the future. Concerns about the oversupply of short-term Treasury bonds have been directly reflected in prices. The yield of 1-month short-term Treasury bonds has risen significantly since Monday this week. Slowing wage growth, falling total work hours, stagnant wage income growth and concerns about consumer spending are all signs that support gold.
From a technical perspective, Friday's closing long shadow small candle body, the price closed at a high of 3345 and a low of 3224. The overall idea for next week is to follow the trend and rely on the first short-term support of 3323 below to participate in long positions. Secondly, 3315-3305 is given below. If the support point is lost, then 3300 below is also in danger, and there is no need to overly insist on continuing to do more at low levels in the short-term rhythm. The key pressure above is 3340-3350, and the limit is the pressure of 3360 above.
🎯 Trading Points:
BUY 3325-3323
TP 3333-3340-3350
BUY 3315-3305
TP 3325-3333-3340
In addition to investment, life also includes poetry, distant places, and Allen. Facing the market is actually facing yourself, correcting your shortcomings, confronting your mistakes, and strictly disciplining yourself. I hope my analysis can help you🌐.
FXOPEN:XAUUSD PEPPERSTONE:XAUUSD FOREXCOM:XAUUSD FX:XAUUSD OANDA:XAUUSD TVC:GOLD
GOLD TODAYHello friends🙌
🔊Due to the weakness of buyers and the strength of sellers, the price continues to fall...
We have identified two supports for you that will not be seen if the price continues to fall, and if the selling pressure increases, we will update you.
🔥Join us for more signals🔥
*Trade safely with us*
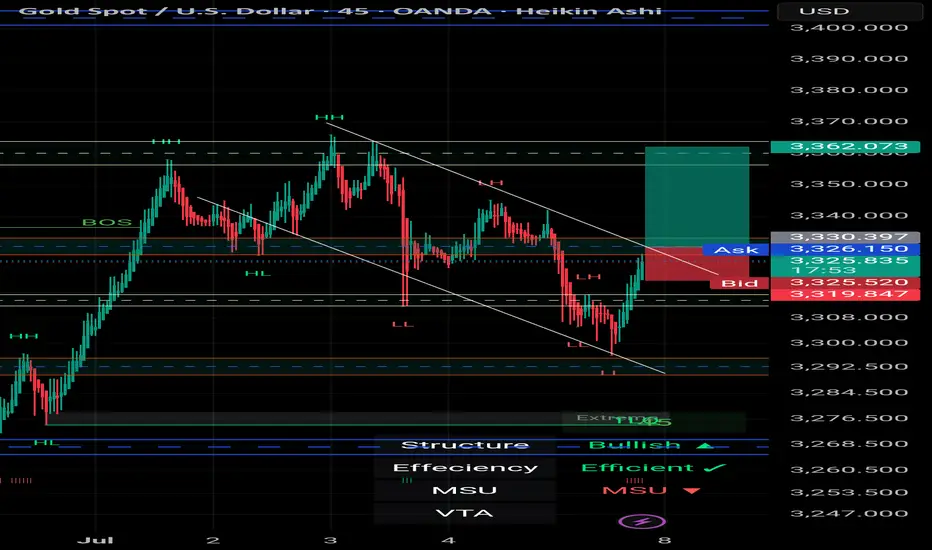
XAU/USD – 45-Minute Chart Breakdown **Date:** July 7, 2025 # 📊 XAU/USD – 45-Minute Chart Breakdown
**Date:** July 7, 2025
**Current Price:** $3,326.97
**Bias:** 📈 Bullish Breakout
---
## 🔹 Key Market Structure:
- **Trendline Breakout**: ✅
Price broke cleanly out of the descending trendline that had held since the $3,362 high.
- **LL → HL Shift**:
The structure is transitioning from Lower Lows to potential Higher Lows (HL) – a strong sign of **reversal**.
- **BOS Zone** (Break of Structure):
BOS has been confirmed; further upside is now **probable**.
---
## 🔸 Trade Zone:
| Type | Level | Description |
|------------|------------|--------------------------|
| **Entry** | ~$3,326 | Breakout confirmation 🔓 |
| **SL** | ~$3,319 | Below recent HL 🛡️ |
| **TP1** | $3,362 | Top of previous range 🎯 |
| **TP2** | $3,385+ | Momentum extension 📈 |
---
## 📌 Indicators & Labels:
- **Structure:** `Bullish` 🟢
- **Efficiency:** `Efficient` ✅
- **MSU:** Bearish (short-term countertrend, being invalidated)
- **VTA:** Active ⚡️
---
## 🧠 Strategy Note:
This breakout is occurring **after a full liquidity sweep** and a **strong bullish reaction** off the $3,290s. Volume is supporting the move and **confluence** builds toward continuation.
> 💬 *"The best trades come when structure, liquidity, and timing converge."* – Let's ride this wave with confidence.
---
### 👑 For Persian Princes of the Market 🇮🇷
We don’t guess. We **track, adapt, and lead**.
---
## 🟢 Potential Breakout from the Descending Channel
As observed in the **45-minute timeframe**, Gold (XAU/USD) has been respecting a classic **descending channel** formed by a sequence of Lower Highs (LH) and Lower Lows (LL), leading to an overall bearish structure.
However, in the latest candles, price has **broken above the upper boundary of the channel**, signaling a potential shift in market structure.
---
### 🔍 Technical Highlights:
- ✅ **Breakout above the channel** = First sign of bullish reversal
- ✅ **Formation of Higher Low (HL)** after a strong rally = Added confirmation
- ✅ **Efficient bullish move** with momentum pushing toward previous Highs
---
### 🎯 Forecast Scenario:
If price holds above the breakout zone (around **$3,327**), we can expect a bullish continuation toward:
- 🥇 **Target 1:** $3,362
- 🥈 **Target 2:** $3,385+
A **successful retest** of the broken channel would serve as a powerful confirmation for this setup.
---
> ⛳️ *This move reflects not just a breakout — but a disciplined journey through structure, liquidity, and price behavior. Pure technical elegance.*
> — *Mohsen Mozafari Nejad*
---
📈 **Structure:** Bullish
⚡️ **Momentum:** Efficient
🕰 **Timeframe:** 45 Min
💰 **Current Price:** ~$3,327
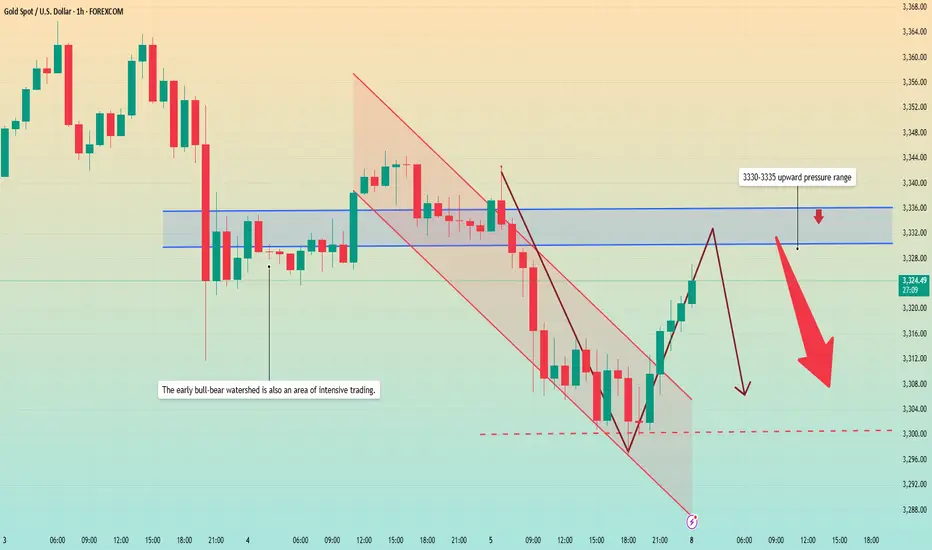
Gold rebounded from the bottom. Is the decline over?Gold prices faced selling pressure in today's Asian market. The price fell from 3343 to around 3320 in the early Asian session. The European price continued to fall, reaching a low of around 3296, and then rebounded upward. The current price is fluctuating around 3320.
Most investors will focus on the minutes of the Federal Open Market Committee (FOMC) meeting to be released on Wednesday to get guidance on the trend.
From the hourly chart, the upper pressure position is constantly being corrected. The current average pressure value is around 3330-3335. At the same time, this position is also the watershed between long and short positions in the previous dense area. The price may rebound to this position again. The lower support level is in the range of 3300-3290.
Quaid believes that the current market is still showing a downward trend, and the price may fall back below 3300 again.
Operation strategy:
Short around 3330, stop loss 3340, profit range 3310-3300, sustainable ownership after breakthrough.
XAUUSD:Go long
Gold prices fell back in Asian trading on Monday, as they digested Friday's negative data. The short term may be partial shock, but the medium and long term news surface uncertainty or to provide support for gold prices, so trading ideas, retracement to do long can.
Trading Strategy:
Both 3300 and 3308 can be used to enter the long position, short-term traders can look at 3325-30, followed by 50 around.
For intermediate traders, the target sees 3365-70 unchanged, and the retracting of 3300/3310/3330 is an opportunity to go long.
More detailed strategies and trading will be notified here ↗↗↗
Keep updated, come to "get" ↗↗↗

7/7: Key Zone – 3320 to 3350Good morning, everyone!
Due to the U.S. market closure on Friday, price movement remained relatively subdued, and the week concluded with modest gains. As of this morning, gold opened higher but has since pulled back, and the price remains in a consolidation phase.
Key technical levels for today:
Resistance: around 3350
Support: near 3321
Short-term traders may focus on range-bound strategies between these levels. If a breakout occurs, follow the trend accordingly:
If price breaks above and stabilizes above 3338, the market may shift its focus toward the 3400 psychological level;
If price drops below and holds under 3332, there’s potential for a retest of the 3260 support zone.
In terms of broader trend analysis, the MA20 and MA60 on the daily chart should be watched closely, as they currently serve as key dynamic resistance and support levels.
Lastly, stay alert to any developments related to trade tariffs, as such news may significantly impact market sentiment and gold price direction.

Gold fluctuates, beware of rebound caused by new tariffs📊 Gold Day Trading Strategy (Recommendation index ⭐️⭐️⭐️⭐️⭐️)
📰 News information:
1. 90-day tariffs are about to expire
2. New unilateral tariffs
3. Geopolitical situation
📈 Technical Analysis:
As I said this morning, shorting gold is divided into two times, the first time is near 3324, and the second time is at 3340 or 3345. If there is a short-term retracement after breaking through 24, you can follow up with a long order to look at 3335-3340. If gold is in a very weak state, you can consider shorting near 3315 and look at 3300. Because during the European session, 3300 has strong support, and the European session repeatedly tests this support. If it falls below 3300, we will go to 3295-3285, or even 3250. But at the same time, we need to pay attention to the rebound of gold that may be caused by tariff policies and geopolitical situations.
🎯 Trading Points:
SELL 3315-3325-3335
TP 3305-3295-3285
BUY 3290-3285
TP 3300-3310-3320
In addition to investment, life also includes poetry, distant places, and Allen. Facing the market is actually facing yourself, correcting your shortcomings, facing your mistakes, and being strict with yourself. I share free trading strategies and analysis ideas every day for reference by brothers. I hope my analysis can help you.
TVC:GOLD OANDA:XAUUSD FX:XAUUSD FOREXCOM:XAUUSD PEPPERSTONE:XAUUSD FXOPEN:XAUUSD