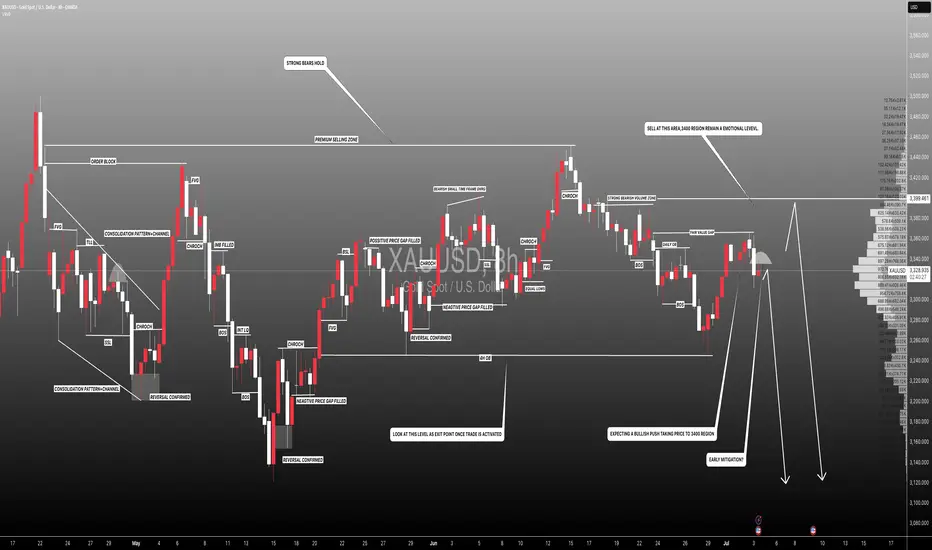
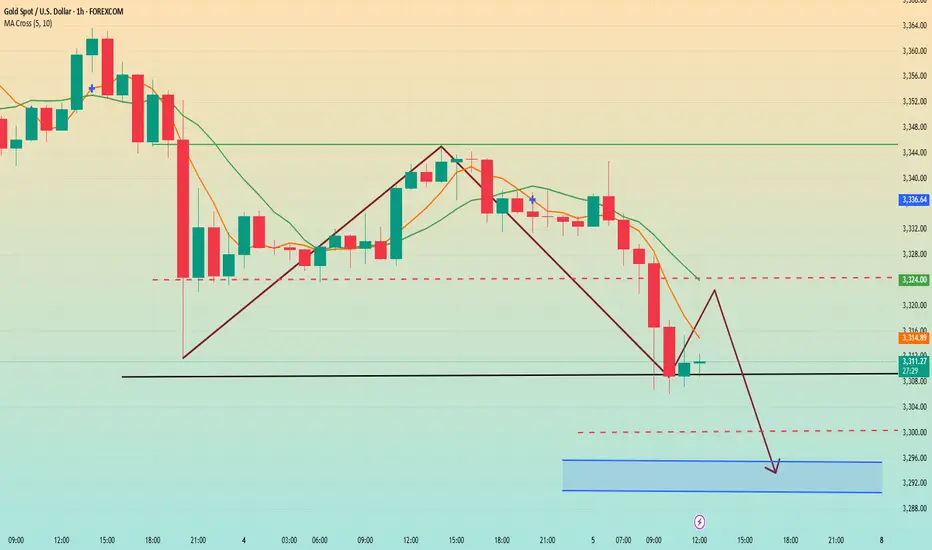
#XAUUSD: Early Mitigation Or Sellers Trap! Let's See Gold dropped after touching 3365 taking price to 3318.Currently ranging market showing confusion over how gold would react to NFP data which is coming out tomorrow. At this moment we are quite certain that price would drop tomorrow either from entry one or entry two. Please use accurate risk management while trading.
Good luck and trade!
Team Setupsfx_
Xauusdsignal
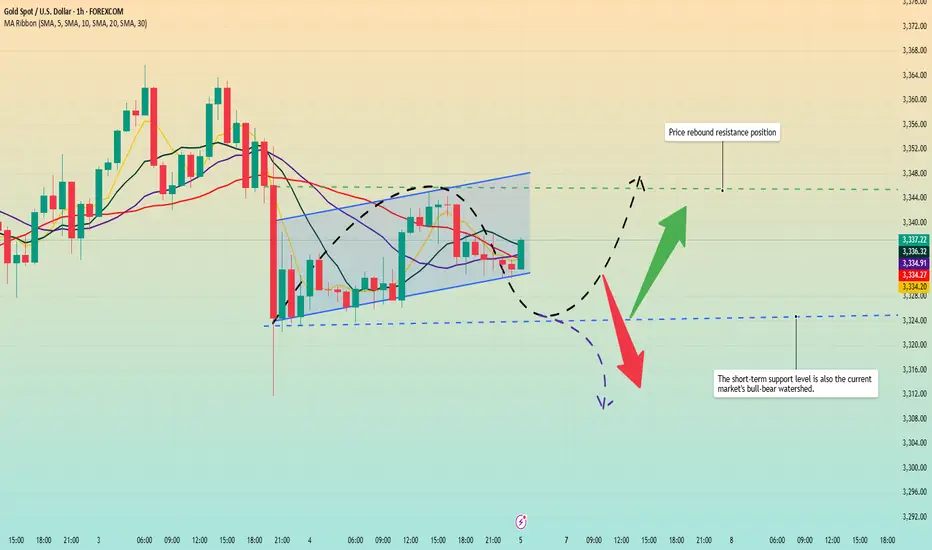
XAUUSDGold continued to fall at the opening today, currently hitting the lowest level of 3300, with a high and low range of 40 US dollars, but the overall market is still volatile, so don't chase shorts at low points
Short-term needs to wait for a rebound before shorting, pay attention to the 3318/3323 resistance
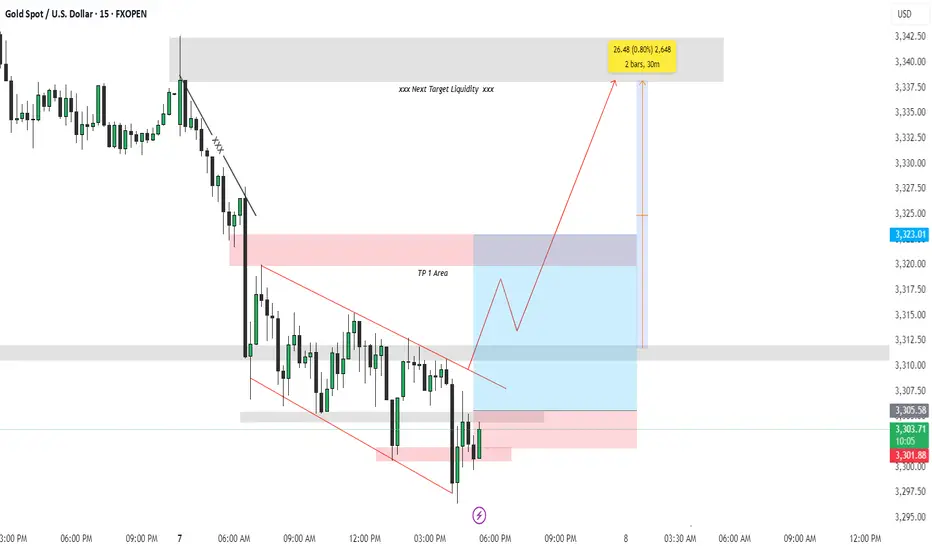
Trade Breakdown: XAUUSD 15-Min | Liquidity Grab + Reversal PlayOANDA:XAUUSD
Psychological Setup
This trade is rooted in the psychology of smart money and retail behavior. After a sharp drop in price, most retail traders expect continuation (trend-following). However, institutions often manipulate liquidity zones — hunting for stop-losses before a true reversal. This trade capitalizes on that behavior.
🔍 Technical Explanation:
🔻 1. Market Structure:
Price was previously in a downtrend, forming lower highs and lower lows.
A falling wedge pattern (red lines) formed after a strong bearish move, signaling potential bullish reversal.
Price broke the wedge to the upside — a classic reversal signal.
🔁 2. Liquidity Concept:
Below the wedge: The market grabbed liquidity by taking out stop losses of buyers who entered too early.
Above the wedge (TP Areas):
TP 1 Area (red box): This is the first logical resistance where previous supply sits — many sellers will enter here, providing buy-side liquidity.
Next Target Liquidity (grey box above): This is a major imbalance zone and likely where stop-losses of early short sellers are stacked.
Price is expected to grab liquidity from that area (marked by the red arrow).
✅ Entry & Trade Logic:
Entry Zone: After liquidity was swept at the bottom of the wedge, a bullish engulfing candle formed near demand — signaling institutional interest.
Risk-Reward Setup:
Targeting 0.80% move (approx. 26.48 points).
Trade is based on reversal from demand zone + wedge breakout + liquidity grab confirmation.
🎯 Target Projections:
TP1 Area: Conservative target, just above recent structure.
Final Target: High-probability liquidity zone where market is drawn to clean up resting orders (grey zone).
🧠 Why This Trade Matters (Trading Psychology Insight):
Most retail traders get trapped in emotional entries — entering shorts after a drop or longs too early in a wedge.
Smart money waits for liquidity sweeps before moving price in the desired direction.
This setup shows the importance of patience, structure, and understanding market psychology rather than reacting emotionally to price action.
📌 Key Takeaways:
📉 Trap: Falling wedge builds false bearish confidence.
🧠 Psychology: Stop hunts create fuel for reversal.
📈 Reaction: Smart money absorbs liquidity, moves price toward next inefficiency.
Hashtags:
#XAUUSD #SmartMoney #LiquidityHunt #TradingPsychology #GoldTrade #PriceAction #WedgeBreakout #FXOpen #TechnicalAnalysis #SupplyDemand
Gold shorts may continue to 3280 or even 3255Gold started to fall from around 3342 in the Asian session, and currently hit a low of around 3305. This is completely consistent with my prediction: "Before gold stabilizes at 3340, it is still in a short trend. Gold shorts may counterattack at any time and look at the target area in turn: 3315-3305." Currently, gold has reached the target area as expected.
There is no doubt that gold is still in an obvious short arrangement at present, and gold shorts may have just begun. For the next short-term trading, we still focus on shorting gold, so what we are most concerned about now is where gold can rebound and where is the most suitable short entry? ! From the current structure of gold, gold is under pressure from the short-term head and shoulders technical structure. This resistance structure compresses the rebound limit in the short term to the 3335-3340 area; and the short-term resistance area is located in the 3320-3330 area; once gold is under pressure and falls again, I think it is very likely that gold will fall to the 3295-3285 area again, and may even extend to the 3365-3355 area.
Therefore, I think shorting gold is still the first choice for short-term trading; you can consider shorting gold in the 3320-3340 area, looking at the target area of 3290-3280-3270
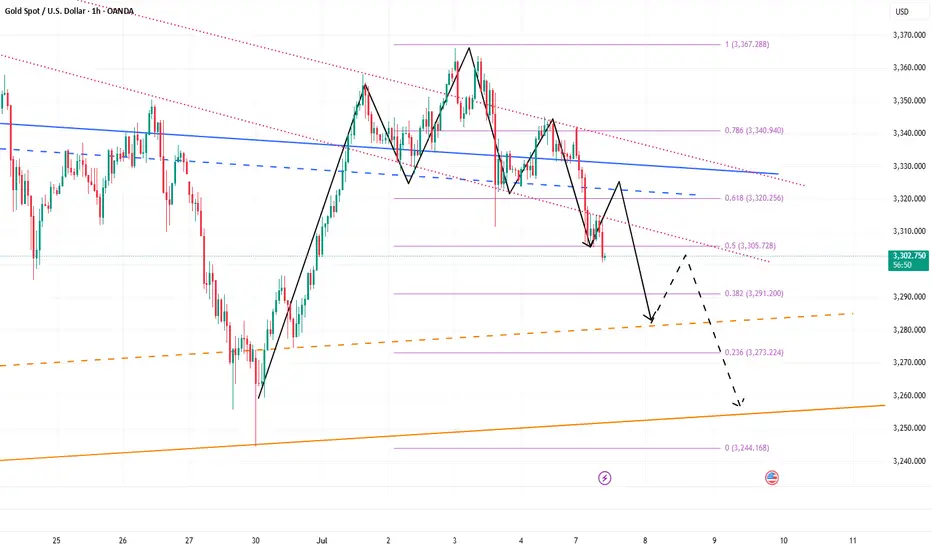
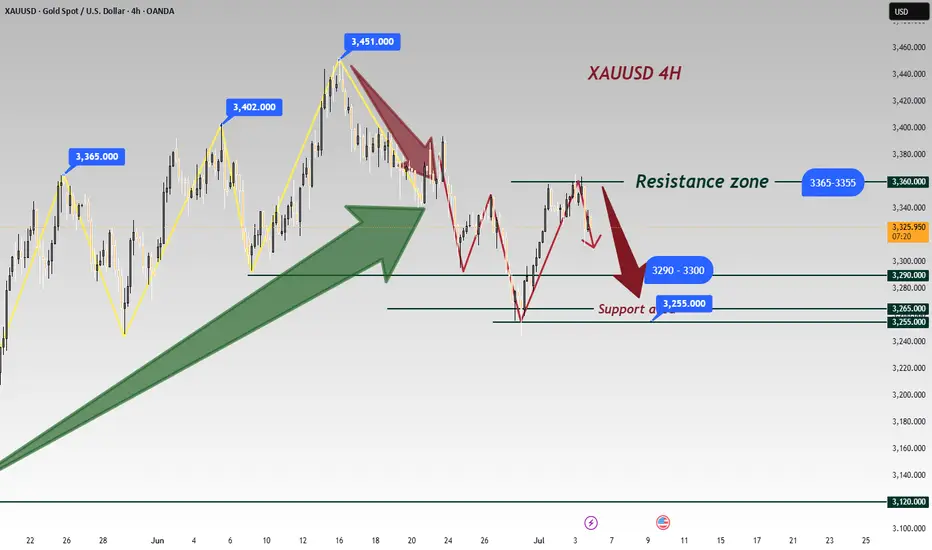
Gold Under Pressure After NFP Beat – More Downside Ahead?Moments ago, the US Non-Farm Payrolls surprised to the upside at 147K (vs 111K forecast), while the Unemployment Rate dropped to 4.1% (vs 4.3% expected) .
This stronger-than-expected labor market data reinforces the idea that the Fed has no immediate reason to cut rates. As a result, the USD( TVC:DXY ) strengthened, and gold came under renewed selling pressure.
If the dollar momentum continues, Gold ( OANDA:XAUUSD ) may face further downside in the short term.
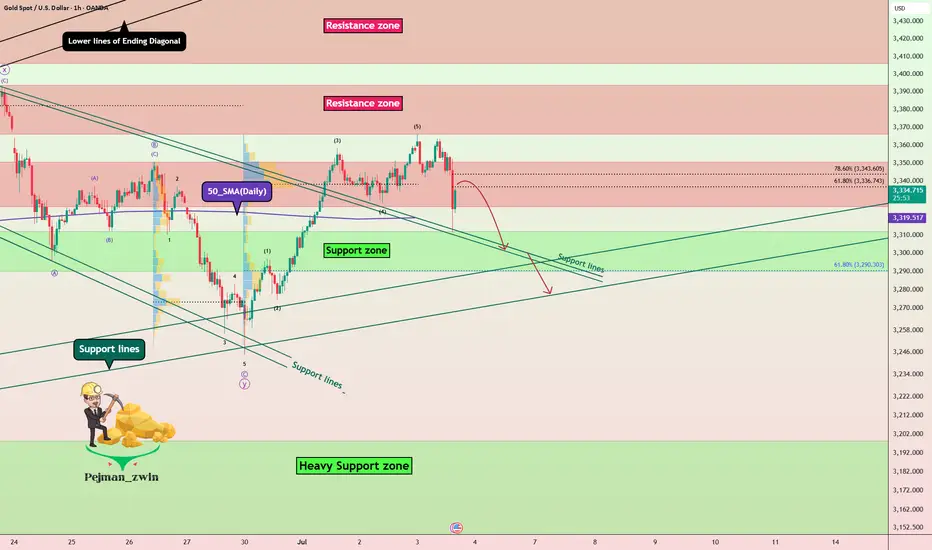
In terms of Technical Analysis , Gold fell below the Resistance zone($3,350-$3,326) again after the announcement of US indices and is currently moving near the Support lines and 50_SMA(Daily) .
In terms of Elliott wave theory , it seems that Gold has completed 5 impulsive waves in the one-hour time frame, and we should now wait for corrective waves .
I expect Gold to fall again after the upward correction , and the Support zone($3,312-$3,290) could be the target.
Note: Stop Loss (SL) = $3,365
Gold Analyze (XAUUSD), 1-hour time frame.
Be sure to follow the updated ideas.
Do not forget to put a Stop loss for your positions (For every position you want to open).
Please follow your strategy; this is just my idea, and I will gladly see your ideas in this post.
Please do not forget the ✅ ' like ' ✅ button 🙏😊 & Share it with your friends; thanks, and Trade safe.
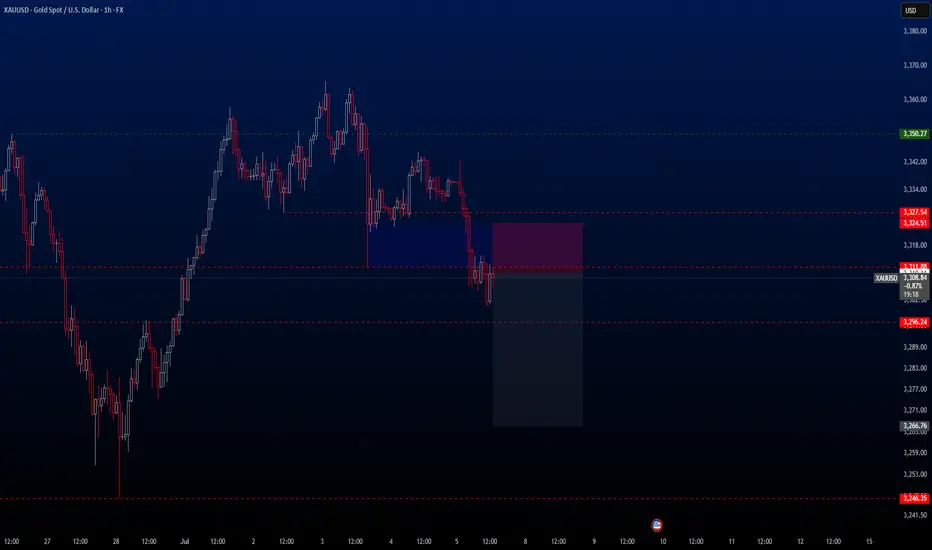
XAUUSD – Fresh Bearish Setup After TP HitWelcome to Velatrix Capital.
Last week’s short position on Gold has just hit Take Profit.
Based on current structure and momentum, we remain bearish-biased and have already entered a fresh short trade from a key resistance level.
This setup aligns with our internal system’s confluence logic and is now active.
🔍 Trade Parameters
• Timeframe: 1H
• Direction: Sell
• Entry: 3310.11
• Take Profit: 3266.76
• Stop Loss: 3324.51
• Risk/Reward: 1:3
Note: This is not financial advice. This is a real trade taken by our team based on a structured, repeatable trading model.
Use it as insight. Not as instruction.
🔔 Follow Us
We don’t chase hype.
We build edge.
Follow for raw setups, structured strategies, and institutional-grade breakdowns.
XAUUSDHello traders,
The Gold trade I shared last week has just hit TP. Based on current market conditions, I believe gold may continue its downward movement for a while. Therefore, I’m still holding a bearish bias and have just activated a new sell trade, which I’d like to share with you as well.
🔍 Trade Details
✔️ Timeframe: 1-Hour (H1)
✔️ Risk-to-Reward Ratio: 1:3
✔️ Trade Direction: Sell
✔️ Entry Price: 3310.11
✔️ Take Profit: 3266.76
✔️ Stop Loss: 3324.51
🔔 Disclaimer: This is not financial advice. I’m simply sharing a trade I’ve taken based on my personal trading system, strictly for educational and illustrative purposes.
📌 Interested in a systematic, data-driven trading approach?
💡 Follow the page and turn on notifications to stay updated on future trade setups and advanced market insights.
XAUUSD – High-Precision Sell Setup with 1:2.70 R/RGreetings, traders.
After a brief tactical pause, we’ve identified a **high-conviction short setup** on **XAUUSD**.
Despite the U.S. Independence Day holiday, structural momentum suggests there’s still room for meaningful movement in gold during today’s session. The risk-to-reward profile on this setup is exceptional — clocking in at **1:8.70**, it meets our highest-tier execution standards.
If momentum stalls or price consolidates excessively, the trade will be manually closed by **23:00 (UTC+4)**, regardless of outcome.
🧠 Trade Parameters:
• **Timeframe:** 1-Hour (H1)
• **Direction:** Sell
• **Entry:** 3337.09
• **Take Profit:** 3312.16
• **Stop Loss:** 3345.63
• **Risk/Reward Ratio:** 1:2,70
• **Trade Management Note:** Will be closed manually by 23:00 (UTC+4) if momentum conditions are not met.
🔗 Signal Source
All trade setups are published directly by Velatrix Capital — a high-discipline trading desk focused on FX, crypto, and global indices.
No opinions. No hype. Just statistically-grounded execution.
All signals are posted via our TradingView desk:
👉 (tradingview.sweetlogin.com)
📈 **We don’t chase hype. We build edge.**
🔔 **Subscribe for future setups and institutional-grade trade intelligence.**
**Velatrix Capital**
Continue to short gold, bears will exert force againAffected by the NFP market, gold fell precipitously, almost giving back 50% of the gains in the previous wave, and the short-selling performance was particularly strong; technically, gold successfully built a double-top structural resistance in the 3365-3363 area in the short term, which played a technical suppression role in the short term. As gold fell, the current short-term resistance moved down to the 3340-3350 area;
On the other hand, although gold began to rebound after falling to around 3312, it clearly showed the characteristics of weak rebound, and it did not even stand above 3340 once, and the long forces were insufficient; and technically, a single lower shadow line was not enough to support the continued rebound of gold, so gold still had the need to retrace the support below from a technical perspective; and once gold fell again, it was very likely to test the 3305-3295 area again.
So I think we can take advantage of the rebound of gold to short gold again. We can still short gold with the 3340-3350 area as resistance and look at the target area: 3315-3305-3295.
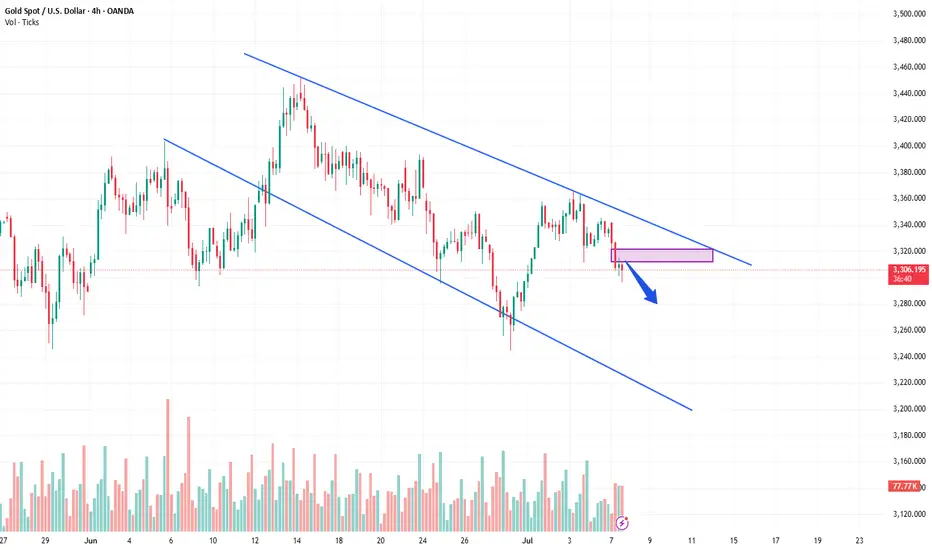
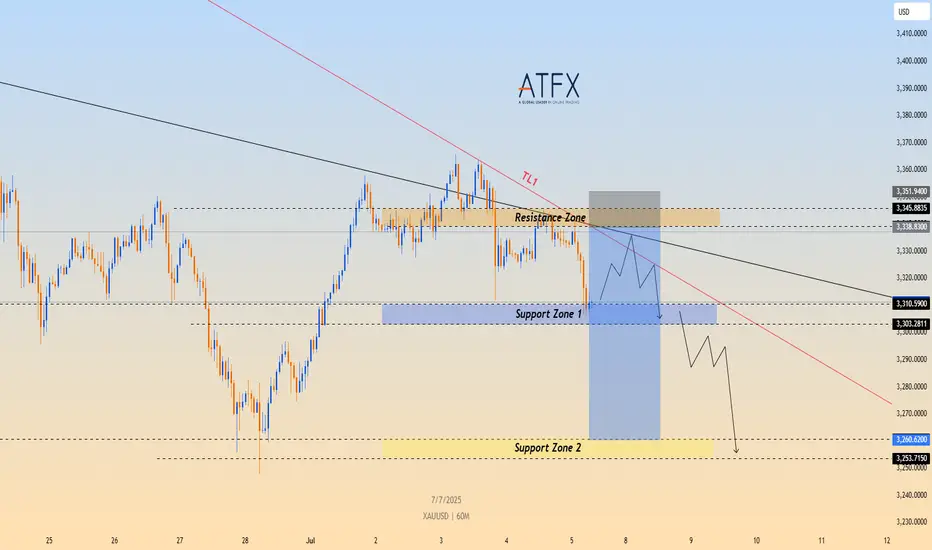
Consolidating Below Trendline Resistance, Bearish Bias IntactTechnical Structure:
OANDA:XAUUSD Gold (XAU/USD) continues to trade below the descending trendline TL1, having failed multiple times to breach the $3,338–$3,345 resistance zone. After retesting Support Zone 1 ($3,303–$3,310), the price is showing signs of a short-term bounce. However, the broader structure remains bearish unless the price can break above TL1.
Key Technical Levels:
Resistance Zone: $3,338 – $3,345
Support Zone 1: $3,303 – $3,310
Support Zone 2: $3,260 – $3,253
Trendline: TL1 continues to act as dynamic resistance
Strategy Insight:
If TVC:GOLD gold remains below the descending TL1, bearish pressure is likely to resume. A short opportunity may arise if the price retests the resistance area and stalls. A confirmed break below Support Zone 1 would expose targets at $3,260 and $3,253.
Disclaimer:
This analysis is for educational purposes only and does not constitute investment advice. Please consult a qualified financial advisor before making trading decisions.
XAUUSD – Gold at a Key AreaGold is now in a crucial zone with short potential.
If the market provides a valid bearish signal, I’ll take the short.
But if this zone breaks and confirms with a pullback, I’ll switch bias and go long.
💡 Remember:
We don’t control the market — we just try to profit using structure, setups, and solid risk management.
📌 Always risk max 1% per trade.
If the market goes against your bias, you only lose 1% — not your whole account.
🧠 One trade won’t make you rich,
But one reckless trade can destroy everything.
No gambling.
Just discipline, structure, and smart execution.
The bill was introduced; the price did not rise but fell.Due to the implementation of the US bill, most traders in the market are bullish on gold and believe that gold will soar on Monday. As a result, it jumped up and fell sharply this morning. This is the uncertainty of the market. Although the short position given near 3340 last Friday was late, it fell to the low point of 3306 at the opening of the Asian market today.
In addition, the key to this sharp drop is the high point before the rebound, that is, the starting point or the position of the top and bottom conversion. Once it is broken, you have to change your mindset. The volatile market is like this, just get used to it. The turmoil caused by Trump's bill will not appear for a while. It takes a process and cannot be unilaterally considered as bullish or bearish.
In the early Asian market, the price fell all the way from 3342 US dollars to 3306. How to judge the end of the decline? It is to stare at the high point of the rebound before the last decline of 3320 US dollars. The loss of 3300 US dollars in the early trading indicates that the gap-up opening is a lure for more.
Today, I think that 3325 above 3320 can be used as the dividing point between long and short positions. You can short with a light position near 3315, and pay attention to the 3295-3290 line below. After the upward breakthrough is confirmed, consider adjusting the position and making other arrangements. For the time being, we will look at the weak adjustment during the day.
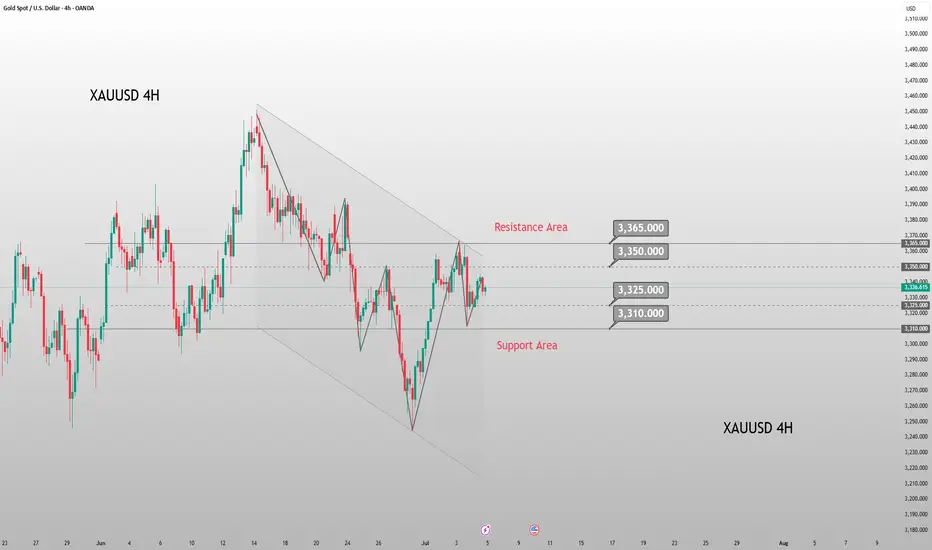
Current outlook for XAUUSD for the july 7th -11th 2025Support and resistance tells us to watch for price action around $3325 - $3345. Either a possible short at 3345 if rejected, or possible further downside if it breaks below 3325.

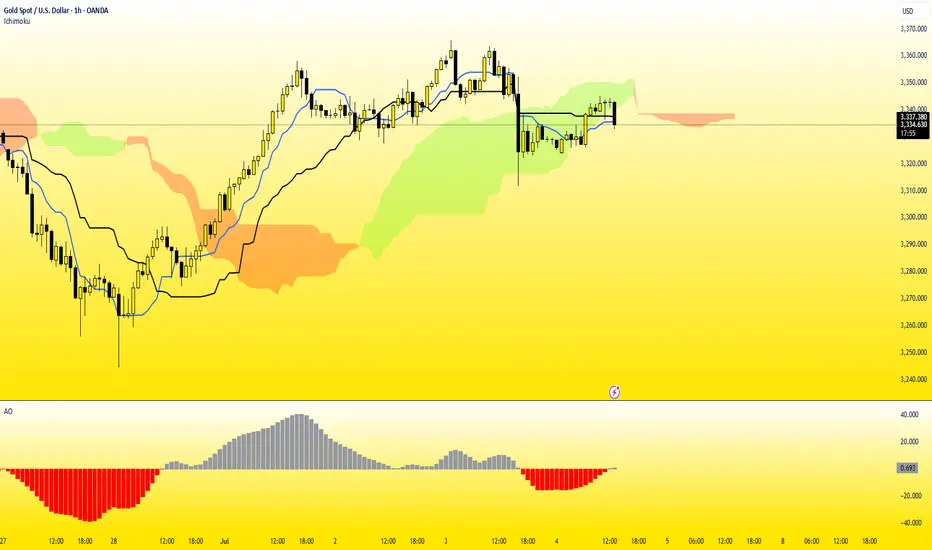
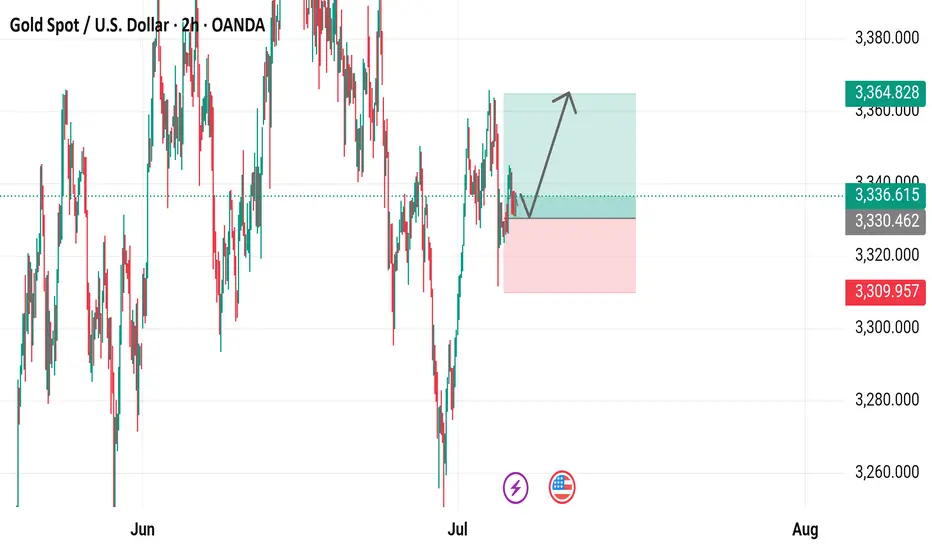
Gold Spot / U.S. Dollar (XAUUSD) 2-Hour Chart2-hour chart from OANDA displays the recent price movement of Gold Spot (XAUUSD) against the U.S. Dollar. The current price is $3,336.615, up by $10.585 (+0.32%). The chart highlights a recent upward trend with a buy signal at $3,336.970 and a sell signal at $3,336.260. Key price levels include a resistance zone around $3,364.828 and a support zone near $3,309.957, with the price showing a potential breakout above the recent consolidation range.
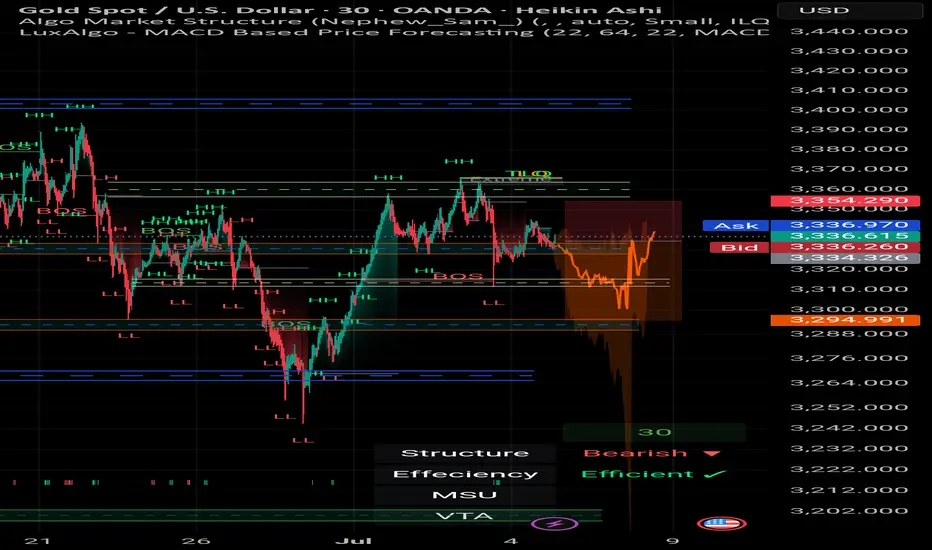
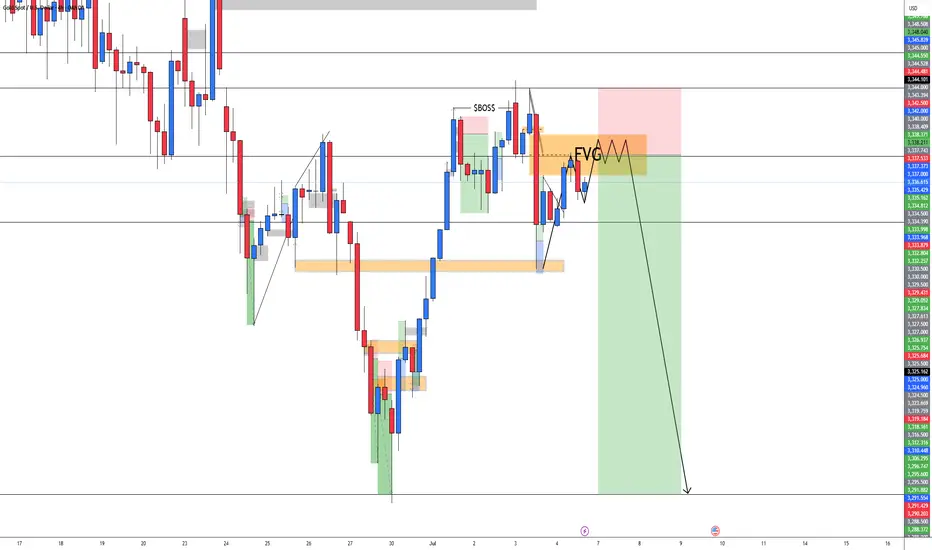
XAUUSD | 30m | Weekly Open Outlook Published by Mohsen Mozafari## 📍 XAUUSD | 30m | Weekly Open Outlook
⏱️ *Published by Mohsen Mozafarinejad*
---
### 🔍 Market Structure:
The market currently shows a **bearish structure**.
After a recent **BOS (Break of Structure)** near the 3344 zone, price retraced to mitigate unfilled sell orders within the **Extreme Supply OB (TLQ)**.
---
### 🔸 Key Observations:
- Price is reacting from a clear **supply zone (TLQ)** following BOS.
- The move appears to have cleared liquidity from late long entries.
- OB efficiency remains intact, indicating healthy market flow.
---
### 🧭 Scenario A – Short Bias
> If price consolidates or rejects below the 3340 level, a **high-probability short** may form.
🎯 Target: **Demand OB at 3295**
🚫 Invalidation: **Break & close above 3354 (last HH)**
---
### 🧭 Scenario B – Fakeout & V-Shape Reversal
> If price sweeps above TLQ but loses momentum, it could trap buyers and sharply reverse below BOS.
This would signal potential **seller exhaustion**.
---
### ⚙️ Technical Summary:
- **Structure:** Bearish 🔻
- **Efficiency:** Efficient ✅
- **MSU & VTA levels:** Valid for lower timeframe confirmations
- **Momentum:** Controlled pullback detected
---
> 📌 *"Precision beats prediction. Let the chart speak before you act."*
---
#### 🔖 Hashtags:
#XAUUSD #SmartMoney #SupplyDemand #OB #BOS #ScalpingGold #ForexAnalysis #MohsenMozafarinejad
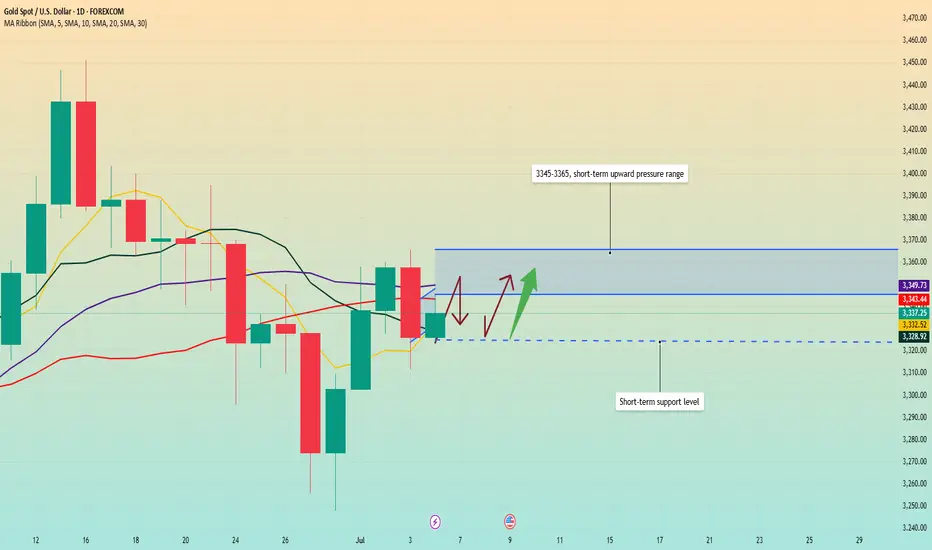
Big changes begin. Dominant trend?Event summary:
The United States passed the Big and Beautiful Act; how to get this part of the tax after the massive tax cut? Then it can only be obtained through other means, and the tariff war initiated by Trump is one of them. At the same time, the bill will increase the federal debt by trillions of dollars, further widening the gap between the rich and the poor.
Immediately after the bill was signed and took effect, Musk announced the establishment of the "American Party". He wrote: We live in a one-party state, not a democratic country. Today, the American Party is established to return your freedom to you. At the same time, Musk posted on July 6, when and where should we hold the first congress of the "American Party"? This will be very interesting.
This event is likely to support the trend change of gold bulls in the short term.
Market analysis:
From the daily chart, after bottoming out and rebounding this week, the weekly line closed higher, and there is still upward momentum next week; short-term focus on the pressure of the 3345-3365 range, which is likely to become a key area for long and short competition. Before breaking upward, focus on the high and fall. Pay attention to the support rebound of 3320-3325 area below. Once the upper pressure range is broken, the bullish space will expand, and it is not ruled out that it will hit above 3400 and then go down.
In terms of operation, the price falls back and buy on dips in the 3315-20 area, and pay attention to the profit range of 3345-3365 on the upside.
XAUUSD Weekly Chart Buying area📊 XAU/USD (Gold) Price Analysis – 4H Chart
🕒 Date: July 6, 2025
🔍 Technical Overview:
Gold is currently trading around the $3,337 level, showing signs of consolidation after a recent bounce.
🔸 Key Zones:
🟡 Resistance Area 1: $3,295 - $3,310
🟡 Resistance Area 2: $3,250 - $3,270
🟡 Target Zone: $3,390 - $3,410
📈 Possible Scenarios:
Price may retrace to the $3,295 - $3,310 resistance area, hold support, and aim for the $3,390 - $3,410 target zone.
A deeper pullback to the lower $3,250 - $3,270 resistance turned support area may occur before a stronger bullish move.
Breakout confirmation will come on a clean close above the $3,337 level with volume.
📌 Bias: Bullish above the $3,295 level
📌 Watch for: Bullish price action or liquidity grabs near support zones
💡 This setup is based on structure, liquidity zones, and institutional footprints.

Gold lacks downside momentum: Next week's analysis & adviceGold trading is relatively light today due to the U.S. Independence Day holiday. On the downside, we continue to focus on the short-term support at the 3325 level, while the key resistance above remains in the 3345-3350 range, which was yesterday's breakdown point. The market has closed early today, and price action has been stuck in a range-bound consolidation.
After plunging $40 on the back of bearish non-farm payroll data, gold stabilized and rebounded, recouping nearly half of the losses. This performance confirms that the downside space is limited. Currently, the market has returned to a oscillating upward pattern, and the weekly chart is likely to continue range-bound fluctuations. From a technical perspective, the 3325 level has formed a key support. The secondary retest overnight confirmed the bottom structure, and the gradual lifting of early session lows has also released a bullish signal. Looking ahead to next week, gold is expected to continue its bullish trend. If the 3325 support level below remains unbroken, one can look for opportunities to establish long positions.
XAUUSD
buy@3325-3330
tp:3340-3360-3380
Investment itself is not the source of risk; it is only when investment behavior escapes rational control that risks lie in wait. In the trading process, always bear in mind that restraining impulsiveness is the primary criterion for success. I share trading signals daily, and all signals have been accurate without error for a full month. Regardless of your past profits or losses, with my assistance, you have the hope to achieve a breakthrough in your investment.
Gold continues to fluctuate. The direction is uncertain.Gold prices did not have a large continuation breakthrough on Friday due to the impact of the US Independence Day holiday; although the non-agricultural data on Thursday fell rapidly under the unfavorable conditions and formed a bottoming-out situation, the short-term bulls and bears were once again in a deadlock. After a small sideways movement on Friday morning, it rose again. Although it did not break through the upper pressure line of 3345, it still closed in the form of a positive line, which also gave the bulls hope to dominate next week.
At present, the upper key pressure is still maintained at the 3345 line, which is also the first point for the bulls to break through. Once the upper breakthrough is successful, the next target will be maintained at around 3365-3380. The support below is maintained at around 3325. If this position is broken down on Monday, the support of 3325 will not be maintained, and the bears will continue to open the downward channel.
But overall, the market direction is still unclear, and we can conduct trial transactions. Go long when the price falls back to 3325 on Monday in the Asian market, the profit range is 3340-3350, and the stop loss is 3315. If the European market continues to strengthen, you can still go long. If the European market continues to strengthen, we can still continue to go long. Otherwise, we still need to adjust our thinking in a timely manner.
XAUUSD BEARISHAccording to the SMC and FVG concept, I am seeing bearish momentum in Gold. We have to wait for the proper rejection from FVG to sell the GOLD.
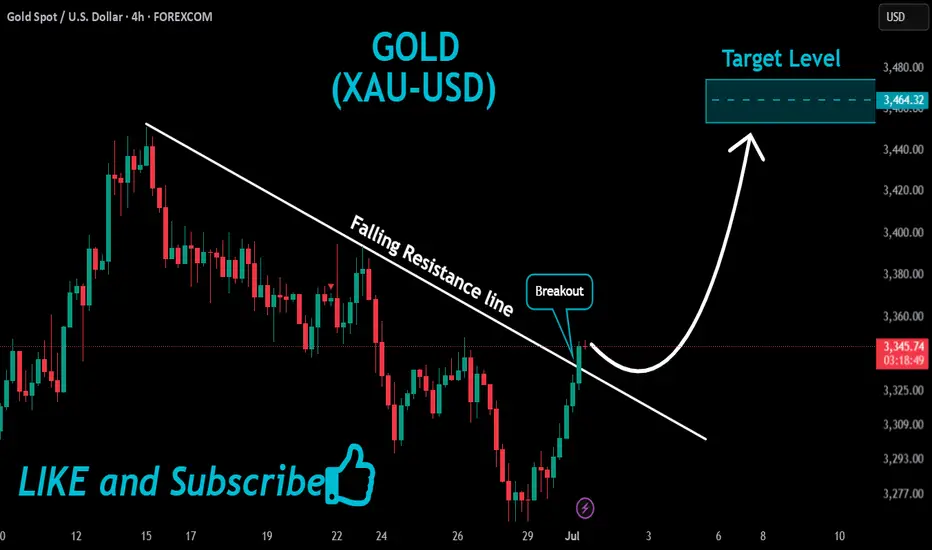
GOLD Massive Bullish Breakout!
HI,Traders !
#GOLD is trading in a strong
Uptrend and the price just
Made a massive bullish
Breakout of the falling
Resistance line and the
Breakout is confirmed
So after a potential pullback
We will be expecting a
Further bullish continuation !
Comment and subscribe to help us grow !
Gold - The final resistance breakout!Gold - TVC:GOLD - prepares a final rally:
(click chart above to see the in depth analysis👆🏻)
Over the past 12 months, Gold rallied more than +70%. However the past three months clearly rejected a major horizontal resistance. But price action on the smaller timeframe remains incredibly bullish. Therefore an all time high breakout will most likely follow.
Levels to watch: $3.500
Keep your long term vision!
Philip (BasicTrading)

June Nonfarm Data: Gold PlungesThe US June nonfarm payrolls data is out: 147,000 jobs were added, exceeding the expected 106,000 and the previous 139,000, with slight upward revisions to the prior two months’ figures. The unemployment rate dipped from 4.2% to 4.1%, beating the forecast of 4.3%. While the US economy slows, the job market remains robust. 🌟
Post-data release, market bets on a July rate cut have evaporated, with the probability of a September cut dropping to around 75%. US stock futures extended gains, Treasury yields rose across the board, the US Dollar Index surged, and gold plunged nearly $40 in a short squeeze—signaling an unexpected major bearish hit to gold. Weng Fuhao advises trading with the trend, focusing on shorting on rebounds. 😲
Gold, jolted by the nonfarm data, slid sharply in the short term before a minor rebound, with bearish signals across all timeframes. The data triggered an immediate breakdown, shifting the short-term trend to downward: on the 3-hour chart, moving averages formed a death cross, MACD showed a death cross with expanding volume, and gold prices fell below the Bollinger Band lower track, confirming a clear bearish momentum. 📉
🚀 Sell@3355 - 3345
🚀 TP 3335 - 3325 - 3315
Accurate signals are updated every day 📈 If you encounter any problems during trading, these signals can serve as your reliable guide 🧭 Feel free to refer to them! I sincerely hope they'll be of great help to you 🌟 👇