Gold fluctuates upward. Is the decline over?On Monday, gold opened at around 3282, and then fell back quickly to around 3247 under pressure; the downward low was blocked, and then rebounded strongly to around 3297; the market currently maintains a small upward trend.
At present, we need to focus on the resistance range of the upward trend.
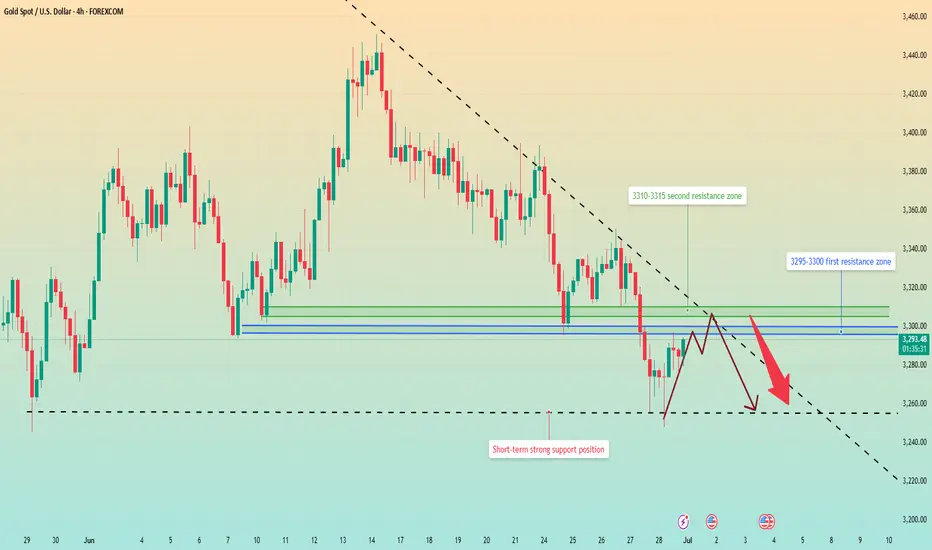
From the 4-hour chart, the upper short-term resistance is around 3295-3300, followed by the suppression range of 3310-3315. The main direction of short-term operations maintains the rebound short-selling strategy. The support below is around 3255; the overall short-term operation relies on 3260-3300 to maintain the main tone of high-altitude participation unchanged.
Operation strategy:
Short near 3305, stop loss 3320, profit range 3270-3260.
A new week has just begun. I wish you all gain something from the market fluctuations.
Xauusdsignal
Gold is trading sideways. Has it reached a high point?On the first trading day of this week, after hitting 3247 in the early Asian session, it quickly rebounded to around 3295, and then fell back slightly. It is currently maintained at around 3285.
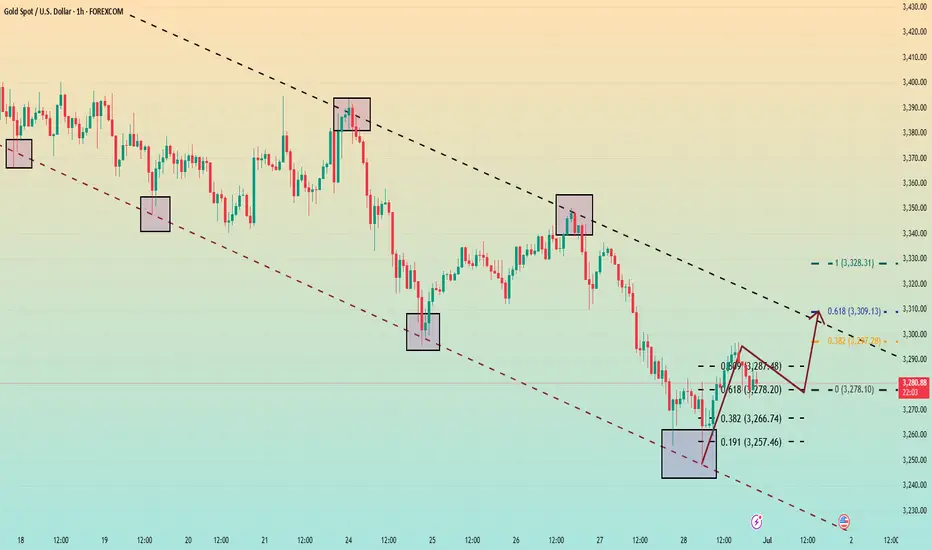
From the hourly chart, the Fibonacci 0.618 position of this trend from 3247 to 3297 is at 3278. The price has always been above 3278, but it has only fallen below this position in a very short time. If the retracement does not break through the 0.618 position, there is a high probability that there will be a high point in the subsequent trend.
Next, we should focus on the area around 3280. If the price always closes above 3280, then today's high point of 3297 will most likely be refreshed. If the upward trend is opened again, it is very likely to touch around 3310. 3310 is also the current 0.618 position. And it is also the top position of this hourly chart range.
Therefore, we should be cautious when shorting gold above 3280, as there is a high probability that it will reach above 3300.
Aggressive trading can rely on entering the market and going long near 3280, and the profit range is between 3300-3310.
For short strategy trading, Quaid recommends that it is safer to short when the price rebounds near 3310.
XAUUSD:Sharing of the Latest Trading StrategyAll the trading signals this week have resulted in profits!!! Check it!!!👉👉👉
Early Session Dynamics:
Gold rebounded in today’s early trading after finding support at the prior low of 3245, aligning with our weekly forecast. The intraday strategy prioritizes a low-level rebound correction, with short positions to be initiated at resistance levels.
Key Technical Levels:
Resistance: 3295–3308
Support: 3250–3240
4-Hour Chart Perspective:
The market remains weak with high volatility. The double-bottom effect at 3245 is unconfirmed, and no bottoming pattern has emerged. Thus, the week’s initial outlook is for a range-bound oscillation between 3308 and 3240:
A rebound opportunity exists as long as 3240 holds.
A break above 3308 could trigger upward momentum.
Intraday Trading Strategy:
Lacking follow-through in the European session, the short-term trend is viewed as range-bound
Sell@3305-3295
TP:3285-3250
buy@3250-3260
TP:3285-3300
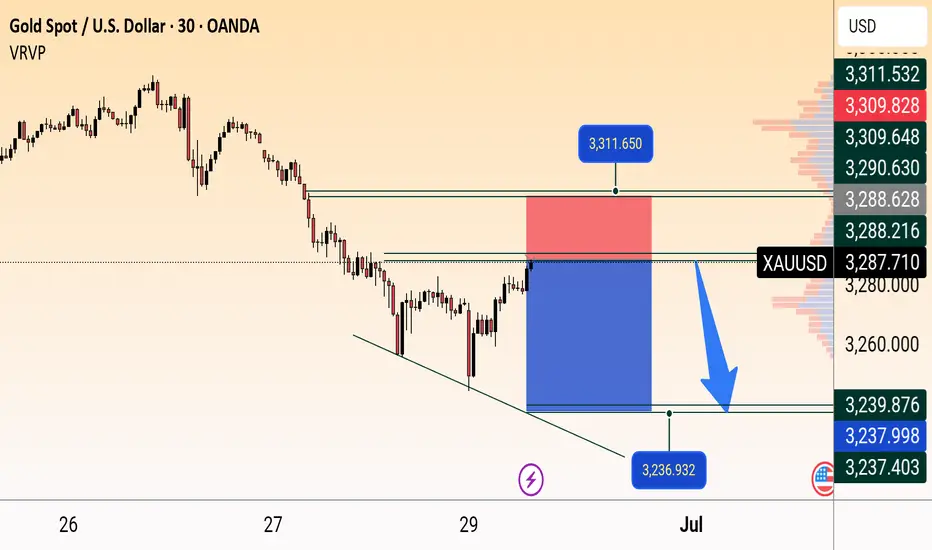
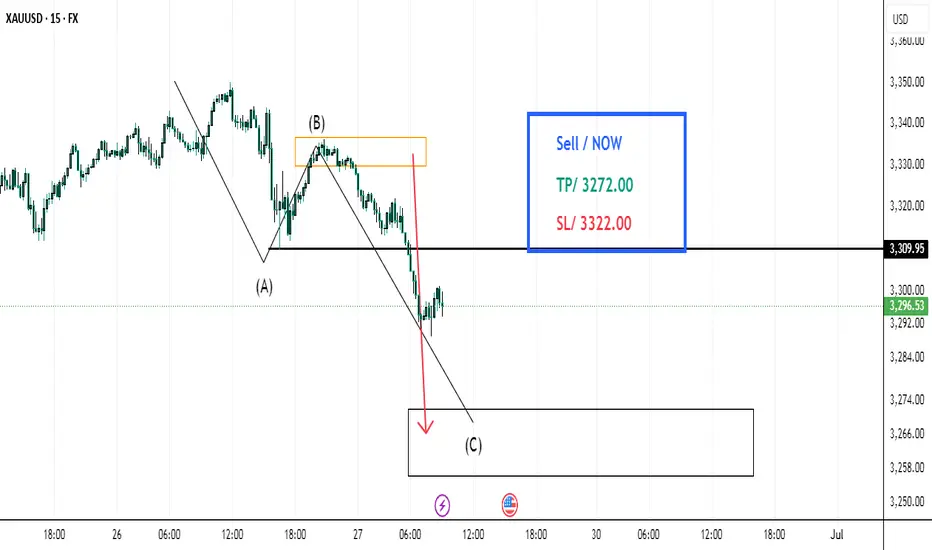
XAU/USD Bearish Rejection Setup Below Resistance ZoneXAU/USD (Gold) is forming a bearish setup on the 30-minute chart. Price is testing a resistance near 3288, with a potential reversal towards the 3236 level. Entry is marked around current price, with a stop loss at 3311 and take profit near 3237, supported by a descending channel.
GOLD H2 Intraday Chart update for 30 June 2025Hello Traders,
As you can see that there are some solid in the market since morning, right now market is sustains below 3300 Psychological Level and move towards 3270-75 key support zone and then at 3350
Monthly candlestick closing also due today
only if market breaks 3305 successfully today then GOLD will move towards 3335
Disclaimer: Forex is Risky

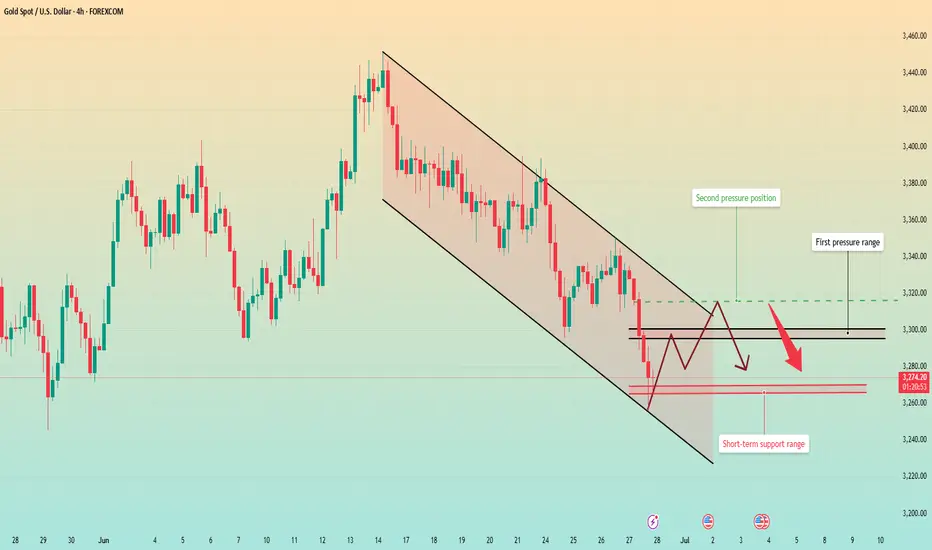
XAUUSD Under Pressure: What the Market Is Telling UsGold (XAUUSD) is currently trading with a clear bearish bias, showing sustained downside momentum on the 4H timeframe 🕒. Price has been gradually stepping lower, and the structure continues to favor the sellers.
As expected for early in the week, there’s been a bit of choppy movement ⚖️, but the overall sentiment remains weak. Unless we see a strong shift or catalyst, I’ll be maintaining a bearish outlook.
🧭 I’m watching for price to revisit key resistance levels, and if we get a clean break and retest 🔄, I’ll be looking for potential short setups from areas of previous demand that flip into resistance.
🌐 Keep an eye on broader risk sentiment — if NASDAQ starts pulling back or DXY strengthens, it could fuel further downside in gold.
As always, this is not financial advice, but the detailed breakdown is available in the latest video 🎥.

Gold Rebounds from 3250 – But Bears Still in Control1. What happened last week
As you know, I’ve been bearish on Gold all last week long. Even though the geopolitical situation in the Middle East escalated over the weekend, the fact that price couldn’t reclaim the 3400 resistance was a major red flag.
It showed us that the bullish sentiment was fragile, and that downside pressure is just around the corner.
And indeed — Gold sold off. The weekly close below the 3300 level confirmed the weakness.
2. The key question now
Has Gold found a bottom at 3250, or is this just a temporary rebound before another leg down?
3. Why I expect a continuation lower
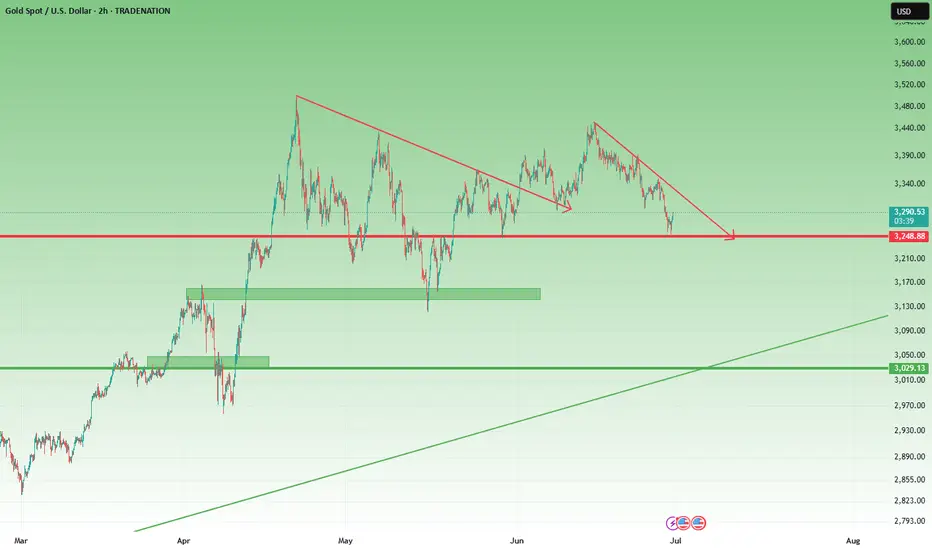
- The weekly close was under 3300, breaking key support
- 3250 is being tested again — a level touched multiple times since the mid-April ATH
- The current rebound looks corrective, not impulsive
- Resistance levels at 3320 and 3340 are likely to hold as ceilings
- No major catalyst yet to justify a reversal
- This looks like a classic “sell the rally” setup in a weakening trend.
4. Trading plan
The idea is simple: sell the spikes.
If price bounces into 3320–3340, I will look to short again, anticipating a renewed test of the 3250 support zone.
If 3250 breaks — we could see acceleration toward 3200 or lower.
5. Final thoughts 🚀
No need to complicate things. Gold remains vulnerable unless it clears 3340. Until then, the trend is your friend — and that trend points down.
Disclosure: I am part of TradeNation's Influencer program and receive a monthly fee for using their TradingView charts in my analyses and educational articles.
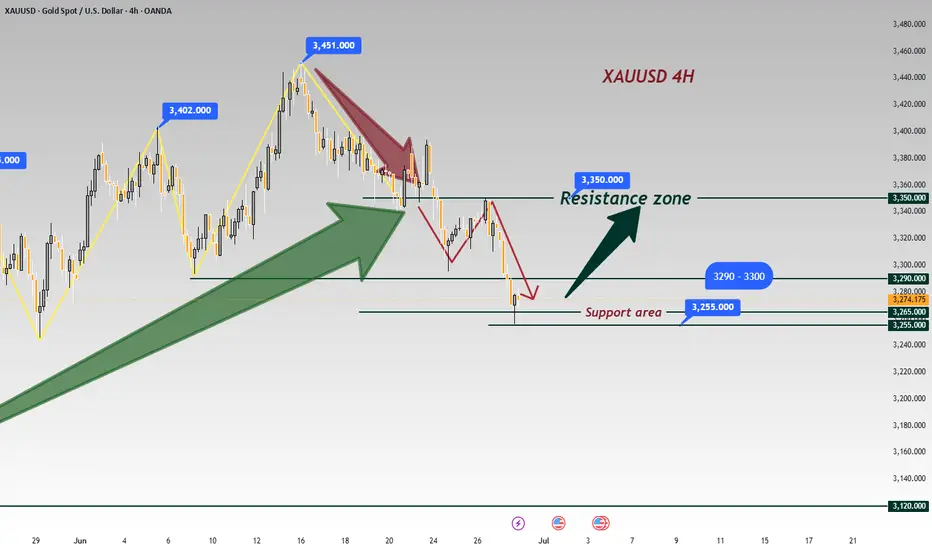
Gold Price Forecast: Bulls Defend Key Support, Eyes on TrendlineTVC:GOLD Gold (XAU/USD) bounced from the $3,261 support zone after briefly dipping to a one-month low around $3,265 in early Asian trade. The rebound came as buyers stepped in at a major demand area, rejecting further downside and suggesting bullish intent.
Macro drivers include reduced safe-haven demand following the US-China trade agreement on rare earths and a temporary ceasefire between Israel and Iran. However, expectations of a Fed rate cut—especially after weaker US consumer spending data—could limit further losses.
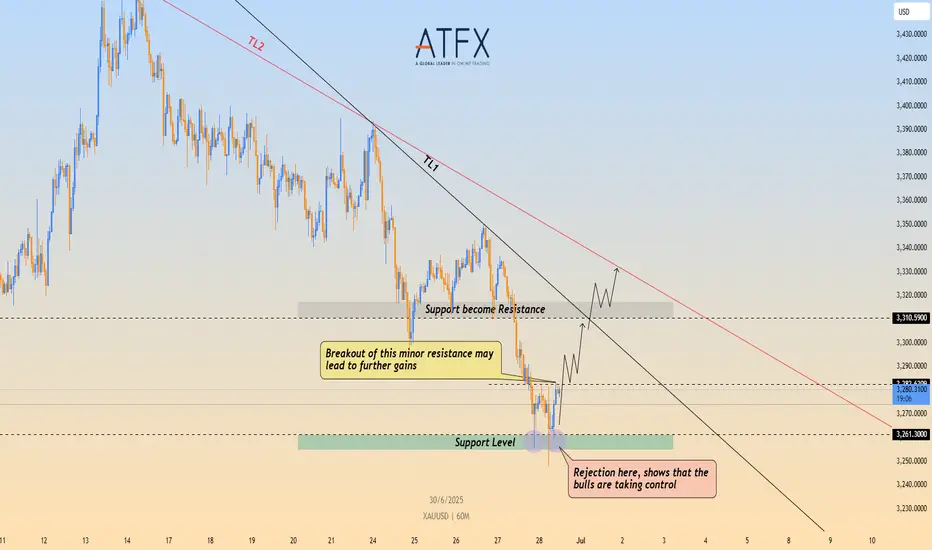
Technically, OANDA:XAUUSD gold has formed a double bottom around $3,261, and price action now threatens to break above a descending trendline (TL1). A confirmed breakout above minor resistance at $3,283 may open the door toward $3,311 and potentially the upper trendline near $3,330.
Key Levels to Watch:
Support: $3,261 (defended), $3,250 (monthly low)
Resistance: $3,283 (minor), $3,311 (former support turned resistance), $3,330 (TL2 trendline)
📉 Trendlines: TL1 and TL2 still capping upside; breakout would confirm bullish shift
If bulls can maintain control above $3,283 and push through the trendline, a broader recovery could follow. However, failure to clear this zone may invite renewed selling pressure.
⚠️ Disclaimer: This analysis is for informational purposes only and does not constitute investment advice.
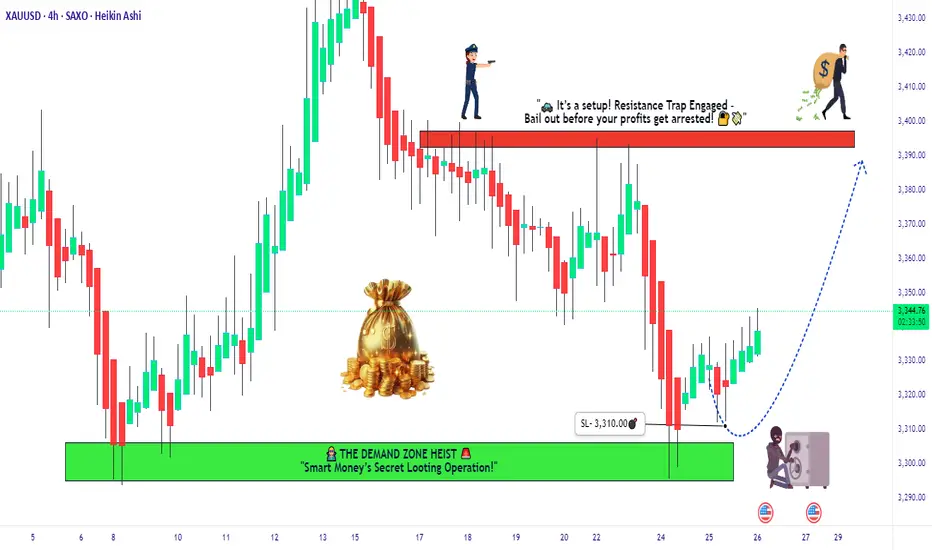
"The Great Gold Heist" – XAU/USD Master Plan🏆 "The Great Gold Heist" – XAU/USD Master Plan (High-Risk, High-Reward Loot!) 🚨💰
🌟 Attention, Market Robbers & Money Makers! 🌟
Hola! Oi! Bonjour! Hallo! Marhaba! 🤑💸
🔥 Based on the legendary Thief Trading Strategy (technical + fundamental heist tactics), here’s our blueprint to STEAL massive profits from the XAU/USD (Gold vs. Dollar) market! 🔥
🎯 The Heist Plan (Long Entry Setup)
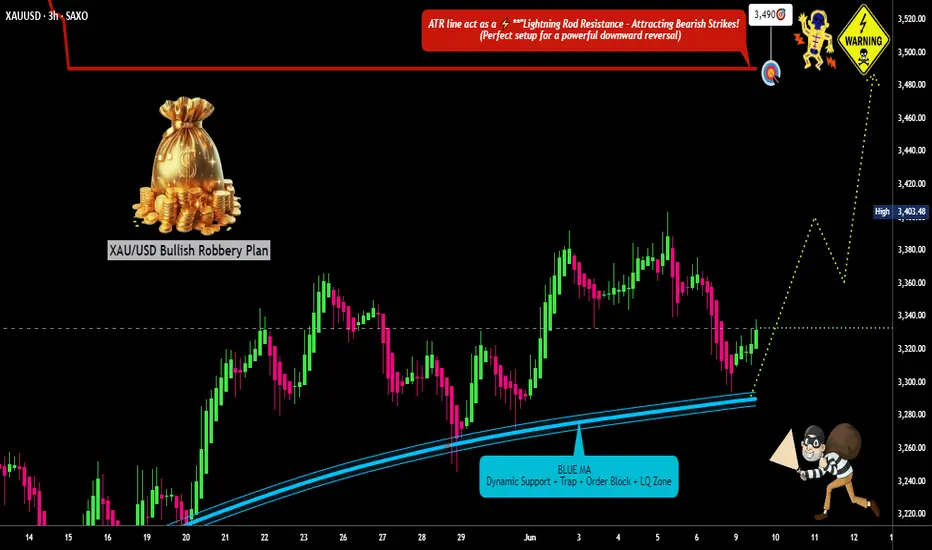
Entry Point 📈: *"The vault is UNLOCKED! Swipe bullish loot at any price—but for a cleaner steal, set Buy Limits within 15-30M recent swing lows/highs. ALERT UP! ⏰"*
Stop Loss 🛑: "Thief’s SL hides at the nearest swing low (3H TF: 3250.00) OR below the last daily candle wick. Adjust based on your risk appetite & lot size!"
Target 🏴☠️: 3490.00 (or escape early if the cops—err, bears—show up!)
⚡ Scalper’s Quick Loot Guide:
"Only scalp LONG! Rich? Go all-in. Broke? Join the swing traders & rob slow ‘n’ steady. Use Trailing SL to lock profits!"
📊 Market Status:
XAU/USD (GOLD) – Neutral (But Bullish Sneak Attack Likely! 🐂💥)
"The heist is ON, but watch for traps—overbought zones, consolidation, and bearish robbers lurking!"
🔍 Pro Thief Moves:
✅ Fundamentals Matter! (COT Reports, Geopolitics, Macro Data, Sentiment—check our BIO0 for the full loot list!) 🔗👉🏻☝🏻
✅ News = Danger! Avoid new trades during releases. Trail your SLs to protect stolen cash! 📰🚨
💖 Support the Heist Crew!
"Hit the BOOST BUTTON 💥 to strengthen our robbery squad! More boosts = easier money steals daily!"
🚀 Stay tuned—another heist drops soon! 🐱👤💎
Gold's 3290-3300 Support : Next Week Aims for Gap-Up Retest Last week, gold opened with a gap-up on Monday 🔼, then trended downward 🔽.
⚡ Notably, the 3290-3300 support zone held firmly from Monday to Thursday, demonstrating strong resilience.
🌱 The price plunged to around 3255 on Friday but rebounded promptly.
🔥 For next week, the opening may surge toward the 3290-3300 zone, warranting close attention.
🚀 Buy@3260 - 3270
🚀 TP 3280 - 3290 -3300
Accurate signals are updated every day 📈 If you encounter any problems during trading, these signals can serve as your reliable guide 🧭 Feel free to refer to them! I sincerely hope they'll be of great help to you 🌟 👇
XAUUSD 30/6 – 4/7/2025: Selling Pressure Builds - In the past week, gold OANDA:XAUUSD has been under consistent selling pressure due to the following key macro factors:
- The U.S. Dollar Index (DXY) TVC:DXY surged, raising the opportunity cost of holding gold and leading to widespread sell-offs.
- 10-year U.S. Treasury yields hovered around 4.30%–4.35% , reinforcing expectations that the Fed will keep rates higher for longer.
- Core PCE data for June indicated that inflation remains elevated, reducing the likelihood of imminent rate cuts by the Federal Reserve.
- Geopolitical tensions in the Middle East have temporarily eased, diminishing gold’s safe-haven appeal in the short term.
➤ As a result, these combined factors are applying downward pressure on XAUUSD, especially after price decisively broke the 3,300 USD support zone.
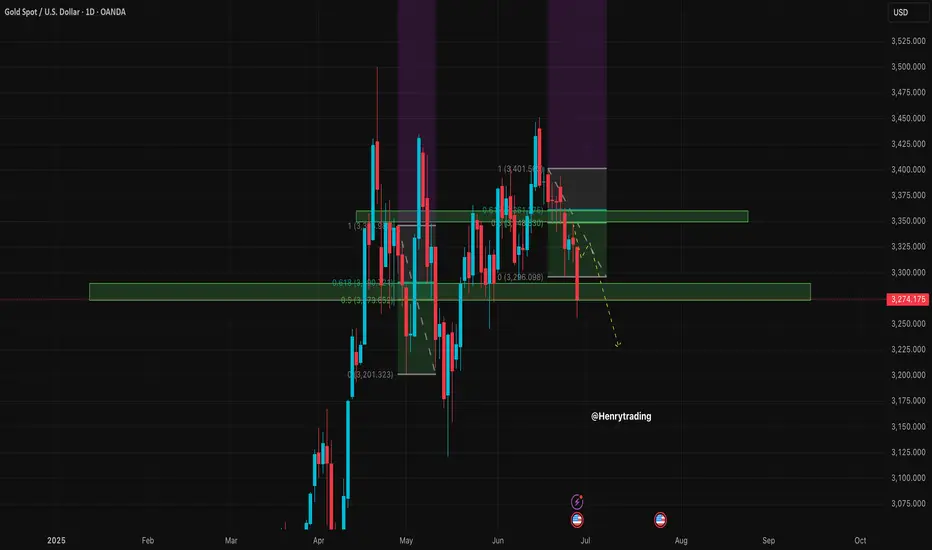
1. Technical Analysis of XAUUSD – Daily Timeframe
On the D1 chart:
- Price has broken below the key support zone 3,300 – 3,331 USD, confirming a short-term bearish structure.
- The Fibonacci retracement from the 3,399 peak to the 3,295 low has completed its pullback to the 0.5–0.618 zone (3,345 – 3,359 ) but was strongly rejected by sellers.
- Price is now trading below both EMA20 and EMA50, indicating strong bearish momentum.
- RSI has turned back under 50 and has not yet reached oversold territory, suggesting further downside potential exists.
2. Key Resistance and Support Zones for XAUUSD
Technical Role ( 3,345 – 3,359 )
- Major confluence resistance (Fibonacci 0.618 + supply) ( 3,295 – 3,300 )
- Immediate resistance zone (post-breakdown retest) ( 3,260 – 3,235 )
- Short-term support and potential buy interest ( 3,223 – 3,205 )
- Strong medium-term support (Fibonacci 1.0 + April lows)
3. Trading Strategy for XAUUSD This Week (30/6 – 4/7/2025)
Strategy 1 – Favor Short Positions Aligned with Bearish Momentum
Entry: Sell near 3,295 – 3,300 (anticipating resistance retest)
Stop Loss: 3,304
Take Profit 1: 3,290
Take Profit 2: 3,285
Take Profit 3: 3,275
Strategy 2 – Countertrend Buy at Key Support with Confirmation
Entry: Buy near 3,235 – 3,240 only if bullish reversal candles (pin bar or bullish engulfing) appear on H4 or D1
Stop Loss: 3,230
Take Profit 1: 3,245
Take Profit 2: 3,250
Take Profit 3: 3,260
Ps : XAUUSD is currently in a downward correction phase, with the next target zone lying between 3,235 – 3,260 USD. The inability to hold above 3,300 confirms that sellers remain in control. The most favorable approach this week is to sell on rallies, especially near former support-turned-resistance zones.
Stay vigilant, follow updated price action closely, and strictly manage risk to protect your capital.
Follow for more high-probability strategies throughout the week – and save this idea if you find it valuable to your trading journey.
Analysis by @Henrybillion
Non-agricultural data is coming. Will it affect the market trendBecause there will be non-agricultural data next week, Quaid thinks that the market will not be in a hurry to perform at the beginning of the week. And Friday is the US Independence Day, and the market will be closed in advance; maybe only Wednesday and Thursday are really needed.
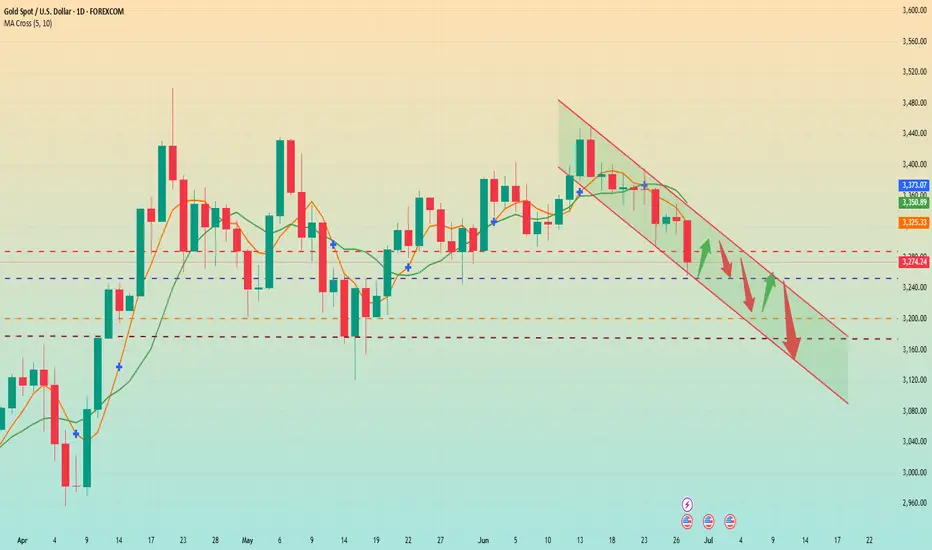
This week, gold closed below 3300, and the daily line was also broken, and gold officially entered a bearish trend.
First look at the monthly line chart
Because next Monday is the last day of June, the monthly line will start to close, so you can still pay attention to the support of the monthly line. The MA5 moving average below the monthly line is currently around 3170. Moreover, with the support of non-agricultural data next week, the possibility of touching around 3170 is not ruled out.
Secondly, from the weekly line chart
The weekly line is basically the same as the monthly line. The MA20 moving average below is also around 3170. So next week, I think we should focus on around 3170. The monthly line and the weekly line resonate, so the probability of touching this position is very high.
Finally, let's look at the daily chart. The daily chart shows a downward trend and the short-term support has been broken. The current support is around 3250. I think there is a high probability of a small sideways consolidation at the beginning of the week. If the market conditions are eager to change, it may rebound slightly and then continue to decline. If it falls below 3250, it will continue to fall towards 3200. If this level is broken, it may hit the low point of 3170-3175.
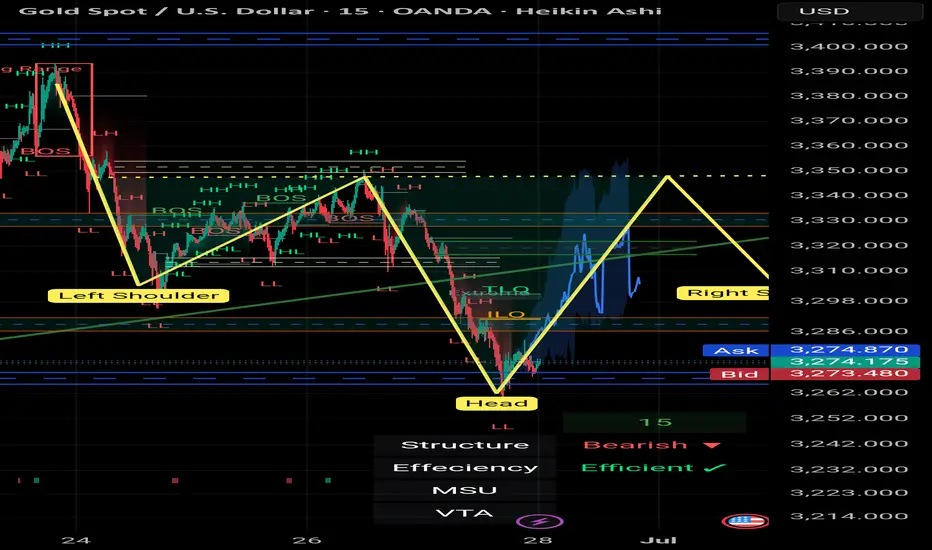
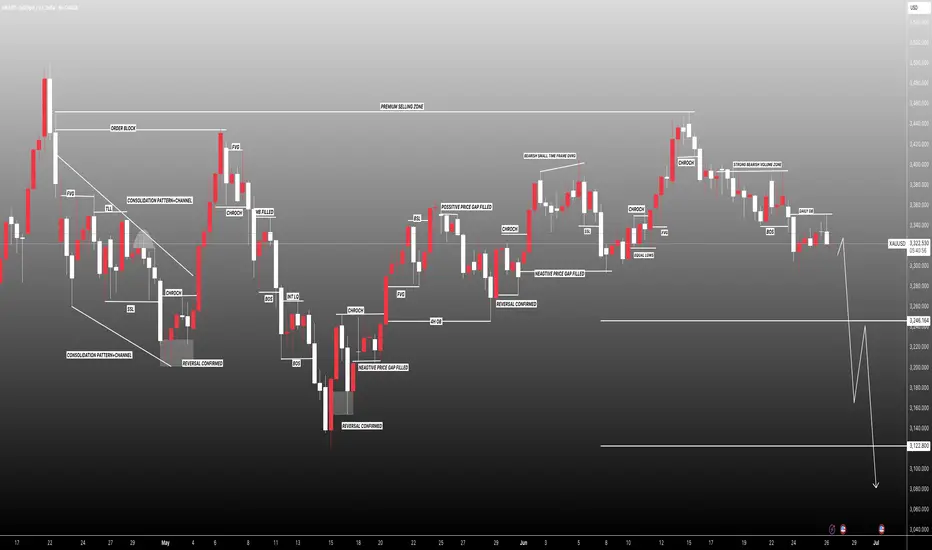
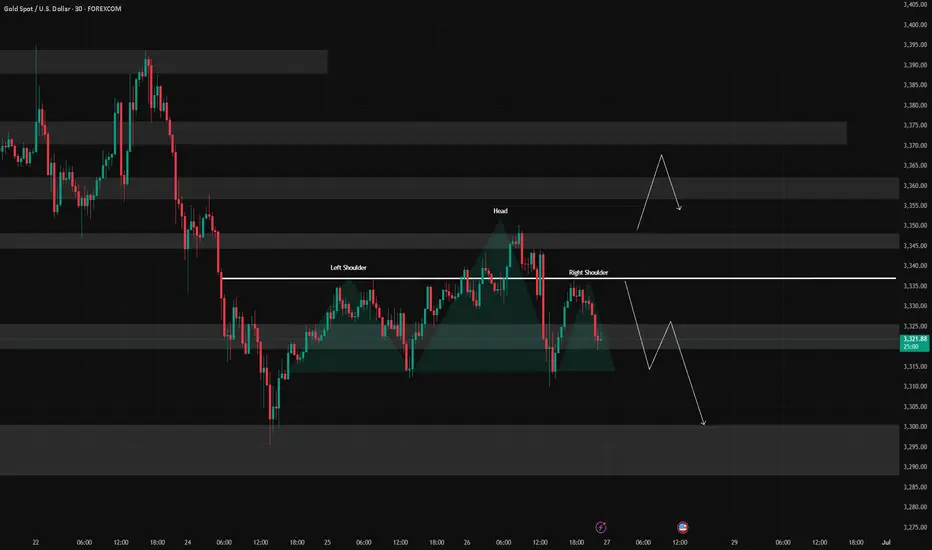
Reverse Head & Shoulders Setup | Gold Spot | 15min | by Mohsen M
🔸 **Chart:** Gold Spot / USD (XAU/USD)
🔸 **Timeframe:** 15min
🔸 **Method:** Smart Money Concepts (SMC) + Pattern Recognition
🔸 **Focus:** Reverse H&S, Order Blocks, TLQ, BOS
---
## 🔍 Market Context:
- **Market Structure:** Bearish on higher TF
- **Short-Term Trend:** MSU (Market Structure Up)
- **Efficiency:** ✅ Confirmed — clean price delivery
- **Key Pattern:** Bullish **Inverse Head & Shoulders**
---
## 🧠 Technical Breakdown:
1. **Left Shoulder – Head – Right Shoulder** perfectly forming within a high-value demand zone
2. Price reacted strongly from **Order Block (OB)** + TLQ marked at the bottom wick (Head zone)
3. BOS confirms bullish attempt to shift structure
4. Anticipating neckline break at ~3345 level for further upside
5. Potential resistance and liquidity resting above 3400 (HH region)
---
## 📌 Trading Plan (Pre-London Open / Monday 1:30 AM UTC+3:30):
- **Entry Idea:**
Watch for bullish confirmation after price stabilizes above Right Shoulder zone (~3300–3320)
Or re-entry on a retest of neckline after breakout
- **Stop Loss:**
Below "Head" and OB zone (~3260)
- **Take Profits:**
- TP1: Neckline break zone (~3345)
- TP2: 3400 – Liquidity pool
- TP3: Final HH sweep (~3420+)
---
## ⚠️ Alternate Bearish Case:
> If price breaks below the "Head" zone and OB fails to hold,
> → Expect bearish continuation to the next liquidity zone near **VTA @ 3200**
---
## ✅ Summary:
This is a clean **bullish reversal setup** using SMC logic and a classic H&S pattern:
**OB + TLQ + BOS + Efficient Market + Clear Pattern ➝ High-Probability Setup**
Structure: 🟥 Bearish (macro)
Trend: 🔼 MSU (micro)
Efficiency: ✅ Efficient
Pattern: 🟩 Inverse Head & Shoulders
---
📊 Prepared by: **Mohsen Mozafari Nejad**
"Stealing Gold Profits: XAU/USD Long Setup (Risk-Reward Heist)"🔥 GOLD HEIST ALERT: XAU/USD Breakout Robbery Plan (Long Setup) 🔥
🌟 Hi! Hola! Ola! Bonjour! Hallo! Marhaba! 🌟
Attention, Money Makers & Market Robbers! 🤑💰💸✈️
Based on the 🔥Thief Trading Style🔥 (technical + fundamental analysis), we’re plotting a heist on XAU/USD (GOLD). Follow this master plan for a bullish escape near the high-risk ATR zone. Beware—overbought signals, consolidation traps, and bearish robbers lurk! Take profits fast and treat yourself—you’ve earned it! 🏆💸
📈 ENTRY: THE HEIST BEGINS!
Wait for Resistance Breakout (3400.00) → Then strike!
Buy Stop Orders: Place above Moving Average.
Buy Limit Orders: Use 15M/30M pullbacks (swing lows/highs).
Pro Tip: Set a chart ALERT to catch the breakout live!
🛑 STOP LOSS: DON’T GET CAUGHT!
For Buy Stop Orders: Never set SL before breakout!
Thief’s SL Spot: Recent swing low (4H timeframe).
Adjust SL based on your risk, lot size, and order count.
Rebel Traders: Place SL wherever—but you’ve been warned! 🔥
🏴☠️ TARGET: 3480.00
Scalpers: Long-only! Use trailing SL to lock profits.
Swing Traders: Join the robbery crew for bigger gains.
📊 MARKET CONTEXT:
XAU/USD is neutral but primed for bullish moves 🐂. Watch:
Fundamentals (COT Reports, GeoPolitics, News).
Intermarket Trends & Sentiment.
Positioning & Future Targets (Check our bio0 for analysis linkss!).
⚠️ TRADING ALERTS:
News Releases = High Volatility!
Avoid new trades during major news.
Use Trailing SL to protect open positions.
💥 SUPPORT THE HEIST!
Hit the Boost Button 💖→ Strengthen our robbery team!
Profit daily with the Thief Trading Style. 🏆💪🚀
Stay tuned for the next heist—more loot awaits! 🤑🐱👤🎉

Gold’s Big Heist—Will You Join the Loot or Get Robbed?🔥 GOLD HEIST ALERT: XAU/USD Breakout Robbery Plan (Swing & Scalp Strategy) 🔥
🌟 Greetings, Money Makers & Market Robbers! 🌟
Ready to loot the gold market? 🏆💰 Based on Thief Trading Style analysis (technical + fundamental), here’s how we execute the heist on XAU/USD—escape with profits before the bears trap us!
📈 ENTRY: The Heist Begins!
"Break the Wall!" Wait for RESISTANCE (3370.00) to crack, then strike!
2 Ways to Rob:
✅ Buy Stop above Moving Average (breakout confirmation)
✅ Buy Limit near pullback zones (15m/30m recent swing lows)
Pro Tip: Set a chart alert 🚨—don’t miss the breakout!
🛑 STOP LOSS: Protect Your Loot!
"Yo, listen! If you’re buying after breakout, DO NOT set SL until price confirms!
Thief’s SL Rule: Place at recent swing low (4H timeframe)—adjust based on your risk & lot size.
Rebels, beware! 🔥 Your risk, your rules… but don’t cry if the market robs you back!
🎯 TARGET: Escape Like a Pro
Main Take Profit: 3480.00 (or exit early if the market turns shady!)
Scalpers: Only LONG plays! Use trailing SL to lock profits.
Swing Traders: Ride the trend & split the loot wisely! 💰
⚠️ WARNING: News = Market Chaos!
Avoid new trades during high-impact news.
Trailing stops = your best friend to protect profits.
💎 WHY THIS HEIST?
XAU/USD Trend: Neutral (but bullish potential! 🐂)
Key Drivers: Geopolitics, COT data, macro trends—do your homework! 🌍📰
🚀 BOOST THE HEIST!
Like this plan? Smash the Boost Button! 🔥 Helps us steal more profits & share next robbery targets! Stay tuned—more heists coming soon! 🎯🤝
🎉 Happy Trading, Thieves! May the market favor your loot! �💸
Next Week Aims for 3300 Break💎 Last week, gold opened gap-up on Monday 🔼 but then trended lower 🔽. However, the 3290-3300 support zone remained robust from Mon-Thu ⚡. It plunged to ~3255 on Fri before rebounding 🌱. Next week's open may surge to 3290-3300 🔥!
🚀 Sell@3260 - 3270
🚀 TP 3280 - 3290 -3300
Accurate signals are updated every day 📈 If you encounter any problems during trading, these signals can serve as your reliable guide 🧭 Feel free to refer to them! I sincerely hope they'll be of great help to you 🌟 👇
XAUUSD: We must adapt to the market conditions! Bears in ChargeGold prices dropped as Trump announced a ceasefire between Iran and Israel, causing a significant decline. We anticipate this trend to persist, as recent price data, including volume and price momentum, indicates a strong seller’s control in the current market conditions. We have two targets for you to set your own based on your analysis, along with a stop-loss based on your strategy.
We appreciate your unwavering support throughout the years. Please like and comment.
Team Setupsfx_
❤️🚀
Gold has been falling continuously. Will it continue next week?Market review:
The conflict between Israel and Iran intensified, and gold surged in the early stage, and then continued to fluctuate downward. Affected by the situation in the Middle East and weak data from the United States, it fell severely in three trading days, and most of the other time periods were in the stage of repeated washing.
The first round of decline began at the high point of 3452. Affected by the situation in the Middle East, the price rose rapidly, but the rapid rise led to insufficient upward momentum, and the departure of buyers led to continuous declines in a single trading day. The second round of decline was affected by the easing of the conflict between Iran and Israel, and the US dollar, crude oil, and gold all plunged sharply; the third round of decline was Powell's wait-and-see attitude towards the interest rate cut policy, and some US data were bearish for gold, leading to a new round of decline.
Market outlook for next week:
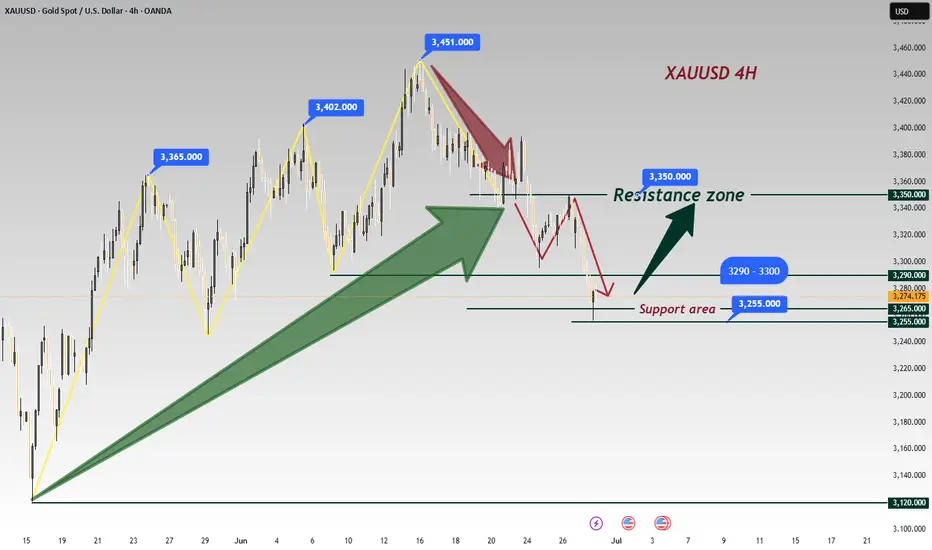
The breaking of the key support bands of 3303 and 3295 means that the downward adjustment has not ended, but after touching the support near 3250, there was a clear bottoming out and recovery. It means that there is strong support below, and the focus of next week's opening is the emergence of price rebound. There were rebounds to varying degrees after the previous two rounds of decline, so this round of decline still needs to be paid attention to. The strategy mainly revolves around shorting on price rebound, with a focus on the upward suppression range of 3285-3310.
If the rebound is small, then at the beginning of next week, it is likely to maintain a small fluctuation in the range of 3270-3285.
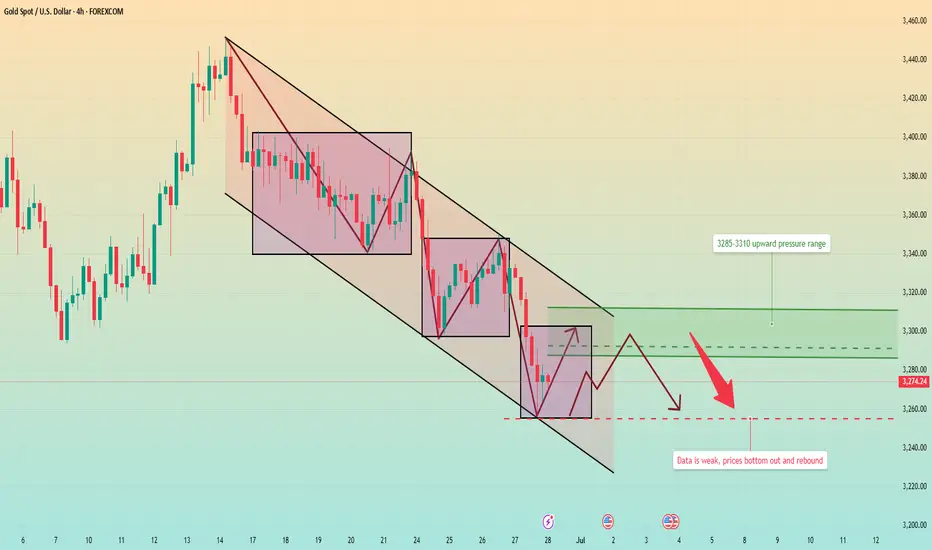
The data is negative. Will the price rebound from the bottom?Gold prices have continued to fall since the high near 3450. This trading day started the downward mode near 3328, and the European session continued to fall, breaking a new low. The negative PCE data also continued the downward mode. So far, it has rebounded after hitting the lowest level near 3255. However, the rebound is small, and the upper pressure is still very strong.
From the 4-hour chart, short-term resistance focuses on the vicinity of 3295-3300, followed by important pressure near 3315. The short-term support below focuses on the vicinity of 3265-3270. The overall strategy of shorting at high positions remains unchanged based on this range.
Operation strategy:
Short at the price rebound near 3295, short covering at the high point of 3315, stop loss 3325, profit range 3370-3360.
At present, the price fluctuates greatly. If you want to try scalping transactions, you can trade with a light position and float up and down 5 points to stop loss or profit in time.
This is the last trading day of this week. I hope you all will gain something and have a happy weekend with your family.
XauUsd for LongAs for i see Xauusd in Downside for correction first target is 3200 2nd Target is 3155.
It is my Analysis may be it will be wrong no one predict market’s future.
Note:- It is not Financial Idea may people lose money.!
Trade your own never give to Manage.

Gold Analysis and Trading Outlook – June 27Good morning, everyone!
Yesterday, gold encountered resistance in the 3348–3352 zone and fell back to around 3310 before rebounding toward the 3336 resistance area. Today’s session opened with renewed weakness, and so far, the overall price action has closely followed our expectations. Whether it was selling near resistance, buying after the dip, or shorting the rebound, each opportunity yielded solid profits.
Some traders have asked about my strategy’s win rate. Those who’ve followed consistently already know—the overall win rate has remained above 80%, with very few instances of error. Even in the rare case of a misjudgment, I apply specific recovery strategies to minimize risk and avoid large losses. That’s the core reason why I’m confident I can help many traders.
Technically, the daily chart still shows a bearish trend, and prices are now approaching the key 3300 support zone. While the current geopolitical uncertainty adds complexity, it doesn't prevent us from executing flexible intraday trades. In fact, range-bound markets can still be highly profitable with a disciplined approach.
Key intraday levels to watch:
Dynamic support: 3318–3313
Major support: 3300–3287
Resistance levels: 3336, 3348–3352, and 3370
Today’s trades can continue to focus on these levels, using a sell-high, buy-low strategy with flexibility.
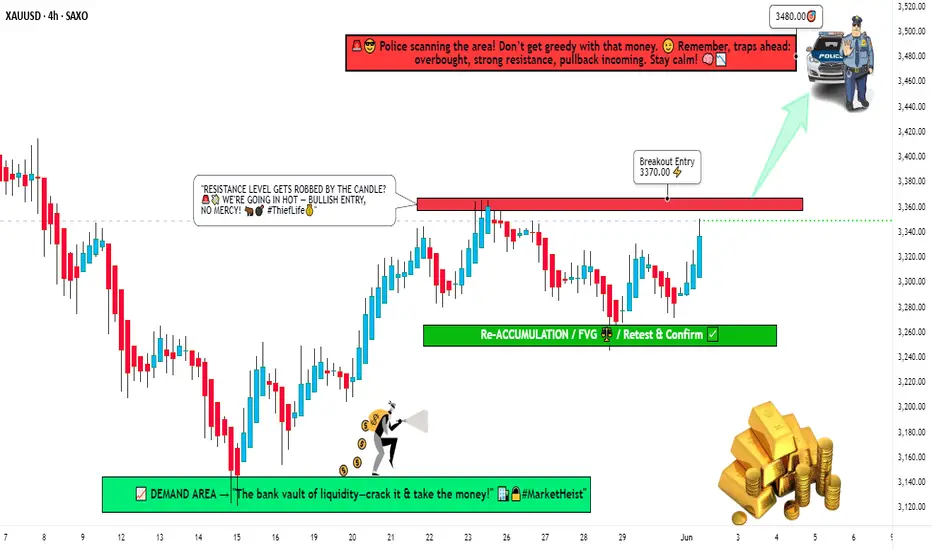
"Gold Vault Breach! XAU/USD Heist Plan in Motion"🏴☠️💰 XAU/USD Gold Heist Blueprint 💰🏴☠️
“The Vault’s Open… Time to Load Up!”
🌟Hi! Hola! Ola! Bonjour! Hallo! Marhaba!🌟
Dear Money Makers & Market Robbers 🤑💰💸✈️
Get ready to execute the Golden Robbery with style and precision! Based on our 🔥Thief Trading Style🔥 using both technical & fundamental weapons, we’ve decoded the latest gold vault password: XAU/USD (Gold vs USD) is showing bullish bias!
🎯 Heist Instructions:
📈 Entry Point –
“The vault is wide open!”
Enter long anytime — but for the sharp shooters, place buy limits on the most recent 15/30min swing lows or pullback zones for a stealthier entry. Let the retracement pull the guards away 😏🔐
🛑 Stop Loss –
🔒 Set your Thief SL just below recent swing lows on the 4H timeframe (around 3310.0).
🔧 Adjust based on risk tolerance, lot size, and number of open trades — every heist has its escape plan!
🏁 Target Zone –
🎯 Aim for 3395.0 — or vanish before the cops show up!
Trail the stop as you go and don’t get greedy — wealth is preserved when exits are clean! 🏃♂️💨
🧲 Scalper's Advisory:
Only steal on the Long Side! Bulls are funding this operation.
💼 Big pockets? Dive in.
💳 Small stack? Swing with the pros & follow the plan.
🎯 Use Trailing SL to keep the loot safe.
📊 Market Insight – Why We Rob Gold Now?
XAU/USD shows bullish momentum 🐂 backed by:
Macro & Fundamental Data 🧠
Geopolitical & Intermarket Trends 🌍
COT Reports & Sentimental Outlook 💼
Dollar Weakness + Safe Haven Flow 💸
📚 Always cross-check the news wires & reports to validate the path! Fundamentals are the lockpick tools behind every breakout! 🔓📈
⚠️ Stealth Warnings:
📆 News Events = Increased Surveillance!
🚫 No new entries during high-volatility news drops.
🛡 Use Trailing SL on live trades to secure the bag.
💖 Wanna Support Our Heist Style?
Smash that 🚀 BOOST BUTTON 🚀
It fuels our Thief Army and helps you & your crew loot the market with confidence and flair!
Every day’s a new caper — follow the plan, manage your risk, and stay outta jail! 🏆💪🤝🎉
🔐 See you in the next Robbery Blueprint — Stay Locked & Loaded!
🐱👤💼📈💣💸