Waiting for data release to rebound and short📰 Impact of news:
1. PCE and Consumer Index
📈 Market analysis:
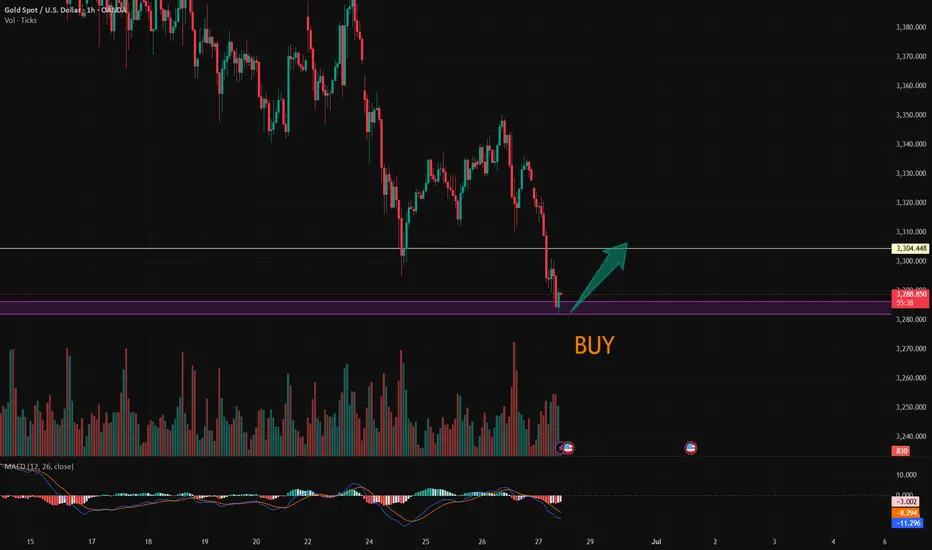
The current price of 3280 has a higher profit and loss ratio advantage. Technical indicators show that the hourly chart is severely oversold. Combined with the top and bottom conversion of 3300 above, there is a 20-point rebound space in the short term. If the PCE data is in line with the trend, gold prices are expected to quickly regain the 3,300 mark. Note that negative data beyond expectations may cause a brief decline.
🏅 Trading strategies:
BUY 3295-3280-3275
TP 3298-3300-3310
SELL 3300-3310
TP 3290-3280-3260-3250
If you agree with this view, or have a better idea, please leave a message in the comment area. I look forward to hearing different voices.
TVC:GOLD FXOPEN:XAUUSD FOREXCOM:XAUUSD FX:XAUUSD OANDA:XAUUSD
Xauusdsignal
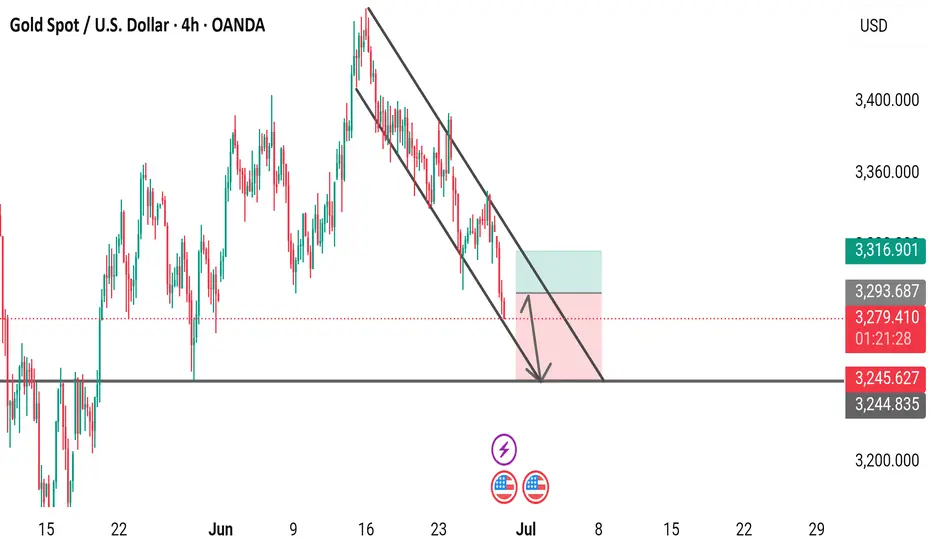
Gold Spot / U.S. Dollar - 4 Hour Chart (OANDA)4-hour chart from OANDA shows the price movement of Gold Spot (XAUUSD) against the U.S. Dollar, with the current price at 3,282.135, reflecting a decrease of 45.685 (-1.37%). The chart includes a descending trendline, support and resistance zones (highlighted in pink and teal), and key price levels ranging from 3,244.835 to 3,400.000. The analysis suggests a potential downward movement as the price approaches a support zone near 3,244.975, with indicators like the U.S. flag and lightning bolt possibly signaling significant market events or volatility.

Gold Spot / U.S. Dollar (XAUUSD) 4-Hour Chart - OANDA4-hour chart from OANDA shows the price movement of Gold Spot against the U.S. Dollar (XAUUSD), with the current price at 3,282.080, reflecting a decrease of 45.740 (-1.37%). The chart includes a downward trendline indicating a potential bearish trend, with key support and resistance levels marked at 3,245.627 and 3,316.901, respectively. The chart covers data from June to July 2025, with the latest update at 01:22:46.
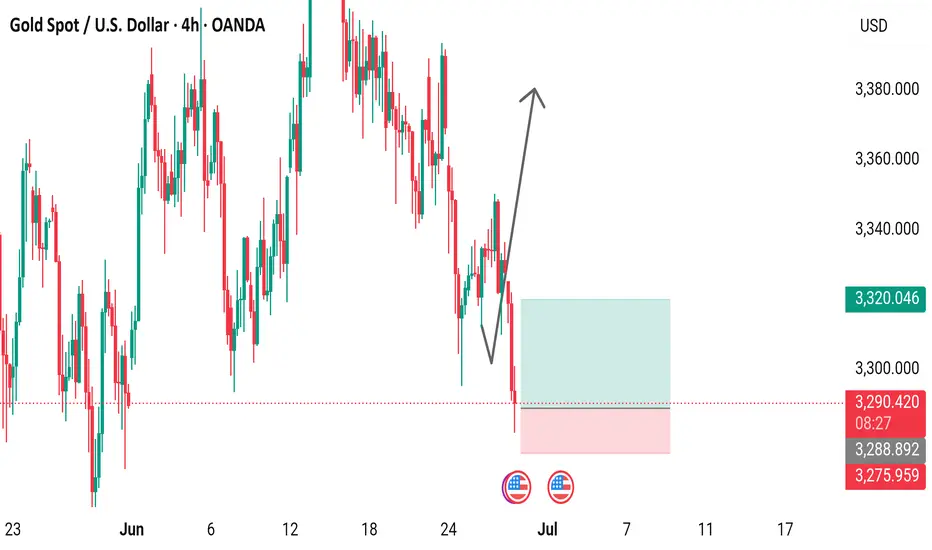
Gold is weak. Can it continue?Gold is still fluctuating and falling slightly today. Gold is weak, so gold is likely to be short-term. If the price rebounds, it will be a short opportunity.
We need to pay attention to the release of US PCE data later.
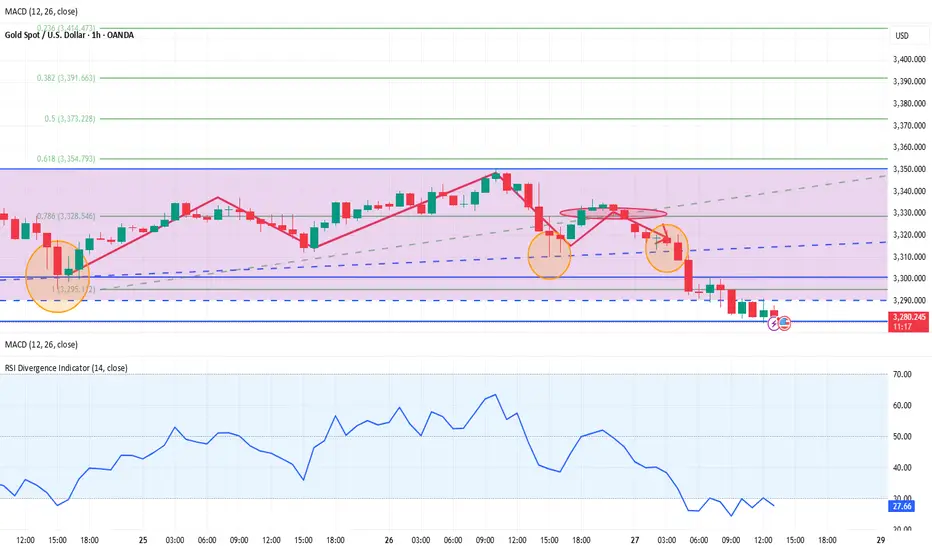
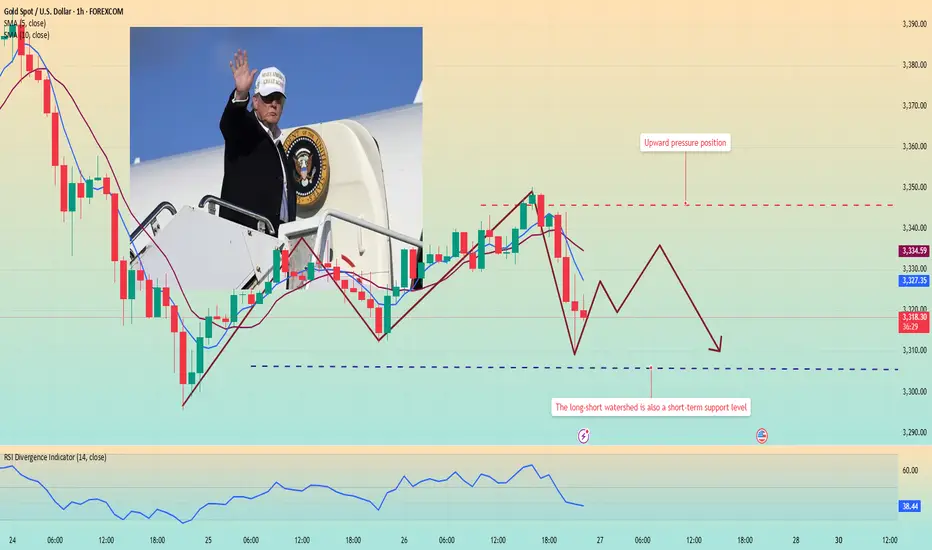
From the 1-hour chart
the moving average continues to cross the short arrangement and diverge downward. After gold fell below the early support near 3340, it began to move downward weakly. The current upward pressure is around 3295-3310.
From the daily chart, the price is below the MA20 cycle and the 50 cycle, but remains above the 100 cycle. The technical indicators turned higher, but the momentum indicator is at a neutral level, and the RSI index is around 42.7, which does not point to an upward trend.
Since the upcoming data may have some impact on the price, the price may have a short-term high opportunity. Steady trading is still waiting for the price to rise and then short. Of course, if your trading strategy is more aggressive, you can use a long strategy before the price rises.
Operation suggestions:
Radical: Buy near 3280, stop loss at 3265, profit range 3305-3310.
Conservative: Wait for the price to rise and then bear pressure, sell near 3310, stop loss at 3320, profit range 3290-3285.
XAUUSD:Go long
Short - term first do a rebound.
Trading Strategy:
BUY@3283-86
TP:3297-3304
More detailed strategies and trading will be notified here ↗↗↗
Keep updated, come to "get" ↗↗↗
Gold Spot / U.S. Dollar (XAU/USD) 4-Hour Chart - OANDA4-hour chart from OANDA displays the price movement of Gold Spot (XAU/USD) from late June to mid-July 2025. The current price is $3,290.270, reflecting a decrease of $37.475 (-1.13%) as of 09:42. The chart highlights a recent upward trend followed by a potential support zone around $3,200-$3,300, with a marked resistance level near $3,380. The analysis suggests a possible reversal or consolidation phase.
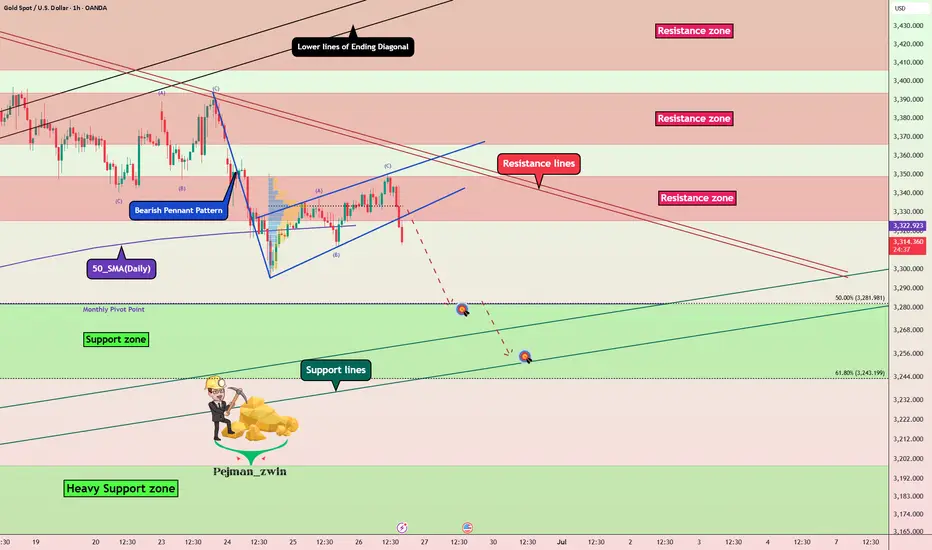
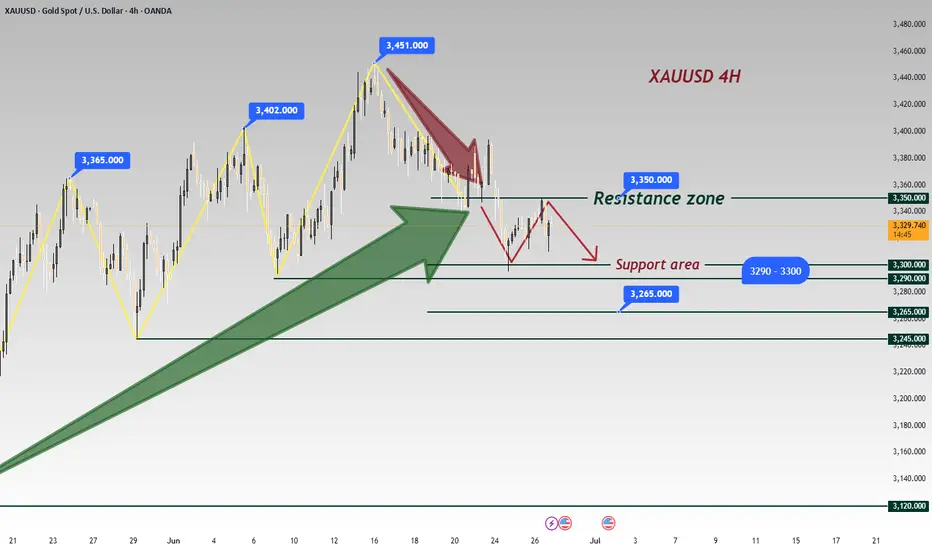
Gold Breakdown Confirmed — Bearish Pennant Targets UnfoldingGold ( OANDA:XAUUSD ) started to decline as I expected in my previous idea after the lower lines of the Ending Diagonal broke .
Gold is moving near the Resistance zone ($3,349-$3,325) . And Gold seems to be crossing the 50_SMA(Daily) .
From a Classical Technical Analysis perspective , the Bearish Pennant Pattern seems to indicate a continuation of the downtrend in Gold .
From an Elliott wave theory perspective , it seems that Gold has completed the Zigzag Correction(ABC) , and we can expect the next 5 downwaves .
I expect Gold to continue to decline at least to the Support zone($3,281-$3,243) and Monthly Pivot Point .
Note: Stop Loss (SL) = $3,360
Gold Analyze (XAUUSD), 1-hour time frame.
Be sure to follow the updated ideas.
Do not forget to put a Stop loss for your positions (For every position you want to open).
Please follow your strategy; this is just my idea, and I will gladly see your ideas in this post.
Please do not forget the ✅ ' like ' ✅ button 🙏😊 & Share it with your friends; thanks, and Trade safe.
XAU/USD GOLD 4H + 1H PREMIUM TECHNICAL OUTLOOK – JUNE 27, 20254-HOUR TIMEFRAME – HIGHER TIMEFRAME BIAS
Gold continues to trade near its all-time highs, consolidating just below a recent swing high of $3,315. Despite minor pullbacks, the macro trend remains bullish, with bullish structure still intact. Recent price action shows shallow retracements and strong rejections of key fib levels, a typical sign of underlying smart money accumulation.
Price Action & Market Structure
Gold recently printed a Break of Structure (BOS) at $3,290, followed by a retest of the broken level.
We observed a Change of Character (CHoCH) near $3,300, quickly invalidated by bullish strength – further confirming accumulation behavior.
Market remains in bullish alignment unless $3,250 is broken decisively.
Key Support & Resistance Zones
Resistance $3,315–$3,320
Demand $3,275–$3,282
Support $3,250
Targets $3,340 / $3,355
Smart Money Concepts (SMC)
Liquidity Grab beneath $3,275 likely triggered retail stop hunts
4H Bullish Order Block between $3,275–$3,282 remains unmitigated
Imbalance Zone: $3,283–$3,289 – price may wick into this before launch
Sell-side liquidity taken below $3,275 → bullish reaction
Buy-side liquidity sits above $3,315 → likely short-term magnet
ZOOMING INTO 1-HOUR CHART – INTRADAY SETUPS
The 1-hour chart aligns with the bullish higher-timeframe bias, offering two potential premium-level setups:
Setup #1: Bullish Rejection from 4H OB
Entry Zone: $3,275–$3,282
This setup targets a liquidity sweep beneath $3,275 followed by bullish mitigation of a clean order block and imbalance zone. Confluence across fibs, OB, and structure support increases probability.
Setup #2: Breakout Retest Play
Trigger: Clean breakout and retest of $3,315
Entry: On successful retest (bullish confirmation candle)
Ideal if momentum pushes through local resistance, clearing buy-side liquidity. Reclaim of structure suggests smart money continuation.
Bearish Contingency (Low Probability for Now)
If price breaks below $3,250 and confirms below structure:
Look to short on retests into $3,275
Target next demand around $3,235
Until that happens, bullish bias remains dominant.
Gold remains one of the most structured and responsive instruments to smart money technicals right now. A well-planned entry around demand, imbalance, or breakout levels provides excellent RRR potential if structure holds.

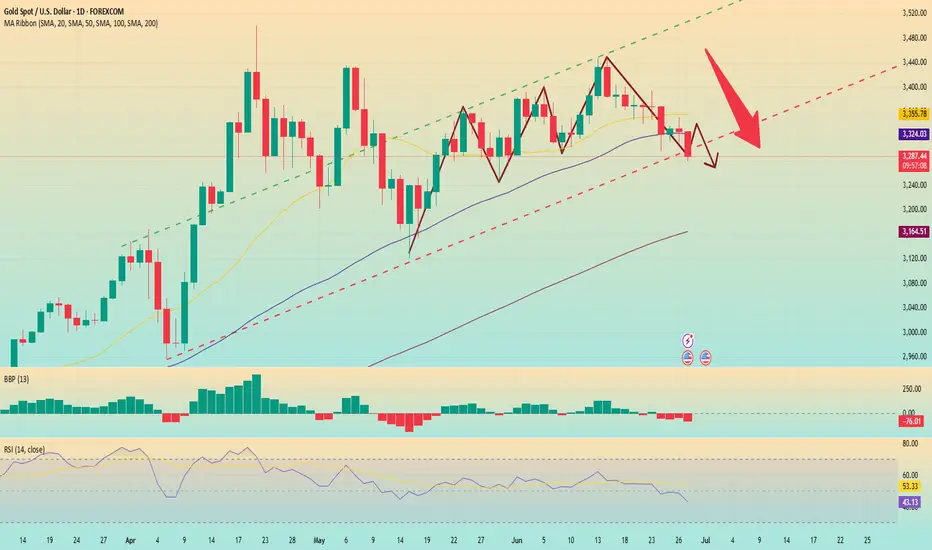
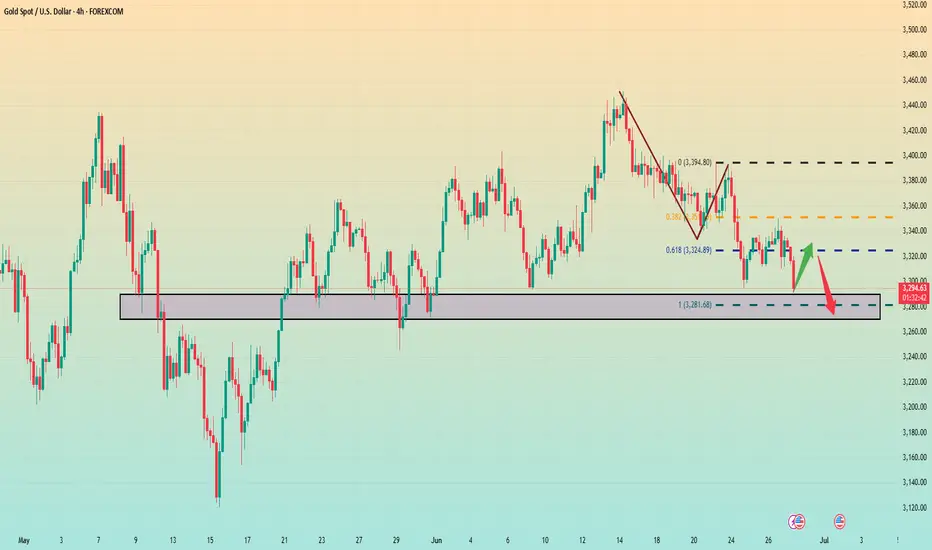
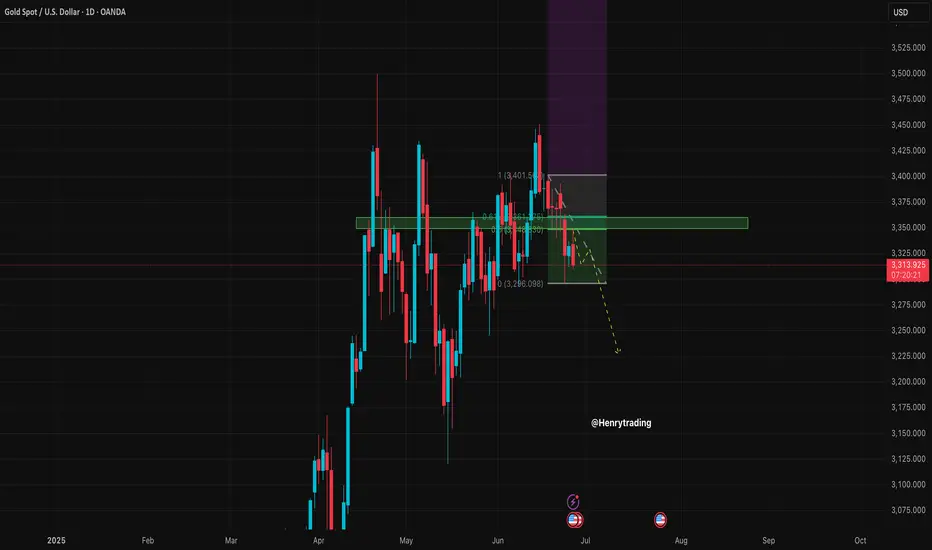
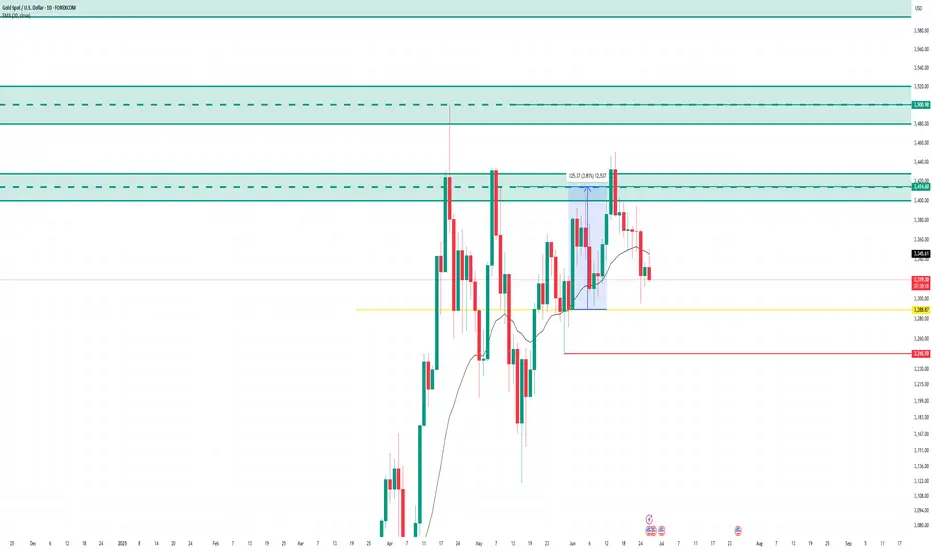
Gold breaks down. It may reach a low point.From the current market daily chart
The absolute support of gold is around 3280. Gold is basically in the process of maintaining this daily trend support line. Therefore, I personally think that around 3280 is a long-short dividing line for gold. If gold falls below 3280 on the daily line, it is very likely that the decline will just begin. On the contrary, be careful. If 3280 does not fall below, there is still a possibility of rebounding.
In the 4-hour chart, from the high point of 3450 to now, the 0.382 position is just around yesterday's high point of 3350. The 0.618 position is at 3325, and the final 100% position is around 3280. 3280 also coincides with the daily chart.
Therefore, gold must at least test around 3280 today, and it is not ruled out that there will be lower positions.
Analysis and layout of the latest gold trends during the day📰 Impact of news:
1. PCE and Consumer Index
📈 Market analysis:
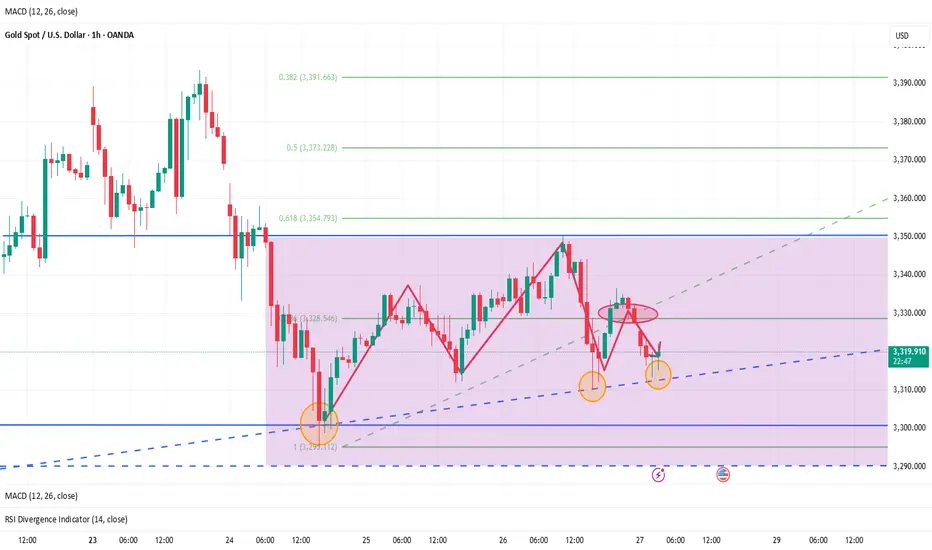
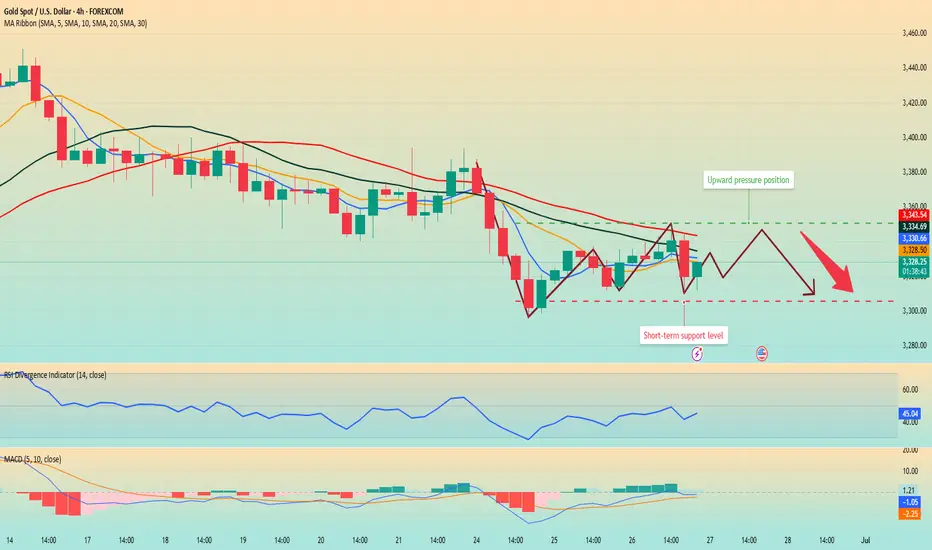
Judging from the 4H chart, the Bollinger Bands are closing and the MACD is showing a trend of forming a death cross, indicating that the short-selling momentum is still relatively strong in the short term. However, as the overall upward structure has not been destroyed, there is still a possibility of a rebound and repair in the future. During the day, we need to pay special attention to the support strength of the MA5 and MA10 moving averages. It is recommended to adopt the idea of shorting at high levels and going long at low levels. The key support below is the 3305-3295 area, and the upper resistance is the 3340-3350 range. However, judging from the chart, in the short term, there may be a rebound near 3313. At present, it has indeed rebounded to around 3319 as expected. If it falls weakly to this week's low of 3295, you can buy if it does not break. On the whole, if it rebounds to 3335-3345, you can consider shorting, and if the support below 3305-3295 is not broken, go long. Today is Friday, and as it is near the end of the month, market liquidity is strong. Please be cautious in your operations today and be sure to set stop losses strictly.
🏅 Trading strategies:
SELL 3335-3345-3350
TP 3320-3315-3300
BUY 3305-3295
TP 3310-3320-3330
If you agree with this view, or have a better idea, please leave a message in the comment area. I look forward to hearing different voices.
Bulls and bears are anxious? Rebound continues to empty📰 Impact of news:
1. Initial unemployment claims data
📈 Market analysis:
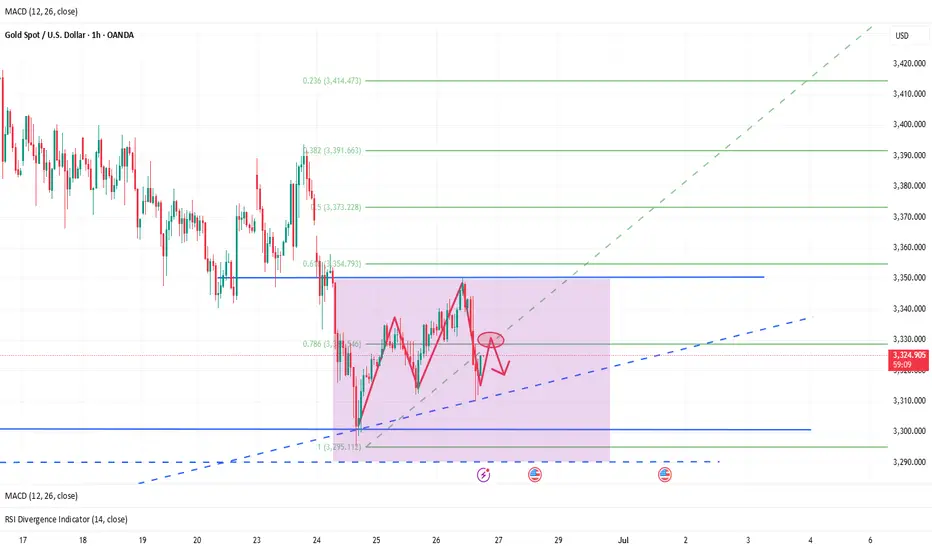
Gold is in a sideways consolidation near 3320 in the short term. The market has no clear direction for the time being, and the long and short positions are in a tug-of-war. The hourly line rebounded to 3328 and then fell back again, suggesting that there is still room for short-term retracement. The current operation needs to focus on key points: if it rebounds to the 3320-3330 resistance area, you can consider entering short positions again. If the market continues to decline, focus on the 3300-3290 support range. If it stabilizes, long orders can be arranged. The overall idea is to maintain a volatile market. Before effectively breaking through 3350 or falling below 3290, high-altitude and low-multiple is still the main strategy.
🏅 Trading strategies:
SELL 3320-3330
TP 3310-3300-3290
BUY 3310-3300
TP 3320-3330-3340
If you agree with this view, or have a better idea, please leave a message in the comment area. I look forward to hearing different voices.
OANDA:XAUUSD FX:XAUUSD FOREXCOM:XAUUSD FXOPEN:XAUUSD TVC:GOLD
6/25 Gold Analysis and Trading ViewGood morning, everyone!
Gold experienced a sharp decline yesterday. Technically, the conditions for a rebound are in place, but since a solid bottom structure has yet to form, a retest to the downside is likely during today’s session.
Key levels to watch:
Resistance zone: 3336–3348
Support zones: Primary support at 3313–3303, with additional support around 3296–3282
Today’s overall strategy remains buying on dips as the primary approach, with short opportunities near resistance as a secondary option.
Key scenario to monitor:
If the price drops to around 3280 but fails to rebound toward 3336, and the daily close ends below 3300, then the buy-on-dip strategy will likely continue into tomorrow.

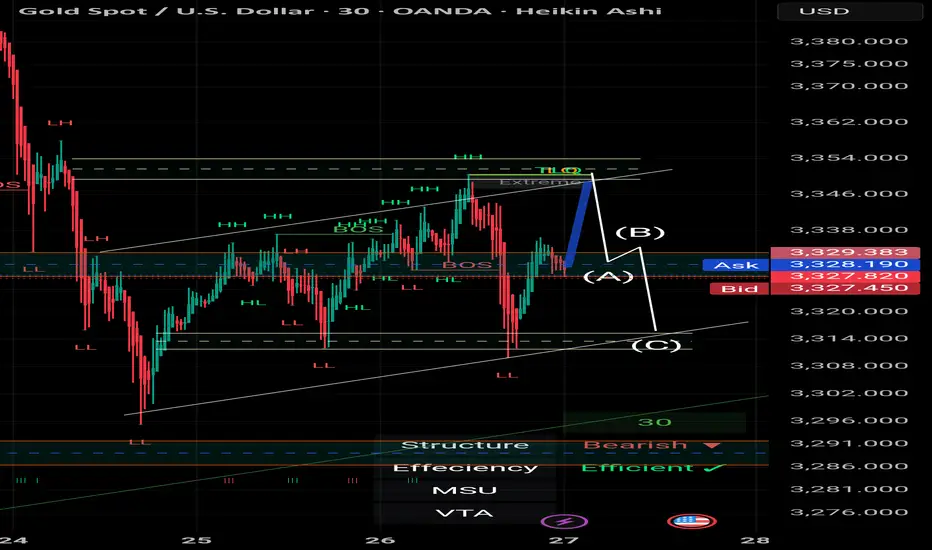
Scalping Strategy Using BOS & OB | Gold Spot | by Mohsen MozafarDescription:
> This is a 30-minute scalping setup on Gold Spot (XAU/USD), based on Smart Money Concepts (SMC) — focusing on Break of Structure (BOS) and Order Blocks (OB).
Analysis and strategy are prepared by Mohsen Mozafari Nejad.
---
📊 Market Context:
Current Structure: Bearish
Short-Term Market Structure: MSU (Market Structure Up)
Efficiency: Confirmed (clean price action & response zones)
---
🧠 Technical Highlights:
1. Double BOS confirms recent shifts in momentum
2. TLQ (Top Liquidity Quest) formed after HH (Higher High) and liquidity sweep
3. Key Demand OB identified (labeled A) — valid based on BOS confirmation
4. Expecting a bounce from OB (A) towards (B) as a reaction to unfilled imbalance
5. Potential drop from TLQ zone (B) to (C) if liquidity is fully absorbed
---
🎯 Scalping Plan:
Entry Zone:
Order Block at (A), waiting for CHoCH or bullish price action confirmation
(preferably on lower timeframe like M5)
Stop Loss:
Just below OB (around 3327)
Take Profits:
TP1: Near TLQ / Extreme zone (B)
TP2: Further liquidity grab or possible continuation above previous HH
---
❗ Alternative Bearish Scenario:
If price fails to hold at OB (A) and breaks below 3327 with BOS,
→ short opportunity opens toward new lows at 3314–3310 (labeled C).
---
✅ Summary:
This is a clean scalping setup following SMC principles:
BOS → OB → Liquidity → Reaction
Focus on structure, precision, and quick confirmation signals.
Prepared by:
📌 Mohsen Mozafari Nejad
Gold: Resistance Validated, Short at 3340-3350 Tomorrow📈 Gold Trading Recap & Tomorrow's Strategy: Resistance Holds, Short Opportunities Persist
💎 Today's newly updated live short strategy hit the TP target successfully! As mentioned earlier, when gold failed to break the support level, we anticipated it to range around 3330—today's trades were precisely centered on this logic. The 3350 resistance was also validated firmly during the session.
💎 Expect further upside in tomorrow's Asian session—recommend continuing short positions within the 3340-3350 range 🚀
🚀 Sell@3350 - 3345
🚀 TP 3335 - 3325 - 3315
Accurate signals are updated every day 📈 If you encounter any problems during trading, these signals can serve as your reliable guide 🧭 Feel free to refer to them! I sincerely hope they'll be of great help to you 🌟 👇
Gold is sideways. Is a new trend brewing?Information summary:
On June 23, Trump announced that Iran and Israel reached a comprehensive ceasefire, but the asymmetric terms of the agreement caused the conflict to continue. Israel launched another air strike on Iran, and Israel threatened to kill Iranian senior officials. The uncertainty of geopolitical risks continues to support gold prices.
Market analysis:
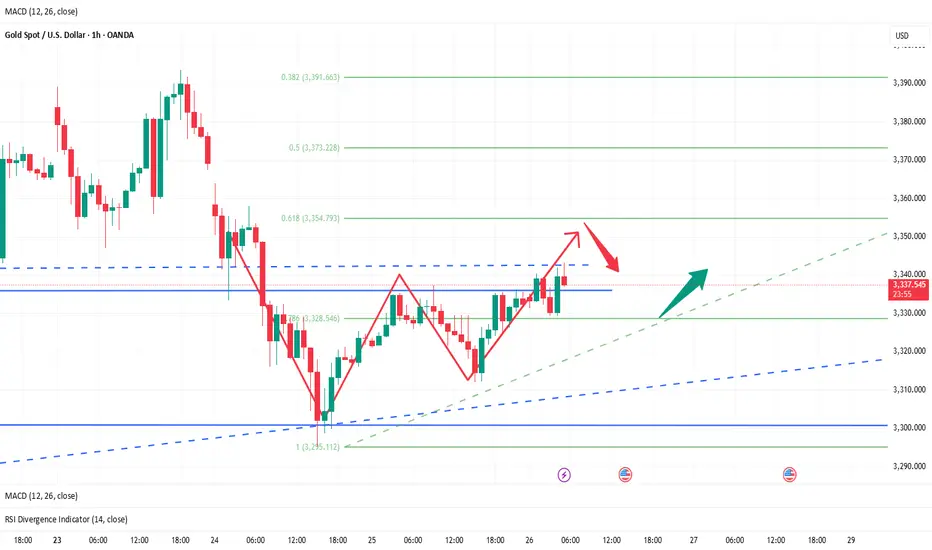
From the 4-hour chart, the MA5-day and 10-day moving averages show signs of upward divergence, and the K-line stands firm on the moving average support and fluctuates upward. In the short term, pay attention to the breakthrough and decline of the 3350 pressure level. The current market's downward momentum has weakened, and the overall market remains volatile. We need to be wary of the risk of short-term adjustments after continuous surges. Be alert to the short-term adjustment risks after continuous highs.
Operation strategy:
Short near the price rebound of 3345, stop loss 3355, profit range: 3330-3320.
Gold fluctuates at high levels, intraday trading points📰 Impact of news:
1. Initial unemployment claims data
📈 Market analysis:
Gold has begun to show signs of bottoming out in the short term in the past two days. Since the daily line bottomed out and pulled up, the daily line closed positive yesterday, and the bulls began to counterattack, and the 1H low was rising. If it doesn't fall further in the short term, it will most likely bottom out and rebound. The upper pressure is at the Bollinger middle track of 3355, which is also the high point of Tuesday's decline. If gold breaks and stabilizes at this price, it will have a larger upward space, and the upper side will look at 3385. In the 4H chart, MACD temporarily forms a golden cross, which is a bullish signal; but the BOLL track pressure is still there, and gold bears still have momentum in the short term. Therefore, on the whole, in the short term, gold should pay attention to the 3350-3360 resistance above. If it encounters resistance under pressure here, it can consider shorting. Pay attention to the 3330-3320 support area below.
🏅 Trading strategies:
SELL 3350-3360
TP 3340-3330-3320
BUY 3330-3320
TP 3340-3350
If you agree with this view, or have a better idea, please leave a message in the comment area. I look forward to hearing different voices.
TVC:GOLD FXOPEN:XAUUSD FOREXCOM:XAUUSD FX:XAUUSD OANDA:XAUUSD
Gold volatility intensifies. Waiting for direction?The price of gold fluctuated greatly this week, which means that the end point of sentiment will not disappear so easily for the time being; in the short-term K-line pattern, there are continuous ups and downs. If you want to trade steadily, you can wait and see for a while.
From the hourly chart, the MA5-day and 10-day moving averages cross downward, and the RS indicator hovers around 40.7. This shows that the market trend is weak. The current price has bottomed out near 3310 and rebounded to fluctuate around 3320. The price may continue to decline after a slight rebound.
Today, focus on the long opportunities near 3305 and the pressure position above 3345.
Quaid has always believed that only by insisting on detailed analysis of the market and reducing losses, can we slowly accumulate the principal of the account.
Good luck to everyone.
6/26 Gold Analysis and Trading ViewGood morning, everyone!
Yesterday, gold rose to around 3336 before pulling back, then revisited the same level again. The buy-on-dip strategy performed well, delivering solid profits.
At today’s open, prices have moved slightly higher but remain near resistance. Technically, there’s potential to test the 3350 area, and if the move is strong, a rally toward 3370 is also possible.
If gold reaches this zone, it may present a favorable short-term selling opportunity. Therefore, today's trading strategy should focus on range-based trading between 3326-3368, selling near resistance and buying near support.
Key levels to watch:
Resistance: 3348–3352
Support: 3326–3318
Lastly, be mindful: if a trending move emerges, adjust your strategy accordingly and avoid counter-trend trades. Stay flexible and manage risk wisely.

XAUUSD has been in a strong free fall following the sell strategXAUUSD has dropped sharply in a free fall, perfectly following the sell strategy from 3348–3350.
We have won.
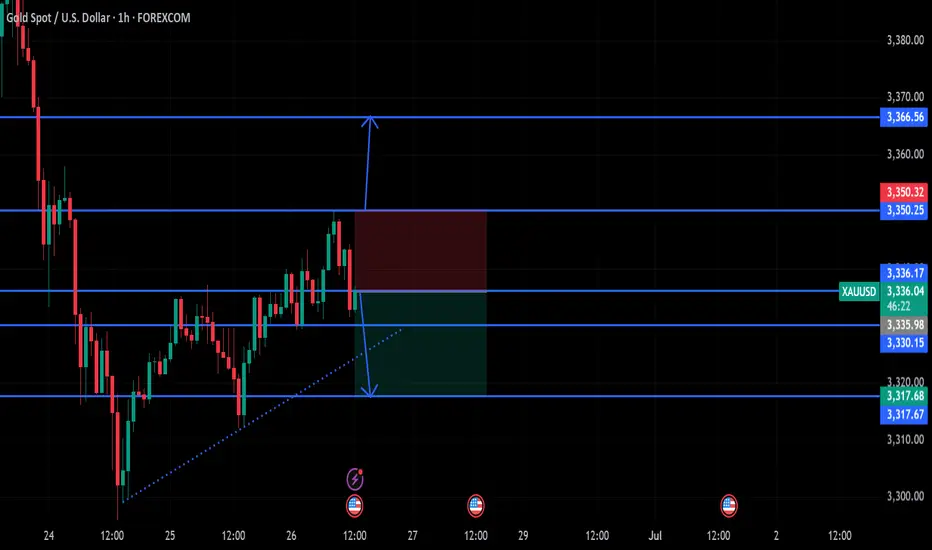
Trading Strategy for XAUUSD OANDA:XAUUSD
Based on the current price structure and short-term bias, here are two tactical trade setups:
Sell Setup – If Price Rejects Resistance
Entry: 3,348 – 3,350 USD
Stop-loss: 3,357 USD
Take-Profit 1: 3,340 USD
Take-Profit 2: 3,335 USD
Take-Profit 3: 3,330 USD
Buy Setup – If Price Holds Support
Entry: 3,328 – 3,330 USD
Stop-loss: 3,320 USD
Take-Profit 1: 3,338 USD
Take-Profit 2: 3,340 USD
Take-Profit 3: 3,348 USD
Important: Always set a stop-loss in every trade to manage risk effectively.
xauusd updateentry price 3288
stop loss update 3289
take profit
3414
3500
3625
hit first target now risk free
Gold Builds Bullish Momentum After $3,294.0 ReboundGold bounced from $3,294.0, forming a double bottom pattern as XAU/USD consolidates near $3,330.0. Stochastic has exited oversold territory, signaling strengthening bullish momentum.
If $3,294.0 holds as support, the uptrend may continue toward the $3,393.0 target.
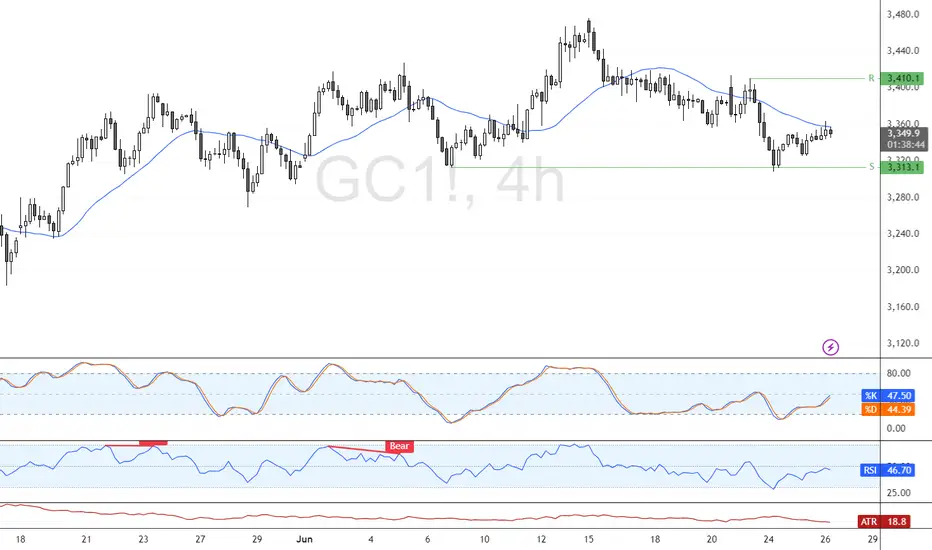
gold on bearish retest#XAUUSD price have retrace back 3350.2 which is retesting back below day low.
Below 3336 holds short sell which target 3330-3317, but main entry for selling 3330, SL 3346.
Breakout above 3350.2 holds strong buy which will reach 3366 for bearish reversal.
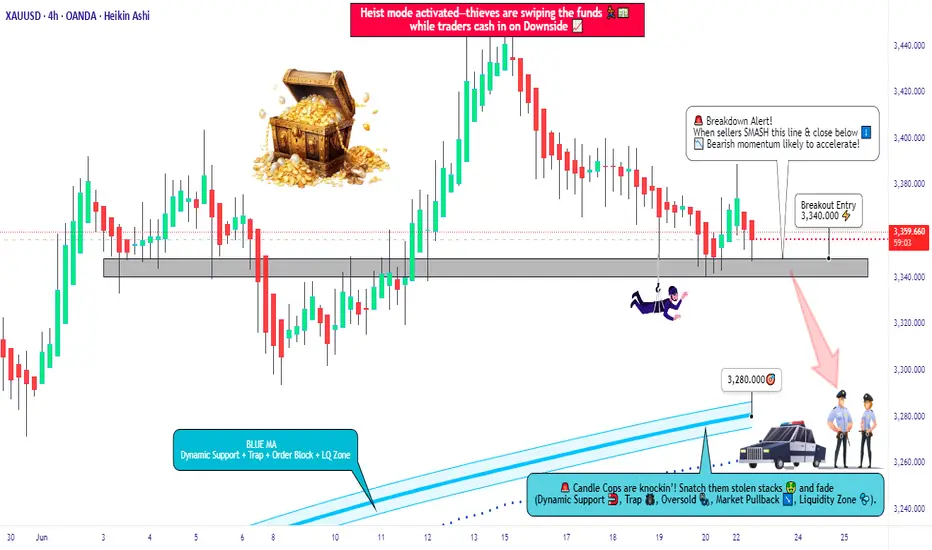
XAU/USD Bearish Bomb Ready to Explode? (Entry Levels Inside)🏦💰 GOLD HEIST ALERT: XAU/USD Bearish Raid in Progress! (Short Setup Inside) 💰🏦
🚨 Cops Waiting at Resistance? Here's How to Steal Pips & Escape Safely! 🚨
🦹♂️ ATTENTION ALL MARKET BANDITS!
To the Profit Pirates & Risk-Takers! 🌍💣
Using our 🔥Thief Trading Tactics🔥 (a lethal mix of liquidity grabs + institutional order flow + macro traps), we're executing a bearish gold heist on XAU/USD—this is not advice, just a strategic robbery plan for traders who play by their own rules.
📉 THE GOLD VAULT RAID (SHORT ENTRY PLAN)
🎯 Loot Zone: 3280.00 (or escape earlier if bulls fight back)
💣 High-Stakes Play: Neutral trend turning bearish - trap for late buyers
👮♂️ Cop Trap: Where bullish traders get arrested by resistance
🔪 ENTRY RULES:
"Heist Activated!" – Strike when price breaks 3340.00
Sell Stop Orders above MA OR Sell Limit on pullbacks (15-30min TF)
Aggressive? Enter at market but use tighter stops
📌 SET ALERTS! Don't miss the breakdown
🚨 STOP LOSS (Escape Plan):
Thief SL at 3390.00 (4H swing high)
⚠️ Warning: "Ignore this SL? Enjoy your margin call."
🎯 TARGETS:
Main Take-Profit: 3280.00
Scalpers: Ride the bear waves only
🔍 FUNDAMENTAL BACKUP (Why This Heist Works)
Before raiding, check:
✅ COT Data (Are big players dumping gold?)
✅ Real Yields (TIPS vs Gold correlation)
✅ Geopolitical Heat (Safe-haven flows drying up?)
✅ DXY Strength (Dollar crushing commodities?)
🚨 NEWS RISK WARNING
Avoid NFP/CPI/FOMC periods (unless you like volatility torture)
Trailing stops = your get-out-of-jail-free card
💎 BOOST THIS HEIST!
👍 Smash Like to fund our next raid!
🔁 Share to recruit more trading outlaws!
🤑 See you at the target, rebels!
⚖️ DISCLAIMER: For entertainment only. Trade at your own peril.
#XAUUSD #GoldTrading #TradingView #LiquidityGrab #ThiefTrading
💬 COMMENT: "Short already—or waiting for confirmation?" 👇🔥