XAUUSD Hello traders.
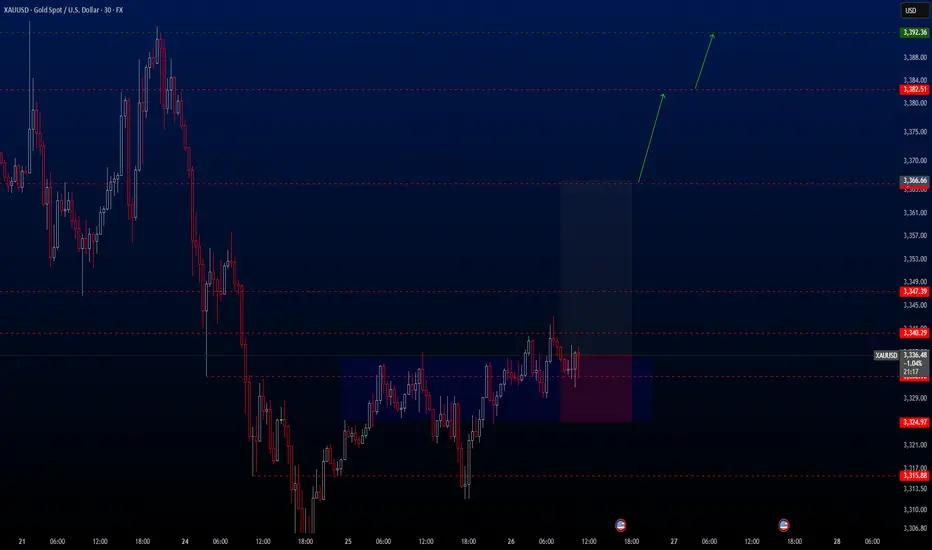
Today’s first trade setup comes from the XAUUSD pair. The pair is currently positioned in an ideal buy zone, and I’ve spotted a potential long opportunity. There are three different take profit levels, all of which are listed below. Personally, I’ll be closing my position at the first TP level: 3366.66.
However, keep in mind that two major economic events will be released today:
📌 Gross Domestic Product (GDP) (QoQ) – Q1
📌 Initial Jobless Claims
These are highly impactful events, so please manage your risk accordingly.
🔍 Trade Details
✔️ Timeframe: 30-Minute
✔️ Risk-to-Reward Ratio: 1:2.5
✔️ Trade Direction: Buy
✔️ Entry Price: 3336.62
✔️ Take Profit: 3366.67 / 3382.51 / 3392.36
✔️ Stop Loss: 3324.97
🕒 If momentum fades or the price consolidates within a tight range, I’ll keep this trade open only until 23:00 (UTC+4). After that, I’ll close it manually—whether in profit or loss—depending on how the price action evolves.
🔔 Disclaimer: This is not financial advice. I’m simply sharing a trade I’ve taken based on my personal trading system, strictly for educational and illustrative purposes.
📌 Interested in a systematic, data-driven trading approach?
💡 Follow the page and turn on notifications to stay updated on future trade setups and advanced market insights.
Xauusdsignal
XAU/USD – Smart Money Building Toward $3360? |26 June 2025Gold (XAU/USD) is pushing into fresh highs around $3337, and we may be approaching a key inflection point. But beneath the surface of candles and wicks lies the real story — one written by liquidity, displacement, and smart money positioning.
This outlook breaks down gold’s price action using Smart Money Concepts (SMC), price structure, and Fibonacci confluence, to help identify the most probable high-value trade zones for both swing and intraday traders.
4H Outlook – Institutional Flow & Structure
Market Structure
Gold recently broke above the $3310–$3320 resistance, confirming a bullish Break of Structure (BOS). This keeps the market in a sequence of higher highs and higher lows, validating continued bullish pressure.
Smart Money Insights
BOS: Clean break above $3320 signals strength.
CHoCH: None yet — trend remains bullish.
Liquidity Sweep: Sell stops below $3295 have already been taken.
Buy-Side Liquidity: Sits above $3350 — price may gravitate there next.
FVG: Unfilled Fair Value Gap between $3314–$3322 — possible retracement zone.
Bullish OB: Identified between $3300–$3310, aligned with FVG and BOS level.
Equilibrium: Using $3275 (swing low) and $3342 (swing high), the midpoint sits near $3308, acting as fair re-entry value.
Key Zones
Buy Zone (Demand): $3295–$3310 — OB + FVG + Fib confluence.
Sell Zone (Supply): $3350–$3360 — next likely liquidity target.
Bias Summary
As long as price remains above $3295, the bullish structure stays valid. Watch for a retracement into $3308–$3316 for potential continuation toward $3350–$3360. Price may briefly dip below $3310 to trigger liquidity before moving higher.
1H View – Precision Entries
Structure
Following the high at $3342, price has pulled back slightly and is forming what appears to be a bullish flag — often a continuation pattern.
Smart Money Zones (1H)
FVG: $3315–$3322 — potential short-term reaction zone.
Order Block: $3305–$3312 — 1H bullish OB aligned with 4H bias.
Sell-side Liquidity: Swept at $3295 earlier this week — supports continuation.
Trade Setups
Long Setup #1 – Optimal Entry
Entry: $3308–$3315
Stop: Below $3295
TP: $3342 (partial), $3350–$3360 (full)
Why: Strong zone combining FVG, OB, and Fib support.
Long Setup #2 – Aggressive Entry
Entry: $3316–$3320
Stop: $3300
TP: $3340–$3350
Why: Quicker entry inside the imbalance — riskier but valid.
Short Setup – Countertrend (Low Conviction)
Only valid on a clear break below $3310 + CHoCH
Entry: Below $3310 (confirmed)
Target: $3295
Note: Lower confidence unless 1H structure turns bearish.
Final Notes
The bias remains bullish above $3301–$3308. This is a high-probability area to look for long setups on retracement. Avoid shorts unless we see a confirmed structural shift with a CHoCH and OB breakdown.
Expect the market to potentially hunt stops below $3310, then aim for liquidity sitting above $3350–$3360.

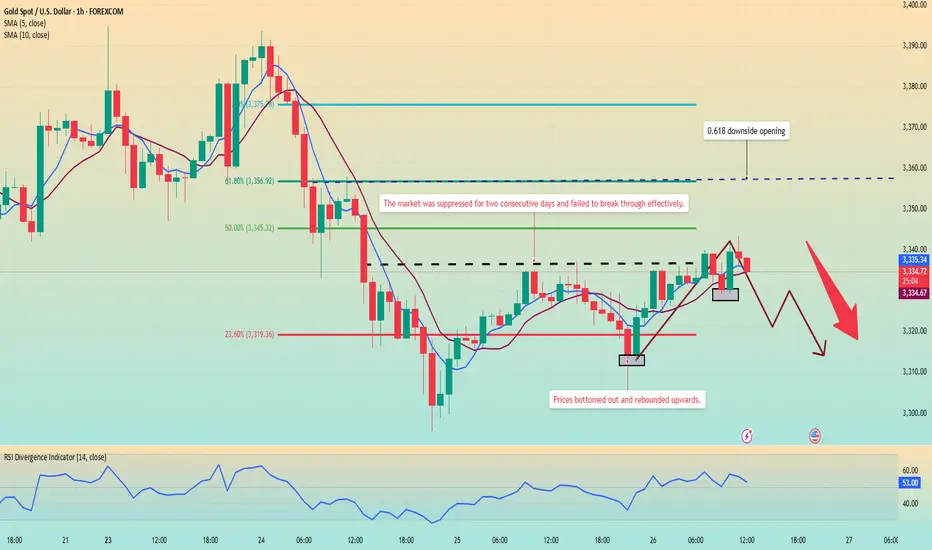
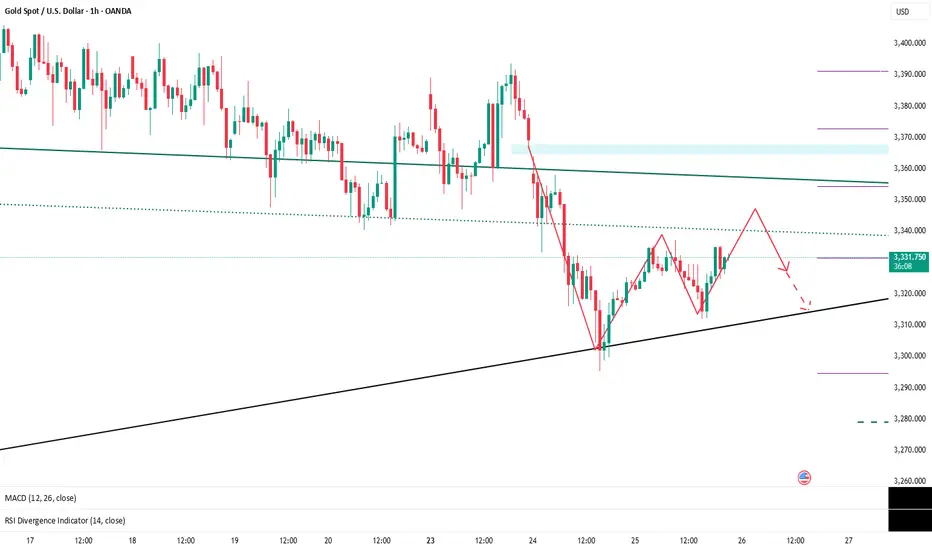
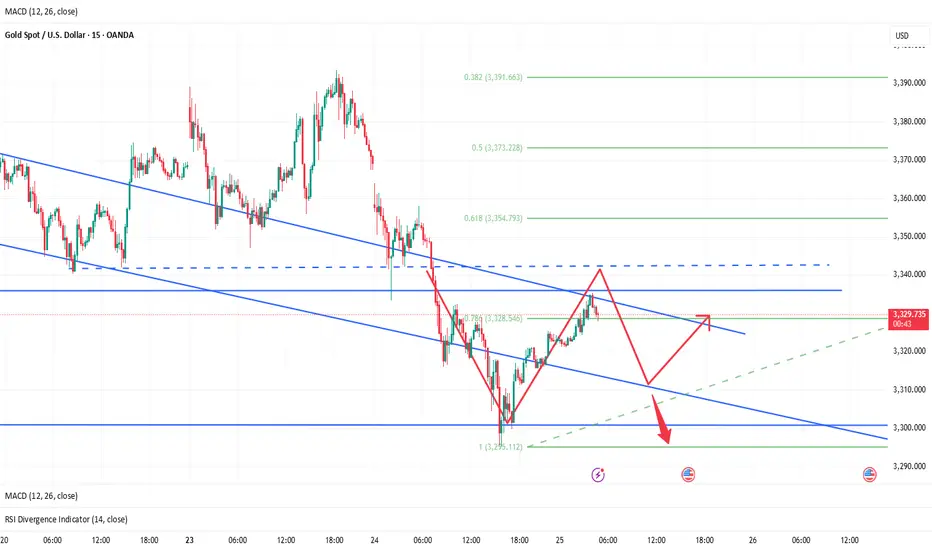
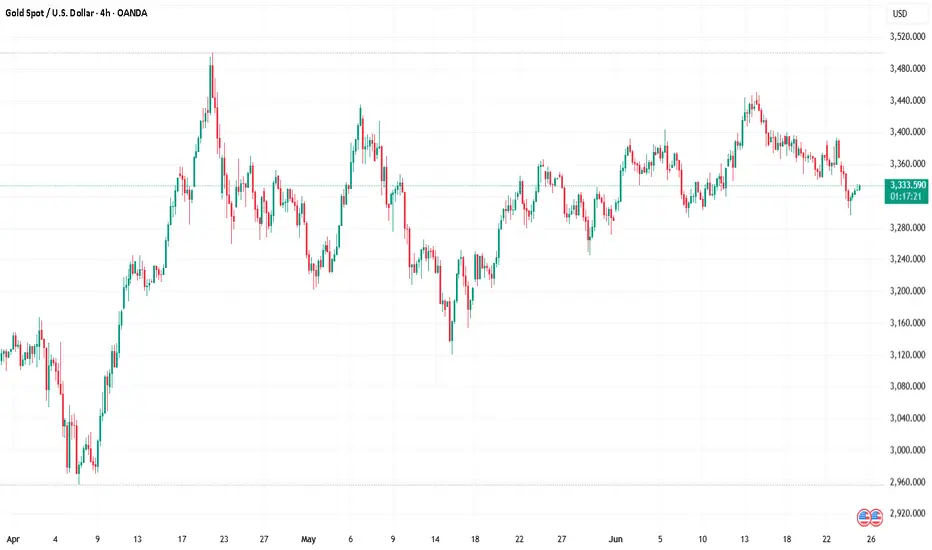
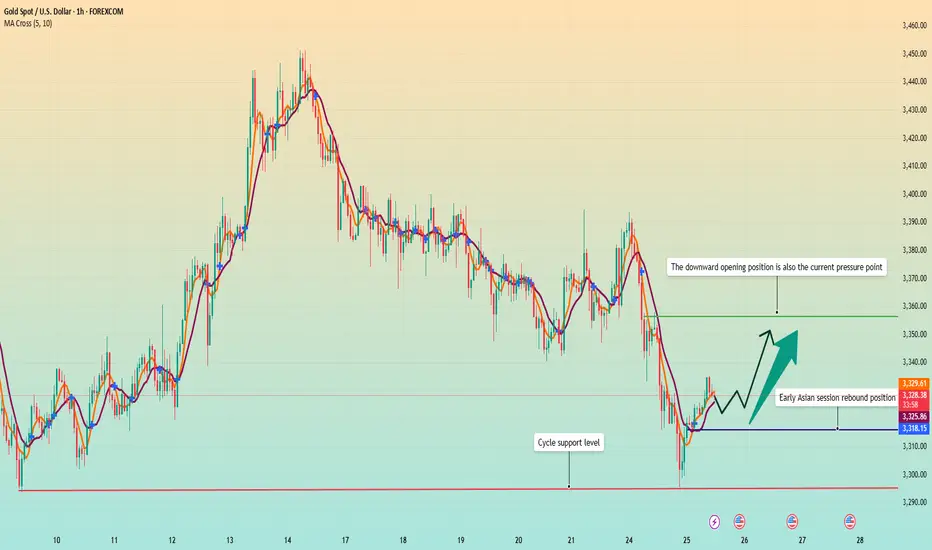
Gold continues to fluctuate. Waiting for a trend?Today, gold has been suppressed below the high of 3345, and the hourly line tends to be weak. Looking at the number of Yin and Yang lines on the hourly line during the fluctuation, we can see that the typical Yin line is continuous and the Yang line is few, plus the weak suppression of the previous day, from the rhythm point of view, it is a weak signal.
From the hourly chart, around 3312, this is the 0.618 position of the retracement of the 3295-3337 fluctuation range. The decline is slow during the day, and the 0.618 position has become a support rebound.
And the current trend, like the previous day, may continue to rebound and then fall. At the same time, there was no cyclical decline in the early Asian session. Instead, it fluctuated sideways, bottomed out and rebounded, and then continued to return to the high of the previous day.
Judging from the current market situation, the Asian market bottomed out and rebounded in the morning, reaching a high of around 3343, and then began to fall back, and is currently fluctuating around 3335.
The trend of the European session is very critical, and the focus is on the watershed below 3328. If this position falls below, the price will most likely continue to fall.
Operation strategy:
Short around 3340, stop loss 3350, profit range 3320-3310.
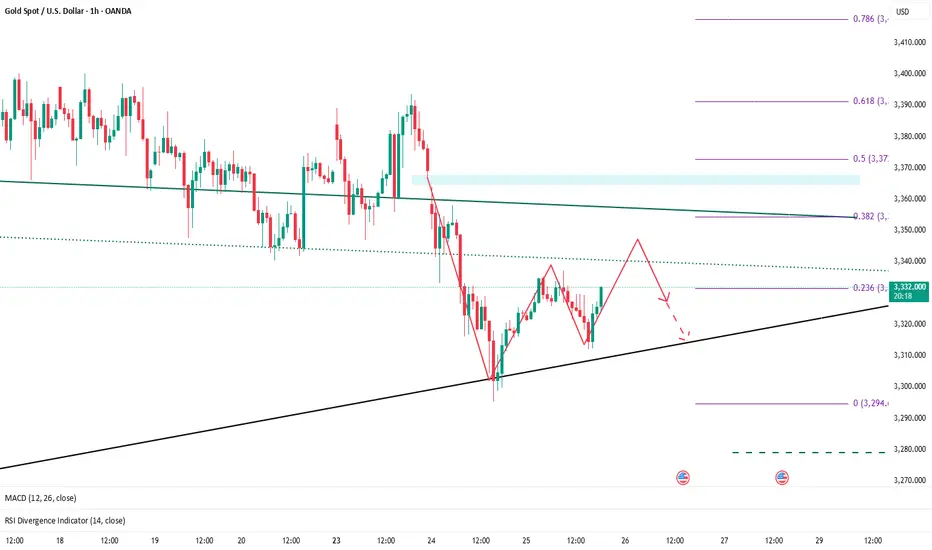
Trading Strategy (XAUUSD) – June 25, 2025 After a sharp decline in the previous session, XAUUSD has shown a mild recovery and is currently trading around 3,332 USD. However, price action suggests this could merely be a pullback within a broader downtrend, as gold has yet to break above the key resistance zone.
Technical Analysis
Price Action
Gold has bounced from the support zone between 3,291 – 3,317 USD, which has historically acted as a strong demand area. This zone also aligns with the Fibonacci 0.382 retracement from the previous bullish leg.
However, XAUUSD remains below the key resistance zone at 3,373 – 3,392 USD, which is a confluence of:
- The Fibonacci 0.618 retracement from the most recent downtrend
- A historical supply zone that has been rejected multiple times
- The upper boundary of the sideways range formed since May
- If price fails to break through this zone in the coming sessions, the risk of continued downside remains high.
RSI Indicator
- The RSI (14) is currently hovering around the neutral zone (49–54), indicating that the rebound lacks the strength needed to confirm a trend reversal.
- The RSI has not crossed above the 55 threshold, suggesting the dominant trend is still bearish.
Key Technical Levels to Watch
Resistance:
- 3,373 – 3,392 USD: Confluent resistance zone (Fibonacci 0.618 + prior supply zone)
- 3,435 – 3,452 USD: Major swing high, a key medium-term reference level
Support:
- 3,291 – 3,317 USD: Immediate support zone, still holding strong
- 3,250 – 3,224 USD: Potential downside target if the bearish momentum resumes
Suggested Trade Setups
Scenario 1 – Buy if price holds above 3,291 and shows confirmation signals
Entry: 3,295 – 3,300 USD
Stop-loss: Below 3,289 USD
Take-profit: 3,340 – 3,355 – 3,370 USD
Conditions: Must show clear bullish reversal patterns (Pin Bar, Bullish Engulfing) on H1 or H4 timeframe
Scenario 2 – Sell if price rejects from resistance zone with confirmation candle
Entry: 3,370 – 3,375 USD
Stop-loss: Above 3,392 USD
Take-profit: 3,330 – 3,310 – 3,290 USD
Conditions: Clear bearish rejection candle + declining volume
Note: XAUUSD is currently in a technical rebound phase after a strong drop but lacks solid reversal confirmation. Traders should closely monitor the price reaction near the 3,373 – 3,392 USD resistance zone over the next sessions. This area will determine whether the downtrend will resume or a reversal begins.
Stay tuned for more daily trading strategies, and make sure to save this analysis if you find it helpful for your trading plan.
Strategy analysis by @Henrybillion
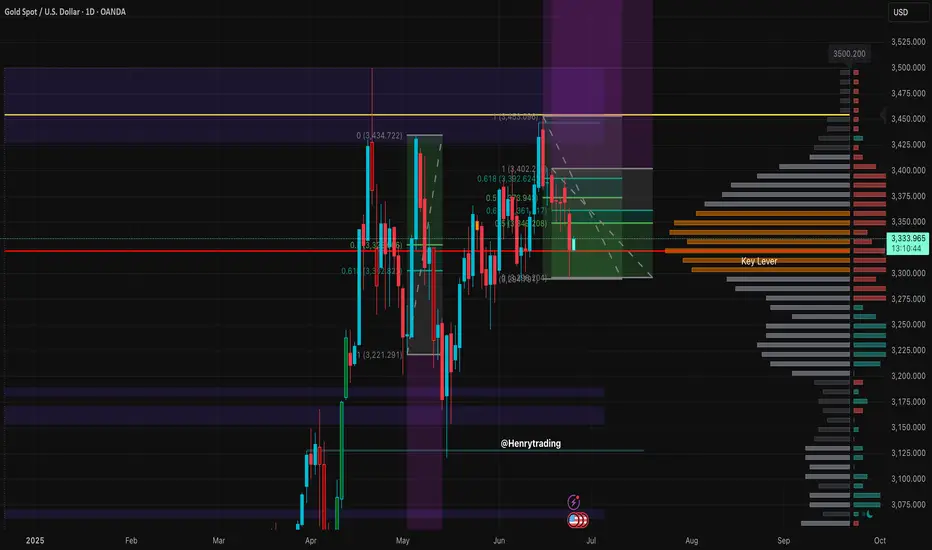
XAUUSD Technical Outlook – Rebound or Trap?1. Market Overview
After a sharp rejection near the 0.618 Fibonacci level, XAUUSD has pulled back and is now trading around 3,323 USD. Although price has stabilized somewhat, technical indicators suggest this is likely a corrective move within a prevailing downtrend.
2. Technical Analysis
Price Action
XAUUSD is currently hovering near 3,323 USD after a failed attempt to break above the resistance zone at 3,373–3,392 USD — an area marked by:
The 0.618 Fibonacci retracement from the recent downtrend
Repeated historical rejections.
The upper boundary of a sideways consolidation range from early June.
Recent candlesticks show indecision and rejection from higher levels, suggesting sellers are still in control.
Support Zone Behavior
The price recently bounced from the 3,294–3,317 USD range, where strong historical support and the 0.382 Fibonacci level align.
This zone continues to hold, but if broken, could open the door to deeper declines toward the 3,250 or even 3,224 USD levels.
RSI Indicator
RSI remains flat around the neutral zone, indicating a lack of bullish momentum.
No significant divergence or breakout signals are currently visible on the daily RSI chart.
3. Key Technical Levels
Resistance:
3,373 – 3,392 USD: Confluence resistance zone (0.618 Fib + historical supply).
3,435 – 3,453 USD: Previous swing high – key medium-term benchmark
Support:
3,294 – 3,317 USD: Immediate support, holding for now.
3,250 – 3,224 USD: Potential next target zone if bearish pressure resumes.
4. Trade Setup Scenarios.
Scenario 1 – Buy if support holds and bullish confirmation appears
Entry: 3,295 – 3,305 USD.
Stop-loss: Below 3,289 USD.
Take-profit: 3,340 – 3,355 – 3,370 USD.
Condition: Look for bullish reversal patterns (e.g., Bullish Engulfing, Pin Bar) on H1–H4.
Scenario 2 – Sell on rejection from resistance zone
Entry: 3,370 – 3,375 USD.
Stop-loss: Above 3,392 USD.
Take-profit: 3,330 – 3,310 – 3,290 USD.
Condition: Clear bearish rejection candlestick with diminishing volume
Note:
XAUUSD remains in a vulnerable state. The current move may be a technical rebound rather than a true reversal. Traders should watch closely how price behaves around the 3,373–3,392 USD zone in the coming sessions. A breakout could signal a new bullish leg, while another rejection would likely confirm a continuation of the bearish trend.
Gold may continue to rebound to 3350-3360If gold can stand above 3330 today, it will stimulate long trading behavior to a certain extent, especially the self-rescue behavior of trapped longs. Gold may continue to rebound and is expected to reach the 3345-3355 area. So there is no need to risk shorting gold near 3330 for the time being; although gold may continue to rebound, it is still under pressure in the 3350-3360-3370 area; and gold is still weak overall, so we can consider shorting gold in the 3350-3360 area and look at the target area of 3325-3315.
The Premium privilege of my account will end on June 26, and it will stop updating here from tomorrow. Friends in the channel have already made a lot of money by following my trading strategy. Friends who have not joined yet can join and receive the latest trading strategies and trading signals as soon as possible to escort your trading!
BTC continues to short at high levels during the day📰 Impact of news:
1. Geopolitical impact
📈 Market analysis:
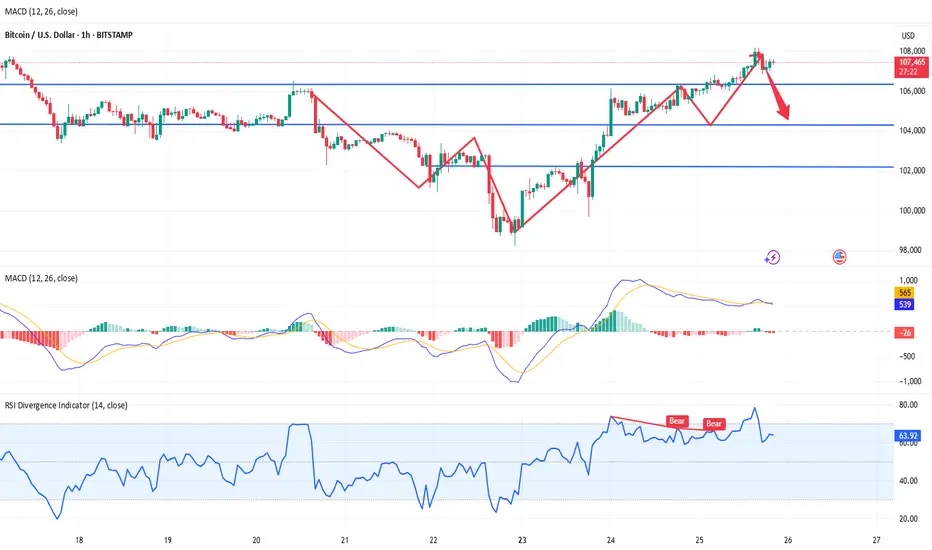
BTC has reached an intraday high of 108,125, just one step away from the all-time high of 112,000. With the increase in trading volume and institutional sentiment turning bullish, the momentum seems to be in the bulls' favor. In addition to institutional buying, the ceasefire agreement in the Iran-Israel war is also an important factor in Bitcoin's sharp rebound. Trump's announcement of the end of the war almost immediately triggered a surge in the cryptocurrency market. However, the overall pattern has not changed, and the range resistance has not been broken, so we still keep the idea of shorting at high levels.
🏅 Trading strategies:
SELL 108000-107500
TP 104500-103500
If you agree with this view, or have a better idea, please leave a message in the comment area. I look forward to hearing different voices.
Short gold after reboundGold rebounded after touching 3312, and has now rebounded to 3330, but the rebound strength is far less than the decline strength, so the overall performance of gold is still weak. Because gold fell sharply yesterday, the market bullish confidence suffered a heavy blow, and there are many resistances above after gold fell and broke, and it is under pressure at 3340-3350 in the short term, and there is a technical gap above that suppresses the 3360-3370 area.
Therefore, before gold stabilizes in the 3360-3370 area, the short-selling force still has the upper hand, so we still focus on shorting gold in trading. We can consider shorting gold with the 3340-3350 area as resistance, and look at the target area of 3320-3310.
The Premium privilege of my account will end on June 26, and it will stop updating here from tomorrow. Friends in the channel have already made a lot of money by following my trading strategies. Friends who have not joined yet can join and receive the latest trading strategies and trading signals in the first time to protect your trading!
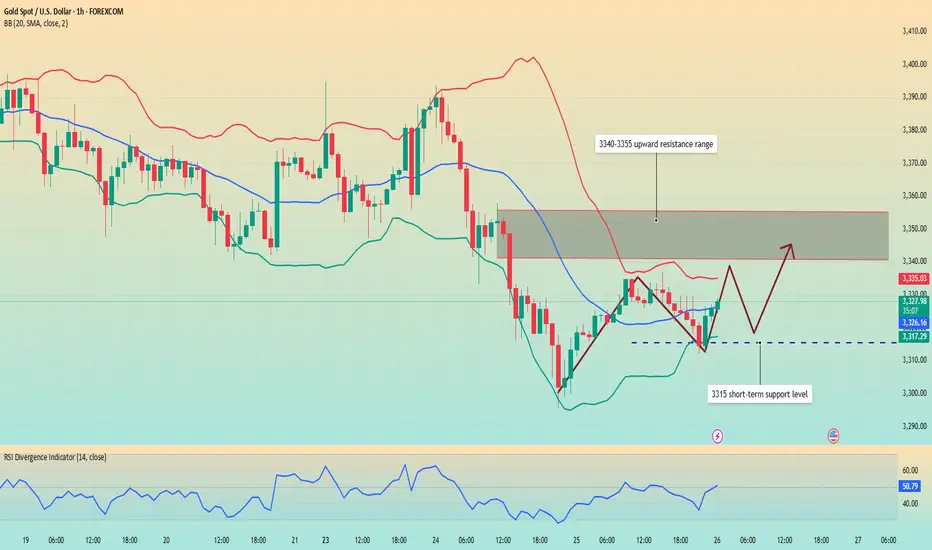
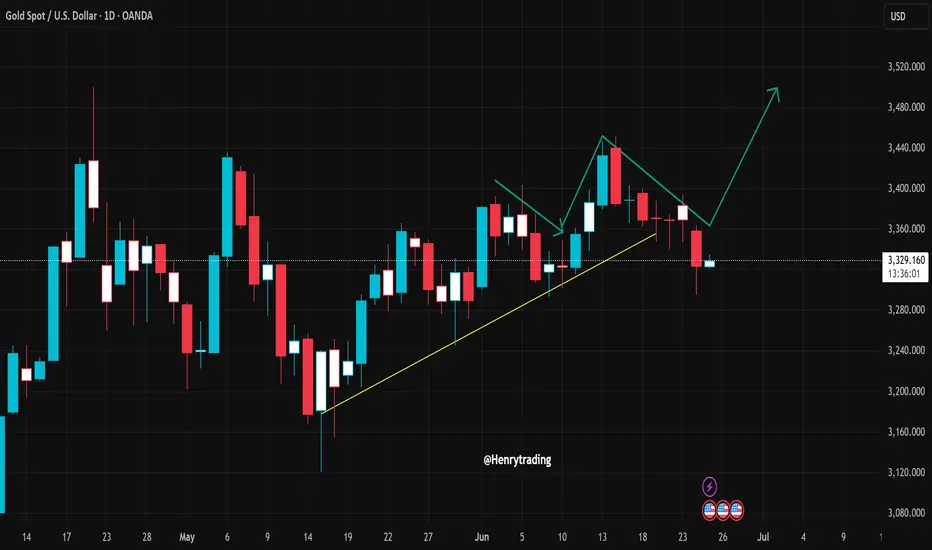
Gold fluctuates upward. Trend change?Yesterday, the gold daily line closed with a middle-yin candlestick with a lower shadow. The closing price has lost the middle and lower rail positions one after another, and the short-term downward pressure adjustment will continue.
The hourly level shows a bottoming out and rebound, and it rose in the early Asian session, breaking through the pressure resistance of 3328-3332 in the European and US sessions yesterday, but it did not continue the rebound and fell into a narrow range. At present, there is still great resistance above 3340, and it has failed to break through after many attempts, but the hourly line track has not been completely lost.
Pay attention to the 3315 support for long positions, and pay attention to the 3340-3355 short position range for upward movement. For the period of shock, strong support or resistance will inevitably produce inertial puncture behavior, and some errors are normal. We need to pay attention to the market trend at all times and change strategies in time.
Today we need to focus on the response strategies for resistance and support levels, which will determine whether we can achieve profits within the fluctuation range.
Good luck to everyone.
Suppression remains unchanged, the latest layout of gold📰 Impact of news:
1. Powell's testimony
2. Geopolitical impact
📈 Market analysis:
The short-term rebound of gold is the release of energy for the accumulated bulls. From the current market trend, 3340 above is the key point of the short-term watershed between bulls and bears. The short-term resistance above is around 3342-3348, and the short-term support below is around 33220-3315. If it falls below this, it will continue to look towards yesterday's low of 3290-3280. The daily level is under pressure and continues to see a decline and adjustment. If it touches 3340-3350 above, you can try to short. After it retreats to 3320-3315 and obtains effective support, you can consider going long.
🏅 Trading strategies:
SELL 3340-3350
TP 3330-3320-3315
BUY 3320-3315
TP 3330-3340-3350
If you agree with this view, or have a better idea, please leave a message in the comment area. I look forward to hearing different voices.
OANDA:XAUUSD FX:XAUUSD FOREXCOM:XAUUSD FXOPEN:XAUUSD TVC:GOLD
Bulls have made profits, gold layout in the evening📰 Impact of news:
1. Powell's testimony
2. Geopolitical impact
📈 Market analysis:
I have completed the long trade according to the previous trading strategy, and the long order has generated profit. In the short term, the overall trend of gold is still bearish. Only if it breaks through and stabilizes above 3350 can the bulls continue. If it rebounds to the 3330-3335 line and encounters resistance under pressure, you can consider shorting. If it rebounds to 3340-3350 but fails to stabilize, you can increase your short position. Pay attention to the support of 3320-3300 below. If it falls below 3300, it is expected to reach 3280
🏅 Trading strategies:
SELL 3330-3335-3340-3350
TP 3320-3310-3300-3280
If you agree with this view, or have a better idea, please leave a message in the comment area. I look forward to hearing different voices.
OANDA:XAUUSD FX:XAUUSD FOREXCOM:XAUUSD FXOPEN:XAUUSD TVC:GOLD
Start going long on goldAlthough gold is under pressure and weak at present, gold still rebounded near 3295 under the influence of yesterday's major negative news, proving that there is still a large amount of buying funds below, limiting the retracement space of gold; and from 3295 to 3335, there is still a rebound space of $40, proving that gold is not extremely weak. Moreover, there is a gap left above, and there is a technical need to rebound to fill the gap;
In addition, yesterday gold fell sharply due to news, and there should be many longs trapped in the market. If gold is relatively stable, there may be self-rescue behavior of the trapped longs, so gold longs still have the opportunity to rebound to 3340-3350. At present, the main focus is on the short-term support area of 3315-3305, and we can moderately consider going long on gold in this area.
Gold fluctuates, 3300 may fall below.Gold fell to 3333 on Tuesday and then rose to around 3358, then began to fall slowly due to resistance, continued to fall in the European session, and fell to around 3295 in the US session, and rebounded in the late trading, rebounding to around 3325, and the daily line closed with a negative line with a lower shadow.
In addition, Israel and Iran both accused each other of violating the agreement, which brought uncertainty to the gold market.
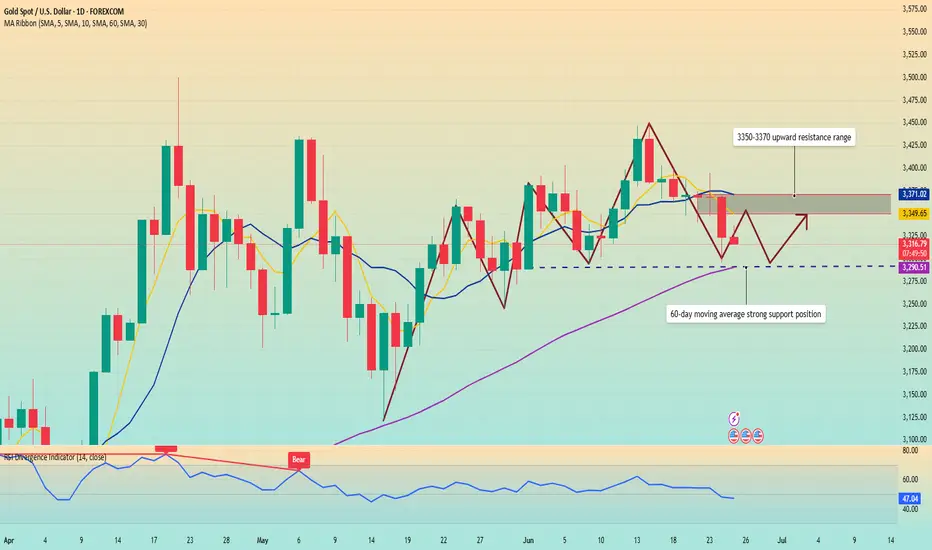
After the sharp drop in gold last week, except for the correction of the cross positive line on Tuesday last week, the daily level has closed five consecutive negative lines since last Wednesday until now, fully demonstrating that the gold price has shown a weak feature of fluctuating downward in recent transactions.
From the technical indicators, the 5-day moving average and the 10-day moving average cross downward, which indicates an important signal that the market trend is weakening in the short term. The current gold price continues to run below the moving average, further verifying the current market situation where shorts dominate.
In terms of resistance, the 5-day moving average is currently around 3350, and the 10-day moving average is around 3370. These two price levels constitute the key resistance range in the upward process of gold prices. As long as the gold price fails to effectively break through this resistance band, it is likely to continue to be weak in the short term. At the support level, pay attention to the 60-day moving average around 3290.
Operation strategy:
Short gold rebounds around 3350, stop loss 3360, profit range 3320-3310.
Go long gold falls back to around 3295, stop loss 3285, profit range 3330-3340.
The market conditions are often not what we ideally want. This is the market, and it is also a form of trading practice.
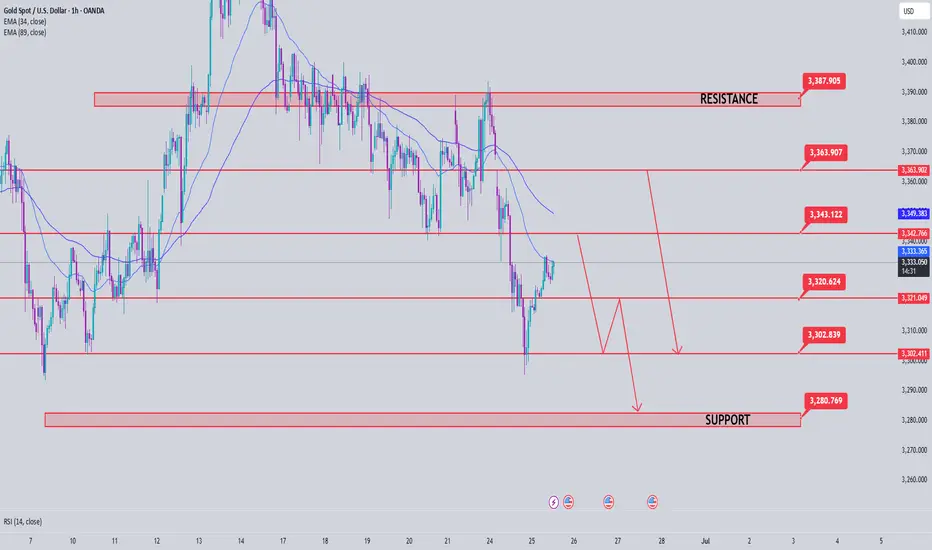
Gold Price Analysis June 25The Daily Candle shows a strong selling force breaking out of the 3-day accumulation zone. Gold hits the support zone of 3296 and bounces towards the resistance zone of 3342. Today, there is unlikely to be a rebound, there is a possibility of an increase in the Asian session and the European session, and the US session will return to the Selling force.
The recovery from 3296 towards 3342, some selling force may appear around 3342, forming a strong bearish structure. The Bearish Wave Structure will weaken if it breaks 3342. The 3363 area is still noteworthy for SELL signals.
The market closed above 3363, confirming the break of the downtrend and heading towards the resistance zone of 3388. The bottom support of 3302 will help prevent a temporary decline before heading towards the target of 3278.
XAU/USD Bullish Reversal from Key SupportXAU/USD Bullish Reversal from Key Support 📈🟢
📊 Chart Analysis:
Rounded Bottom Structure ⬆️
The price has formed a rounded bottom pattern, indicating potential trend reversal from bearish to bullish.
Multiple bounces (🟠 circles) from the curved support trendline confirm the validity of this structure.
Support Zone Rejection ✅
Price recently rejected from a major horizontal support zone (around 3,303.796 USD) with a strong bullish wick.
This zone has acted as a springboard for prior upward moves.
Falling Wedge Breakout 💥
A falling wedge (bullish pattern) has formed and is breaking to the upside.
Breakout confirmation is underway, indicating momentum shift.
Target Projection 🎯
The projected move from the breakout suggests a potential target at 3,385.820 USD.
This aligns with previous resistance areas.
Key Levels to Watch:
Resistance: 3,385.820 USD (target) and 3,425–3,450 USD (major resistance zone)
Support: 3,303.796 USD (short-term), followed by 3,225–3,250 USD zone
🔔 Conclusion:
Price action suggests a bullish bias with a possible upward continuation if it sustains above the wedge breakout.
Confirmation above 3,330 USD with volume can fuel a rally toward the 3,385–3,400 USD target zone.
📌 Risk Management Tip: Watch for fakeouts near wedge resistance or a re-test of 3,303 USD for better entries.

GOLD H2 Intraday Chart Update For 25 June 25 Hello Traders, as you can see that market just try to broke 3300 psychological level yesterday but unfortunately that was not successful attempt
All eyes on 3337-3348 zone for the day if market successfully breaks that zone it will move towards 3365 Blind Structure Level else we might see 3305 level test soon on Intraday basis
Reminder: This is also FED Chair Powell 2nd of Testifies
Disclaimer: Forex is Risky
XAUUSDHello traders.
I’ve spotted an exceptional sell opportunity on the XAUUSD pair—one of those setups that come around once in a hundred years! The trade offers a Risk-to-Reward ratio of over 1:8, so I thought it would be valuable to share it with you.
Please adjust your risk parameters accordingly before entering the trade.
🔍 Trade Details
✔️ Timeframe: H1
✔️ Risk-to-Reward Ratio: 1:8.70
✔️ Trade Direction: Sell
✔️ Entry Price: 3333.35
✔️ Take Profit: 3317.75
✔️ Stop Loss: 3335.13
🕒 If momentum fades or the price consolidates in a tight range, I will keep this trade open only until 23:00 (UTC+4). After that, I’ll close it manually—whether in profit or loss—depending on how price action evolves.
🔔 Disclaimer: This is not financial advice. I’m simply sharing a trade I’ve taken based on my personal trading system, strictly for educational and illustrative purposes.
📌 Interested in a systematic, data-driven trading approach?
💡 Follow the page and turn on notifications to stay updated on future trade setups and advanced market insights.
4‑Hour Analysis – Supply & Demand Overview 25 June 20251. Market Structure
XAU/USD currently trades at 3333 and shows clear higher highs and higher lows on the 4‑hour timeframe—reflecting a bullish structure backed by recent swing lows above 3300 and highs nearing 3365
2. Key Demand Zones
DZ1: 3320–3330 – Consolidation region with multiple wicks and price rejections; confirmed buying volume (aligned with ML and 50‑EMA confluence)
DZ2: 3300–3310 – A deeper base with strong reversal history; aligns with psychological round number and 0.382 Fib of recent up-swing
3. Key Supply Zones
SZ1: 3350–3360 – Upper resistance cluster formed by repeated spikes and quick rejections; overlapping 0.5–0.618 Fib from the last retracement
SZ2: 3380–3400 – Broader distribution area with past failed breakouts; significant liquidity shelf noted
4. Why These Zones Matter
Demand zones act as value entry areas where institutional and retail buyers absorb selling pressure, usually followed by swift reversals.
Supply zones represent distribution pockets where buy orders face strong pushback, often leading to corrective moves.
5. Bias
✅ Overall Bias – Bullish (4‑hour) thanks to structural trend (HH/HL), price above key previews like 50‑EMA & 20‑EMA, and consistent demand responses. Only a break below 3320 invalidates bullish tilt.
⚡ 1‑Hour Intraday Setups (Aligned with Bullish 4H Bias)
Buy the Dip (Main Entry)
Zone: 3320–3325
Context: Retest of DZ1, tagging the 4H structure and 1H ascending trendline.
Confirmation: Bullish pin bar or long tail candle + volume surge.
Channel Retest Quick‑Entry
Zone: 3330–3335
Context: Price remediates after a clean breakout above the 1‑hour descending channel.
Confirmation: Trendline bounce or bullish engulfing on the first test.
Supply‑Fade (Aggressive)
Zone: 3350–3355
Context: Approach to SZ1—plays the bearish reaction in a bull market context.
Confirmation: Bearish pin bar, upper wick exhaustion, and slim 1H RSI divergence.
📈 Chart Snapshot & Confluences
DZ1 (3320–3330) aligns with the 0.382 Fib and ascending 1‑hour trendline.
Quick-entry zone (3330–3335) sits close to the 1‑hour 50‑EMA, offering dynamic multi‑timeframe confluence.
SZ1 aligns with higher-term fib and previous supply peaks.
📝 Ready Summary
XAU/USD – 4H Structure: Bullish – higher highs & higher lows.
Major Demand Zones: 3320–3330 (primary), 3300–3310 (secondary).
Major Supply Zones: 3350–3360 (hot zone), 3380–3400 (upper resistance).
Bias: Bullish as long as price holds above 3320.
Intraday Trade Zones:
Buy the Dip: 3320–3325 – look for pin‑bar/volume bounce.
Quick Re‑Entry: 3330–3335 – trendline or 50‑EMA test confirmation.
Supply Fade (Aggressive): 3350–3355 – bearish rejection setup.
Pro Tip: Focus on clean price action signals (wicks, engulfings, volume) within entry zones and confirm with multi‑timeframe confluences (Fib, EMA, trendlines).
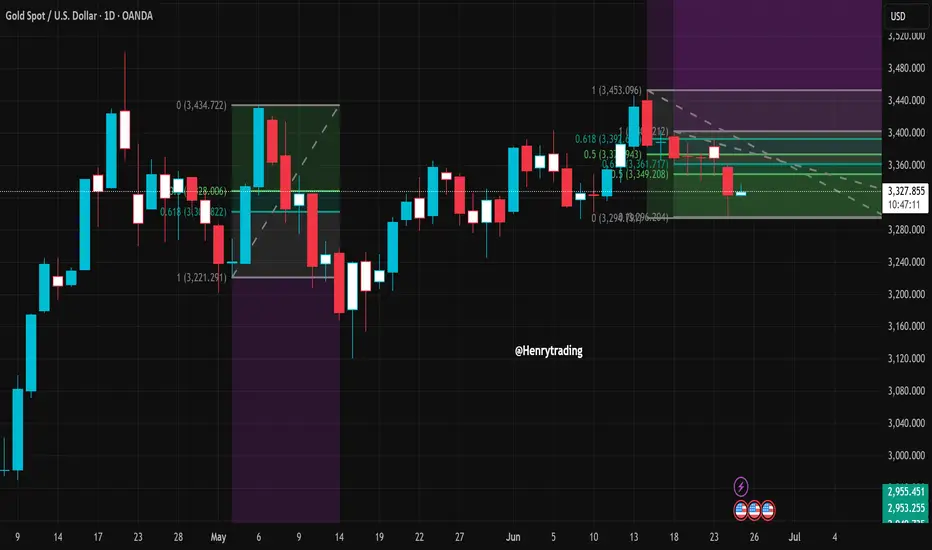
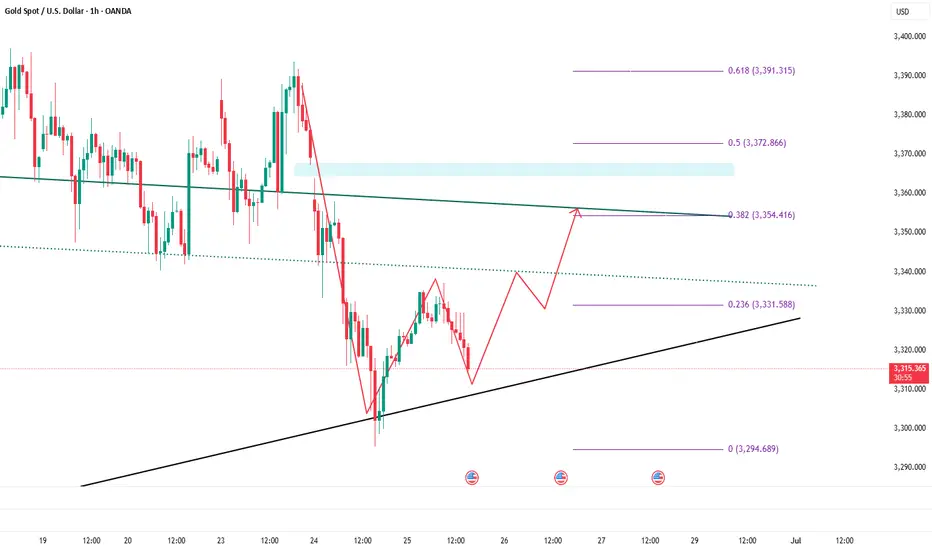
XAUUSD poised for a rebound?Gold (XAUUSD) is currently trading around the 3,327 level after breaking below a short-term ascending trendline that started in mid-May. While this break might suggest a potential bearish reversal, from a technical standpoint, it could simply be a corrective move within a larger bullish structure.
The current price pattern appears to be forming a classic ABC correction.
If the support zone around 3,320–3,325 holds, there’s a strong possibility that price will rebound toward the 3,400–3,480 region in the coming sessions.
This area is not only a technical support but also a previous demand zone where buyers stepped in aggressively. Close attention should be paid to any bullish price action signals here. A reversal candlestick or a volume spike could serve as confirmation for a rebound setup.
A potential trade idea is to consider a long position around 3,320–3,325, with a stop loss below 3,308.
First target is set at 3,400, and an extended target at 3,480 if bullish momentum continues. Conversely, if the price closes below 3,308 with strong volume, the bearish scenario will gain ground, potentially dragging price down to the 3,280–3,231 support area.
The setup remains open, and clear confirmation is needed. Patience is key—wait for solid signals before committing to a position.
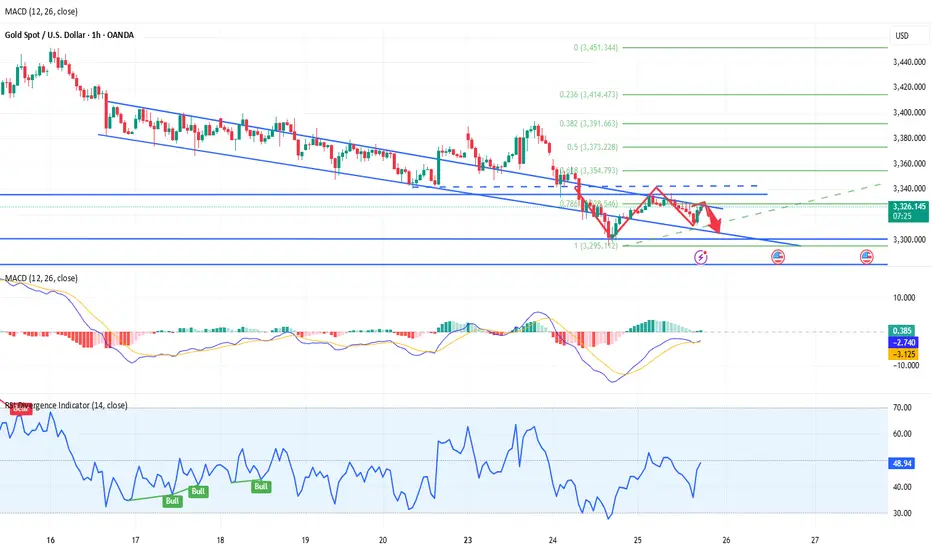
Gold is under pressure. Will the trend change?Information summary:
The easing of tensions in the Middle East is the main reason for the suppression of gold. Risk aversion has weakened, and the market has entered a risk-taking mode. Gold prices are well supported near $3,300.
Powell released an important signal: The market expected Powell to strongly refute the possibility of a rate cut, but he remained on the sidelines. The market still generally believes that the July 29-30 meeting is unlikely to initiate a rate cut, and the first rate cut is expected to be in September.
Market analysis:
Gold has fallen for seven consecutive weeks, which has changed the current bull structure in stages, so there is no doubt that gold is expected to fall back as a whole. The early decline was near 3355, which is the current long-short watershed of gold. As long as the adjustment does not break through the 3355 position, the overall short-term adjustment pattern of gold will not change.
The early Asian market did not continue to retreat, but the short-term rebound had a long buying force accumulation, but as long as it did not break through 3355, the market trend was still weak, and it was adjusted by low-level shock correction. Today, there is a high probability of movement around the falling range. The short-term support below is around 3290. If this position is lost, it may touch the turning point around 3275.
Operation strategy:
Go long when the price falls back to around 3315, stop loss at 3305, and profit range 3345-3350.
The rebound is an opportunity to short goldAfter the ceasefire agreement between Iran and Israel and Powell's hawkish remarks that strongly refuted the possibility of a rate cut, gold fell sharply and hit a low near 3295. Although gold has rebounded, it is particularly difficult during the rebound process, which shows that the bulls are not willing to attack, and the rebound is only a technical repair of the decline.
Since gold fell below 3300 yesterday, the current bull structure has been changed in stages and the confidence of the bulls has been greatly weakened. As gold falls, it will be under pressure in the 3345-3355 area in the short term. Before gold breaks through this area, any rebound may give us an opportunity to short gold; in addition, after gold falls below 3300 once, in order to move downward and test support, gold has the need to retreat again.
So in the next short-term trading, we can try to use the 3345-3355 area as resistance, short gold appropriately, and look to the 3315-3305 area.

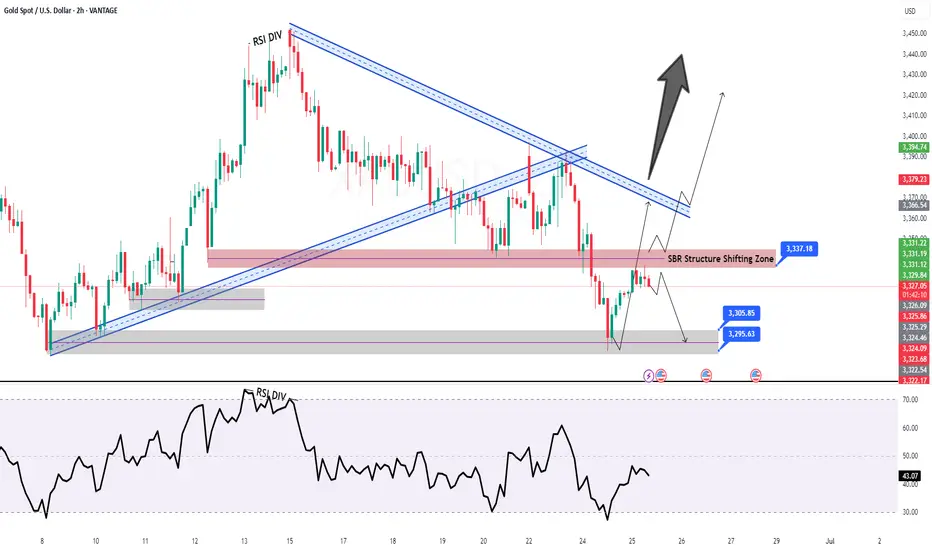
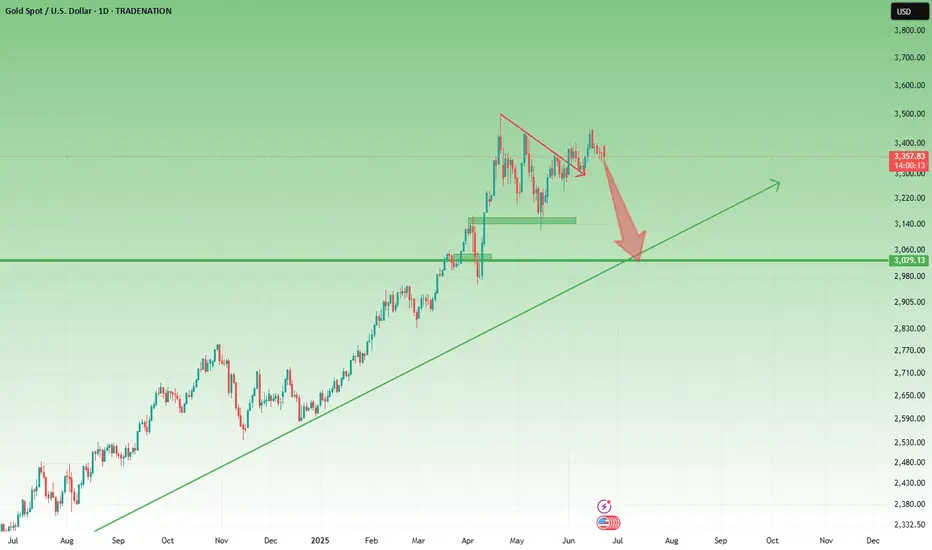
Geopolitical Spike Fades Fast – Gold Eyes 3300As highlighted in Friday’s analysis, the daily and short-term charts remain messy, but the weekly chart is leaning clearly bearish – with a potential Dark Cloud Cover candlestick formation now confirmed.
🌍 Geopolitical Gap Up... and Quick Rejection
Monday’s Asian open brought a gap up, triggered by renewed tensions in the Middle East. But price failed to break above 3400 and quickly reversed – a textbook sign of weakness, not strength.
🧭 Technical View:
- The weekly candle closed as a Dark Cloud Cover, a strong bearish reversal signal
- The lack of follow-through after the gap up further confirms sellers are still in control
- Price remains below the key 3400 level, showing no bullish momentum behind recent spikes
📌 Trading Plan:
I continue to sell rallies, with an initial target near 3300. If bearish momentum builds, lower levels are in play.
Let the chart lead – don’t get distracted by the noise.
Disclosure: I am part of TradeNation's Influencer program and receive a monthly fee for using their TradingView charts in my analyses and educational articles.
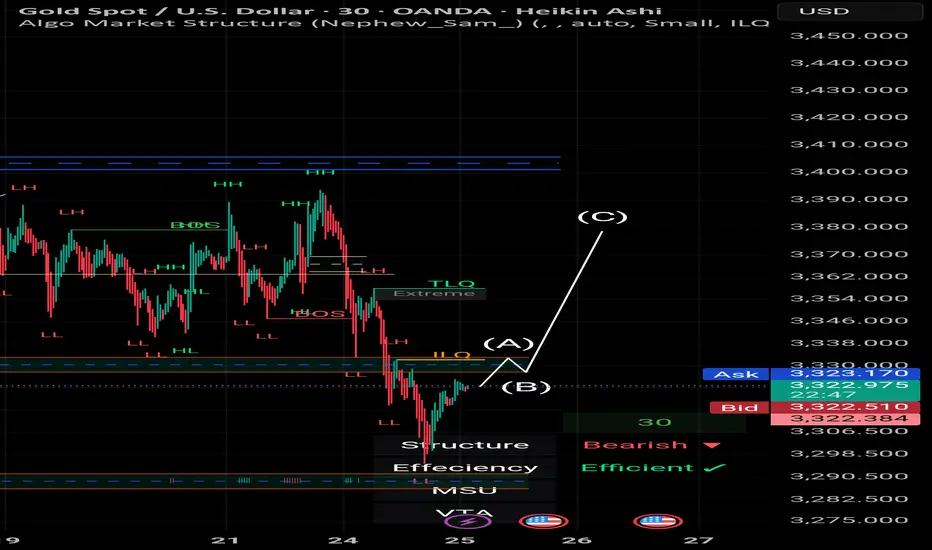
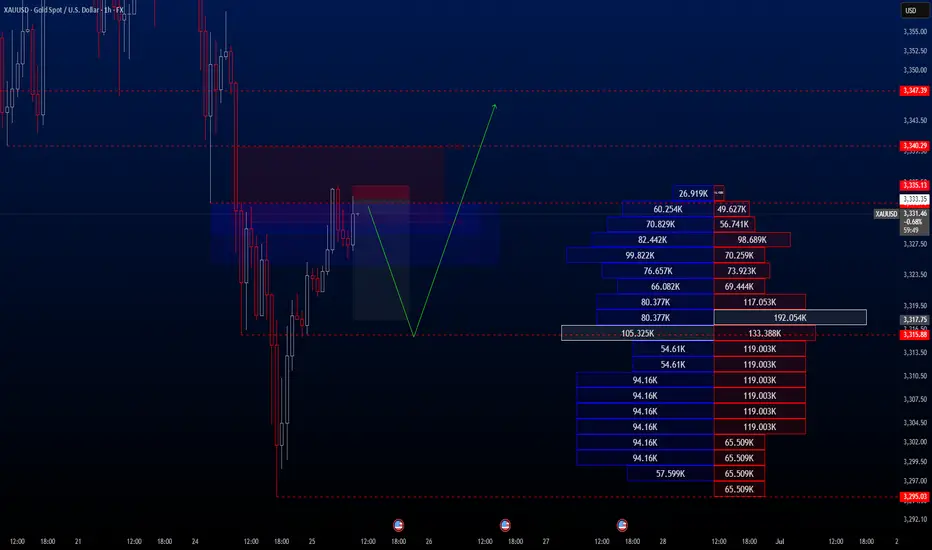
XAU/USD – 5-Minute Scalping Outlook🟢 XAU/USD – 5-Minute Scalping Outlook
🕐 Gold Spot / U.S. Dollar – Heikin Ashi
The market structure on the 5-minute chart confirms a bullish bias, supported by multiple structural shifts and a recent Break of Structure (BOS) following a valid trading range.
🔍 Key Highlights:
After a clear BOS and bullish consolidation, price tapped into the TLQ (True Liquidity Zone) and reacted strongly from the Extreme Zone just above $3,316.
The EPA (Entry Point Area) held effectively as a short-term support, fueling a sharp breakout move.
The current price has surged past $3,322, pushing into an area of minor resistance near $3,332 – $3,336.
The recent price action shows the market is inefficient, which often leads to rebalancing — watch for a potential retrace toward EPA or TLQ before continuation.
📈 Scalping Strategy Note:
Traders could look for short-term retracement entries between $3,318 – $3,320, targeting the upper resistance zone while managing risk below $3,316.
📊
Structure: Bullish ✅
Efficiency: Inefficient ❌ (expect potential re-tests)
Momentum: Accelerating
Trend Bias: Intraday Bullish
---
💬 Scalpers should remain cautious around high volatility zones and news-driven sessions.
This chart reflects an excellent model for liquidity-based entries in a trending environment.
📌 Analysis by: Mohsen Mozafari Nejad