Gold is moving upward. Testing the ultimate pressure.Gold opened high at around 3397 and then quickly retreated. After hitting the lowest point of around 3346 in the European session, it continued to rebound. It fluctuated in a large range around 3360-80 many times, which also added a lot of confusion to the market.
After retreating to around 3355 again, it continued to move upward, reaching a high of around 3389. At present, the market still has upward momentum, and the key pressure above is maintained at 3400, which is also the previous high point and the last line of defense for the bears. If this position continues to be broken, the bulls may continue to move upward without resistance in the later period, with the target price around 3430-3450. The key support below is still maintained in the range of 3355-3340.
Judging from the current market, the short-term fluctuations may continue to expand, and the ultimate target above is maintained at around 3400. This position is likely to be broken, but the probability of continuing to rise is small. The current bulls may still be in a form of enticing more.
Operation strategy:
Short near 3395, stop loss 3410, profit near 3375.
If it continues to break below 3370, it will be seen around 3340. If it breaks through the extreme pressure level of 3400, we need to consider stopping the loss in time. .
Xauusdsignal
Gold price PMI positive, slight increase⭐️GOLDEN INFORMATION:
Gold prices (XAU/USD) edge higher toward $3,375 in early Asian trading on Monday, driven by heightened geopolitical tensions following US President Donald Trump’s decision to intervene militarily in the Israel-Iran conflict. The move significantly escalates the situation in the Middle East, fueling demand for safe-haven assets like gold.
The US launched airstrikes on three Iranian nuclear facilities early Sunday, marking a direct entry into the conflict despite Trump’s prior pledges to avoid new overseas wars. The intensifying turmoil has sparked a wave of risk aversion, supporting bullion prices amid rising uncertainty. Meanwhile, investors will closely monitor the preliminary S&P Global US Purchasing Managers’ Index (PMI) for June, due later in the day, for further market direction.
⭐️Personal comments NOVA:
Gold prices continue to be supported around the 3340 mark, positive with today's US PMI news data
⭐️SET UP GOLD PRICE:
🔥SELL GOLD zone: 3380- 3382 SL 3387
TP1: $3370
TP2: $3360
TP3: $3350
🔥BUY GOLD zone: $3318-$3316 SL $3311
TP1: $3326
TP2: $3338
TP3: $3349
⭐️Technical analysis:
Based on technical indicators EMA 34, EMA89 and support resistance areas to set up a reasonable BUY order.
⭐️NOTE:
Note: Nova wishes traders to manage their capital well
- take the number of lots that match your capital
- Takeprofit equal to 4-6% of capital account
- Stoplose equal to 2-3% of capital account

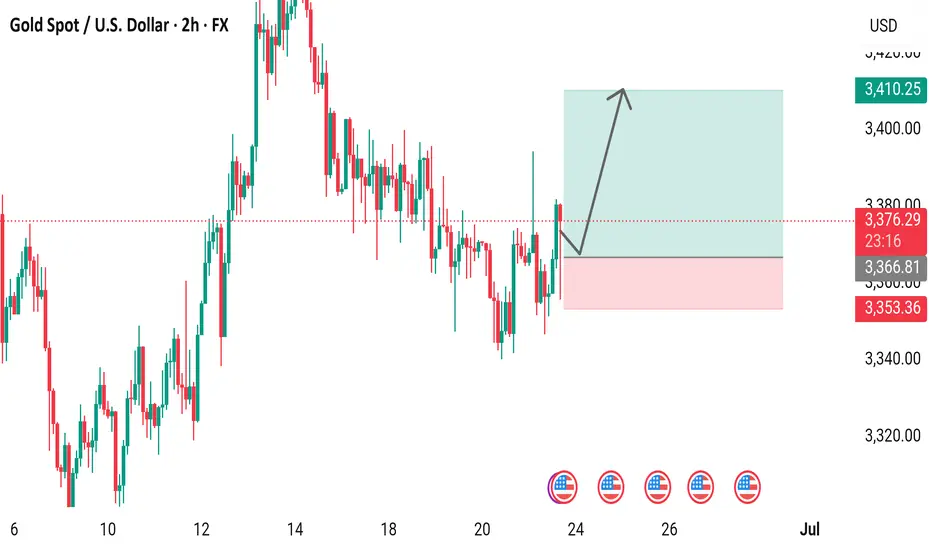
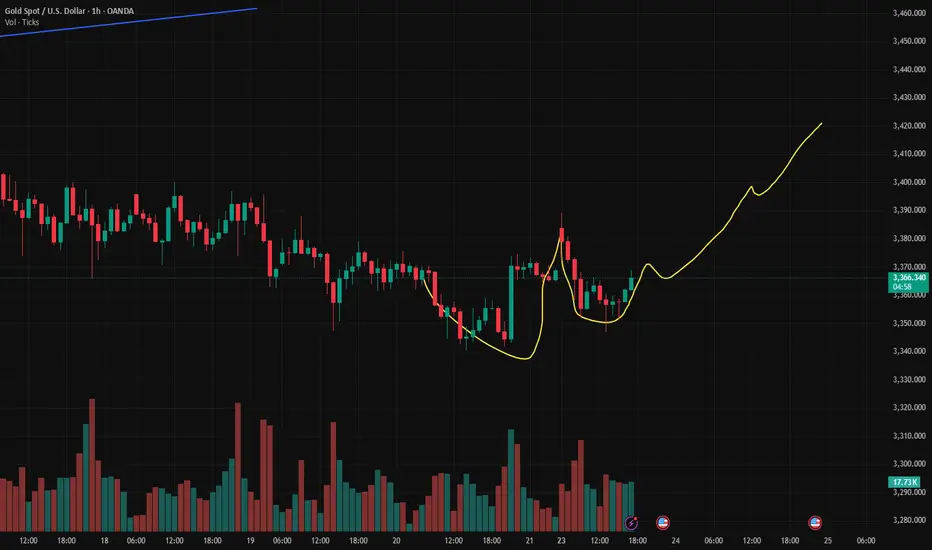
Gold Spot / U.S. Dollar (XAUUSD) 2-Hour Chart2-hour candlestick chart displays the price movement of Gold Spot (XAUUSD) against the U.S. Dollar, with the current price at 3,373.97, reflecting a +5.99 (+0.18%) change. The chart highlights recent price trends, including a notable upward movement, with key support and resistance levels marked around 3,366.81 and 3,410.25, respectively. The time frame spans from approximately 6:00 AM to 3:35 PM CEST on June 23, 2025.
Gold Market Analysis and Trading Recommendations for TodayLast Friday, the overall gold price on the technical side continued to be under pressure, retracing and oscillating in adjustment. Eventually, it stabilized at the 3340 level before the close, rebounding and oscillating to close. The daily K-line reported an oscillating digital K. The overall gold price continued the recent suppressed oscillating consolidation.
However, over the weekend, the US military attacked Iranian nuclear facilities, intensifying geopolitical tensions in the Middle East, and market risk-aversion sentiment heated up. This morning, the gold price gapped up, piercing the 3390 level, reaching a high of around 3398 before retracing and falling into oscillation.
In the short term, it is highly probable that the gold price will continue to operate in a wide-ranging oscillating interval between long and short positions, continuing to trade time for space. Although the gold price opened high and moved low, it still has not broken the long-term trend channel. Looking for opportunities to go long on retracement is also the current trend.
From the current market trend, today's technical support on the downside focuses on around 3350 - 3345, and the short-term resistance on the upside is around 3380 - 3385, with a key focus on the 3395 - 3405 level. For the day, first, rely on this interval to maintain the main tone of participating in the long - short cycle. For positions in the middle range, always observe more and trade less, and be cautious about chasing trades. Patiently wait for key points to enter the market.
XAUUSD
buy@3345-3355
tp:3370-3390-3410
Investment itself is not the source of risk; it is only when investment behavior escapes rational control that risks lie in wait. In the trading process, always bear in mind that restraining impulsiveness is the primary criterion for success. I share trading signals daily, and all signals have been accurate without error for a full month. Regardless of your past profits or losses, with my assistance, you have the hope to achieve a breakthrough in your investment.
XAUUSD and USOILHesitation Geopolitical factors have led to the escalation of relations between several countries. The Middle East is in chaos. Although this is a trading market, the relationship between the two is too close. This is why the Asian market XAUUSD reached a high of 3400.
But it is not stable. Because after the news that stimulated the rise in gold prices over the weekend, there were some negative news. For example, peace talks, time differences, negotiations and other factors have eased the tense atmosphere. Then the gold price fell with the trend, reaching a low of 3347.
From the overall situation, the market still has the momentum to rise in the short term. But this depends on Iran's response. Including the impact of the Strait of Hormuz. This is the key factor in the rise or fall of oil prices. Investors with larger funds can arrange long orders in advance.
The view on XAUUSD is to buy at low levels. The impact of geopolitics is too huge. On the basis of interest rate cuts, buying is the key to profit. But everyone's financial situation is different, so when trading, remember to control the position ratio. Prevent trading errors from leading to account liquidation.
Next Week Gold Trend Forecast & Trading TipsDuring this round, the price was sold off sharply from the historical high of 3,500 to 3,120 before rebounding. After consecutive rallies, it faced pressure and fell back to 3,452 due to the fading of market risk aversion. On Friday, it rebounded from a low of 3,340. The daily chart recorded a consolidative bearish candle, with the K-line combination leaning bearish, while the 4H chart showed signs of stopping the decline.
In the short term, it is expected to consolidate below 3,400 next week. For the medium term, attention should be paid to the geopolitical crisis and the Federal Reserve's July interest rate decision. A breakthrough node will be ushered in after confirming the resistance above 3,400.
On the short-term 4-hour chart, the support below is focused around 3,340-45, and the short-term resistance above is around 3,380-85. The key focus is on the suppression at the 3,400-05 level. The overall strategy of going long on pullbacks within this range remains unchanged. For medium-term positions, it is advisable to stay on the sidelines, avoid chasing orders, and patiently wait for entry at key levels.
Investment itself is not the source of risk; it is only when investment behavior escapes rational control that risks lie in wait. In the trading process, always bear in mind that restraining impulsiveness is the primary criterion for success. I share trading signals daily, and all signals have been accurate without error for a full month. Regardless of your past profits or losses, with my assistance, you have the hope to achieve a breakthrough in your investment.
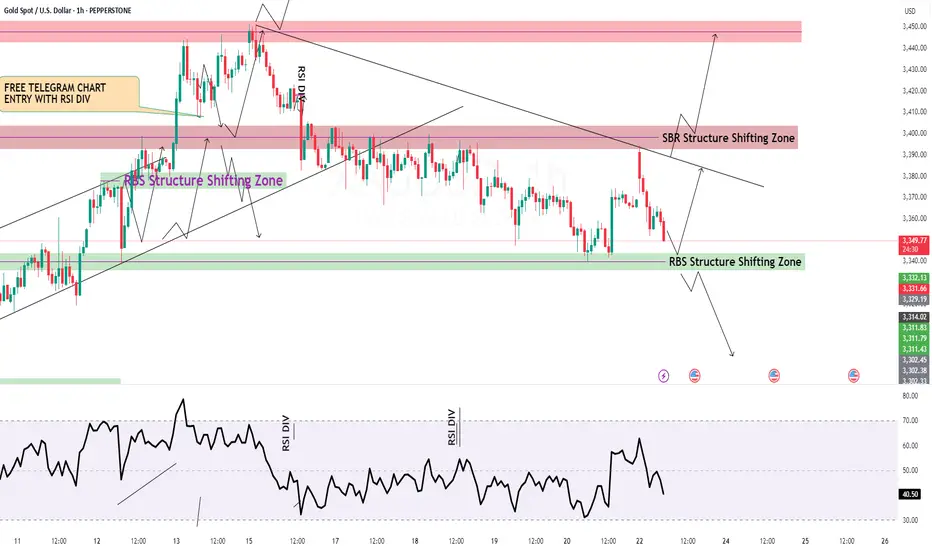
GOLD Intraday H1 Chart Update For 23 June 25 GOLD Intraday Chart show mid term Bearish move for now
For Today keep an eyes on 3368 level Breakout for Buy Scalping for long trade we may wait for dip around 3330-3340 zone SL remains possibly 100 pips
As long as market sustains below 3400 Psychological Level it will remains Bearish and will try to move towards 3200-30 Psychological
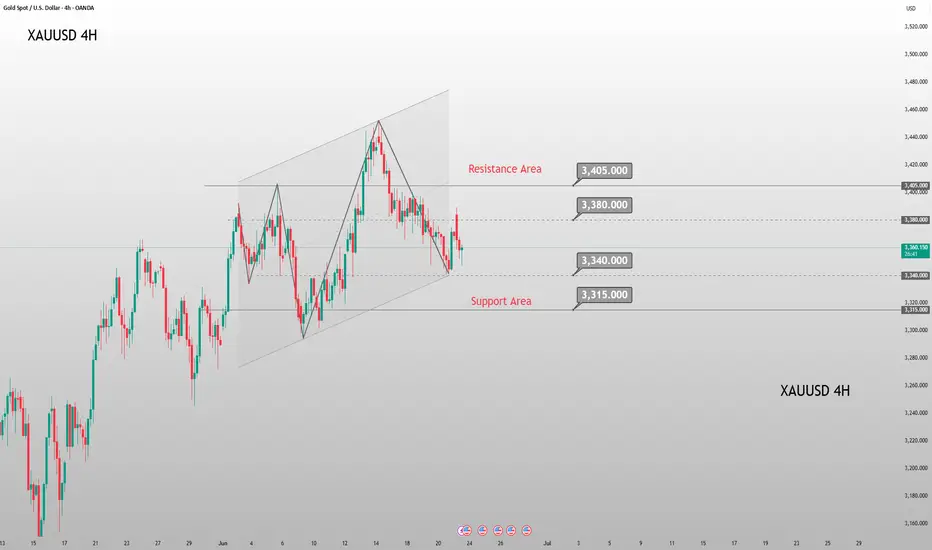
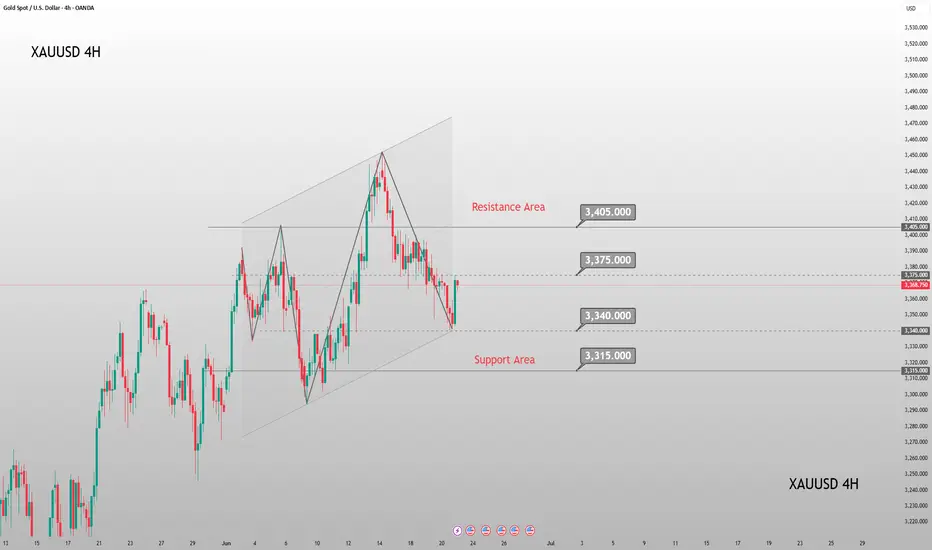
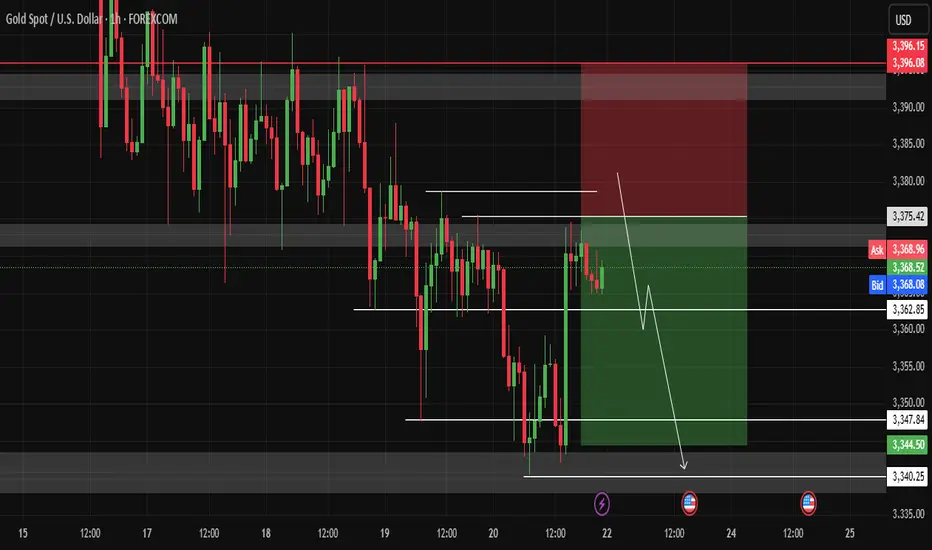
Gold (XAU/USD) 4H Analysis-23 June 2025Gold (spot XAU/USD) is currently trading around $3,358. On the 4-hour chart, price has been range-bound between $3,356 and $3,400. Recently, gold attempted to break higher (up to around $3,394) but quickly reversed — a sign that the breakout may have been a smart money trap. Technically, the structure saw a break below $3,380 in mid-June, leading to a push toward the $3,323 region. This reflects a short-term bearish wave followed by stabilization near the lows.
Bias: The market is currently neutral-to-bullish, depending on key supports. As long as price holds above the $3,322–$3,330 swing-lows, dips are considered buying opportunities. Notably, an order block/demand zone around $3,357–$3,360 appears to be holding well and attracting buyers. On the upside, $3,400 acts as a strong resistance level. A break above $3,400 would shift the bias firmly bullish, while a break below $3,338 would suggest bearish momentum returning.
🔑 Key 4H Support & Resistance Levels
Resistance:
• $3,400 – Major round number and recent high
• $3,434–$3,435 – Next resistance above $3,400
• $3,451–$3,452 – Recent swing top
• $3,500 – All-time-high level
Supply Zone:
• $3,388–$3,394 – Minor resistance and previous support turned supply
Demand Zone (Order Block):
• $3,357–$3,360 – Major 4H demand area showing strong buyer interest
Support:
• $3,338 – Critical support level below the order block
• $3,322–$3,323 – Multi-source key swing support
• $3,280–$3,300 – Lower targets if support fails
• $3,260 or below – Worst-case downside projection if breakdown accelerates
📈 1-Hour Intraday Trade Setups
Buy the Dip
• Entry: $3,357–$3,360
• Confirmation: Bullish reversal candle on 1H
• Stop Loss: Below $3,336
• Targets: $3,380 → $3,400
Sell a Rejected Rally
• Entry: Near $3,400 (only if clear rejection is seen)
• Confirmation: Bearish reversal candle or price stalling
• Stop Loss: Above $3,400
• Targets: $3,360 → $3,330
Breakdown Short
• Entry: If price breaks below $3,338 with strong 1H close
• Stop Loss: Above $3,345
• Targets: $3,323 → $3,300
Bullish Breakout Trade
• Entry: Break and retest above $3,400
• Confirmation: Clean 1H close above $3,400
• Stop Loss: Just below $3,400
• Targets: $3,434 → $3,452
✅ Final Takeaway
Gold is currently trading inside a $3,330–$3,400 range. The best intraday opportunity is to buy dips into the $3,357–$3,360 demand zone with a stop below $3,330, targeting $3,400+. If support breaks, flip to short toward $3,320–$3,300.

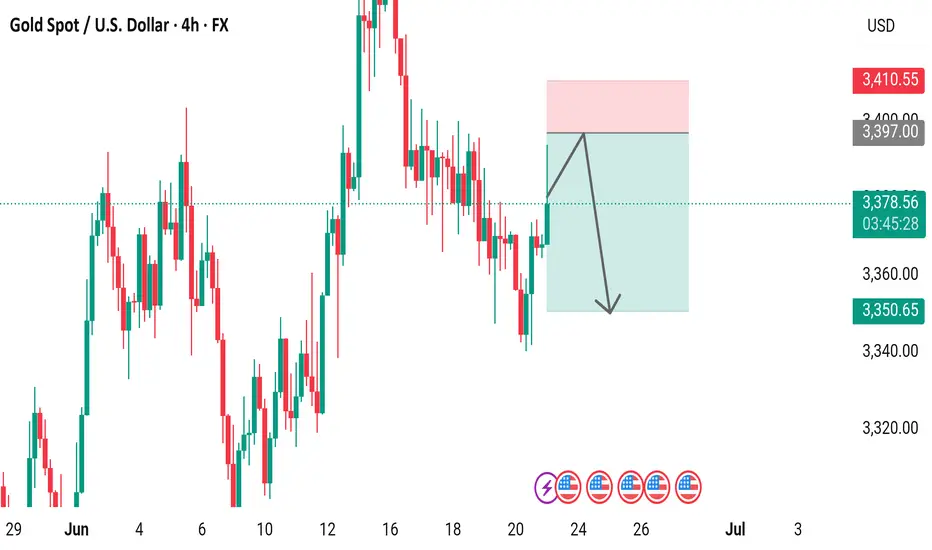
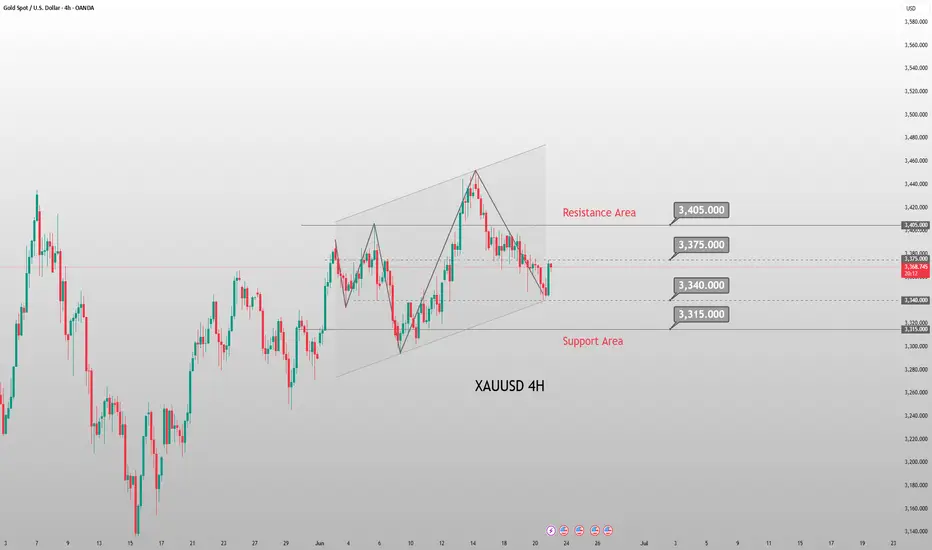
Gold Spot / U.S. Dollar (XAU/USD) 4-Hour Forex Chart4-hour forex chart displays the price movement of Gold Spot (XAU) against the U.S. Dollar (USD) from late June to early July 2025. The chart shows a recent price of 3,377.73 USD, with a slight increase of +9.76 (+0.29%). The candlestick pattern indicates a downward trend following a peak, with a highlighted resistance zone around 3,400 USD. The chart includes a 4-hour timeframe and key price levels ranging from 3,330.00 to 3,400.00 USD.
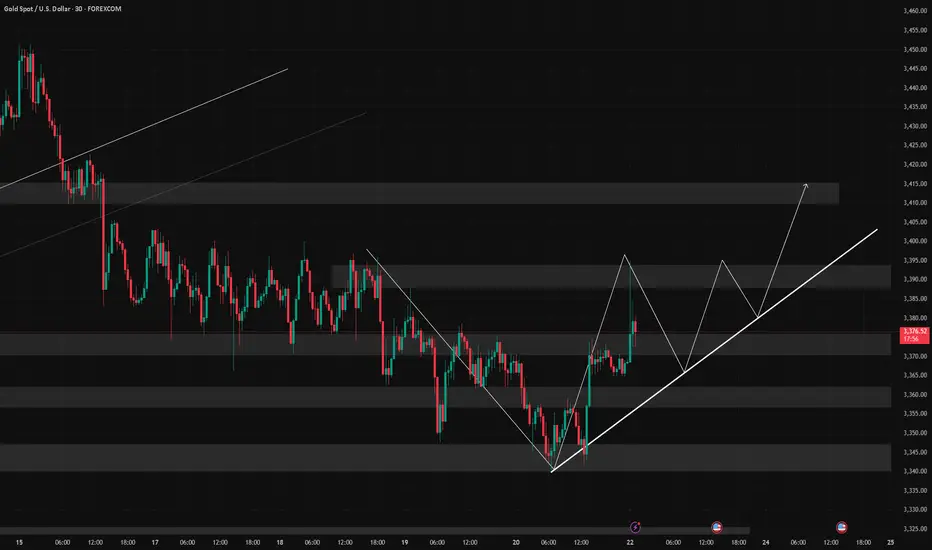
Gold Market Analysis – 30-Minute OutlookThe current structure on the XAU/USD 30-minute chart shows a clear shift from a bearish structure into a potential bullish reversal, marked by multiple Breaks of Structure (BOS) and the formation of new Higher Lows (HL).
🔹 Key Observations:
A strong bullish BOS occurred around the $3,375 area, breaking previous Lower Highs and signaling buyer dominance.
Price reacted aggressively from a bullish Order Block between $3,330 – $3,353, which has proven efficient as a liquidity zone and base for upward momentum.
The price is now consolidating slightly below a major resistance/OB zone near $3,400 – $3,410, suggesting a potential breakout attempt if momentum continues.
The Effeciency indicator reads as “Efficient ✓”, reinforcing that institutional volume may have entered the market.
📈 Scenario Outlook:
If price manages to hold above $3,375, the path toward $3,408 – $3,420 remains valid. A rejection from that zone could lead to a retest of the OB at $3,353 before continuation.
As long as price stays above the Bullish Structure Line (~$3,330), buyers remain in control in the short term.
🧠 Key Levels to Watch:
Support: $3,353 / $3,330
Resistance: $3,400 / $3,410 / $3,420
Trend Bias: Bullish (short-term)
🟢 Market sentiment: Bullish
📊 Structure: Bullish | Order Flow: Efficient | Liquidity: Absorbed & redirected upward
---
Analysis by: Mohsen Mozafari Nejad

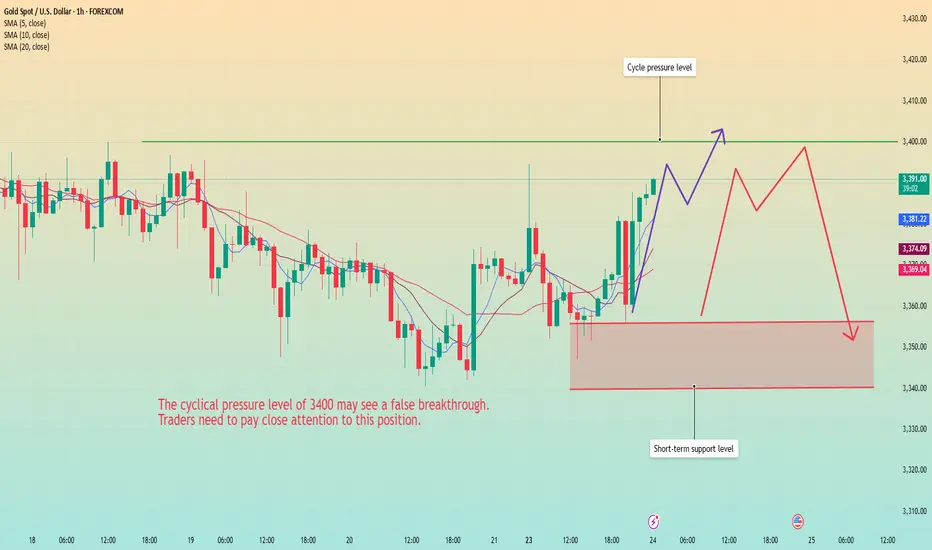
6/23 Gold Analysis and Trading ViewsGood morning, everyone!
Over the weekend, former President Trump announced and carried out an attack on Iran's nuclear facilities, triggering a renewed wave of risk-off sentiment in the markets. At today’s open, gold surged to around 3394. Driven by geopolitical tensions, the bearish technical structure has temporarily been disrupted.
Whether the bullish momentum can sustain will depend on how the situation continues to unfold.
Key technical levels to watch today:
Resistance: 3389 / 3407 / 3423 / 3432
Support: 3372 / 3365 / 3356 / 3348
Trading strategy: Given the current news-driven market, a buy-on-dip approach is preferred, with short positions as a secondary option depending on price reaction near resistance zones.
Also, pay close attention to today’s daily close (1D chart). If the price closes below 3355, it could signal profit-taking from the bulls, potentially pulling gold back into a bearish technical trend.
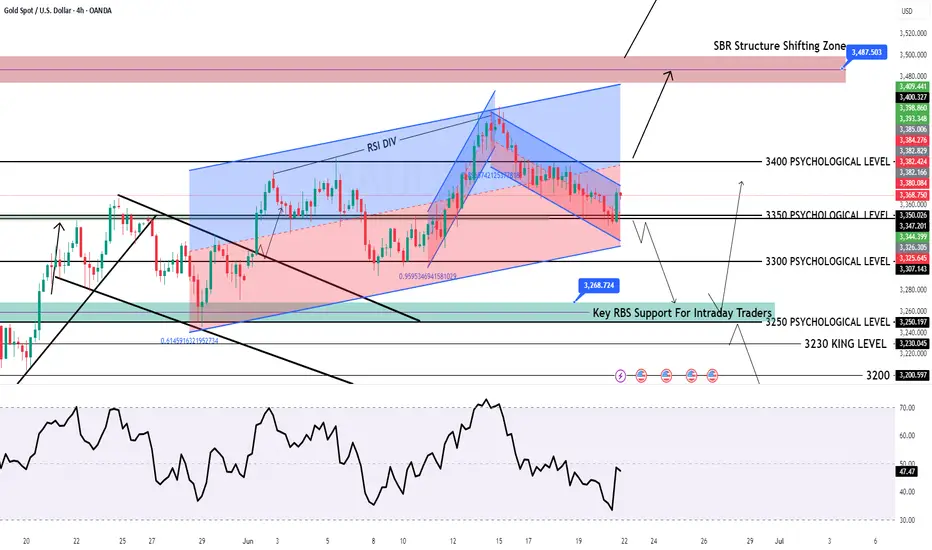
Geopolitical Hedging vs Monetary Policy: Gold Trading TipsGold prices continued this week's correction trend during Friday's Asian trading session, once falling near the one-week low. Although there was a slight rebound afterward, the overall trend remained in a weak adjustment pattern. This correction was mainly affected by the hawkish attitude of the Federal Reserve. At this week's policy meeting, the Fed kept interest rates unchanged, and the dot plot showed that only two rate cuts are expected by the end of 2025, while the rate cut expectations for 2026 and 2027 have been postponed. Even so, the US Dollar Index fell after hitting a weekly high, which provided some support for gold prices. In addition, growing trade concerns and escalating tensions in the Middle East have enhanced safe-haven demand, limiting the decline in gold prices.
From the 4-hour chart of gold, the current bullish momentum is dominant, and the resistance near 3375-3380 is clear. The pullback of gold prices has not broken through the upward channel for the time being, and the medium-to-long-term upward structure remains intact. If the Middle East conflict escalates or trade risks intensify, it may trigger a rebound and repair rally in gold prices. The daily chart closed in a doji star pattern, with prices retesting the middle 轨 of the Bollinger Bands, maintaining a volatile downward rhythm. The hourly chart shows significant downward characteristics, and a bearish strategy can be maintained before the resistance is broken. The resistance range is 3375-3380, and the support range is 3340-3345.
XAUUSD
sell@3070-3075
tp:3360-3350
Investment itself is not the source of risk; it is only when investment behavior escapes rational control that risks lie in wait. In the trading process, always bear in mind that restraining impulsiveness is the primary criterion for success. I share trading signals daily, and all signals have been accurate without error for a full month. Regardless of your past profits or losses, with my assistance, you have the hope to achieve a breakthrough in your investment.
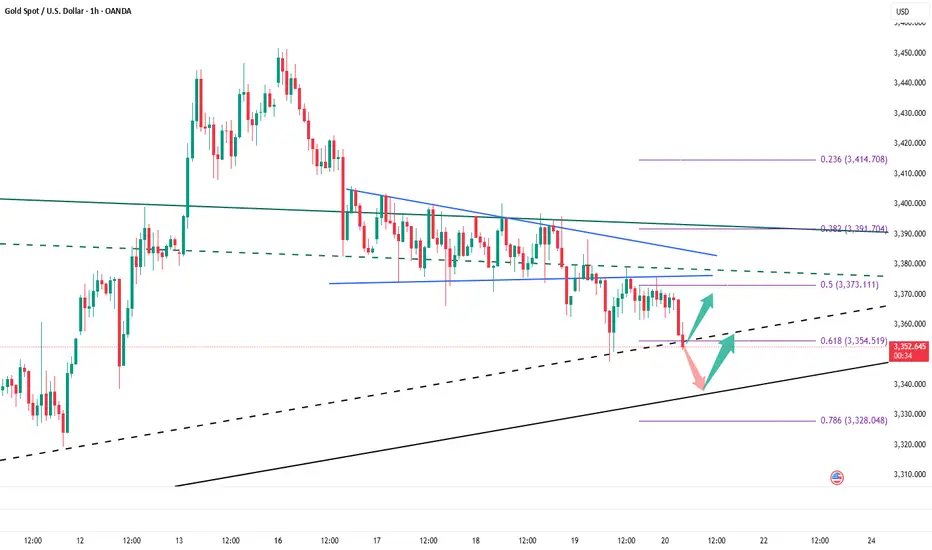
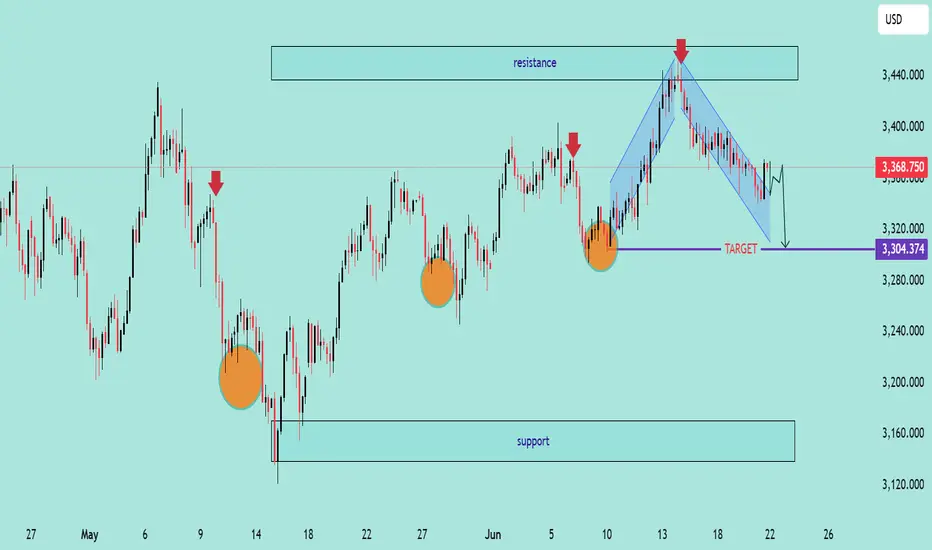
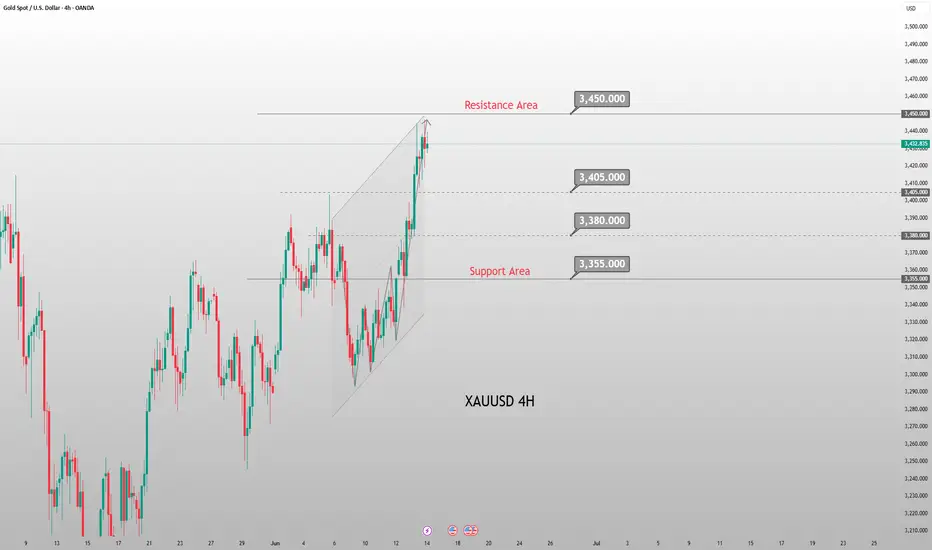
XAU/USD Bearish Pattern Analysis XAU/USD Bearish Pattern Analysis 📉
The chart presents a potential bearish continuation setup in the XAU/USD pair, highlighted by technical structures and key price levels:
📊 Technical Breakdown:
🔸 Bearish Rejection from Resistance
Price rejected strongly from the 3,440.000 resistance zone, marked with a red arrow.
This area has acted as a historical supply zone, triggering repeated reversals.
🔸 Descending Channel Formation 📉
A clear bearish flag/channel structure is visible post-rejection.
Price action broke down from the channel, signaling potential trend continuation.
🔸 Target Level 🎯
The expected target is around 3,304.374, aligning with previous support zones and structure lows.
This level coincides with a measured move from the channel breakdown.
🔸 Higher Lows Pattern Before Reversal ⭕
Prior to the current decline, the market formed a series of higher lows, highlighted with orange circles — suggesting a buildup before reversal.
🧭 Key Levels to Watch:
Resistance: 3,440.000 – 3,420.000 🔼
Current Price: 3,368.750
Short-Term Target: 3,304.374 🎯
Major Support: 3,140.000 – 3,160.000 🛡️
📌 Outlook:
The rejection from resistance coupled with the descending channel breakdown indicates bearish momentum. If the market maintains below the recent high, further downside towards 3,304 is expected. Break below this may expose deeper support zones.
📉 Bias: Bearish
⏳ Short-term Action: Watch for breakdown confirmation and momentum continuation.
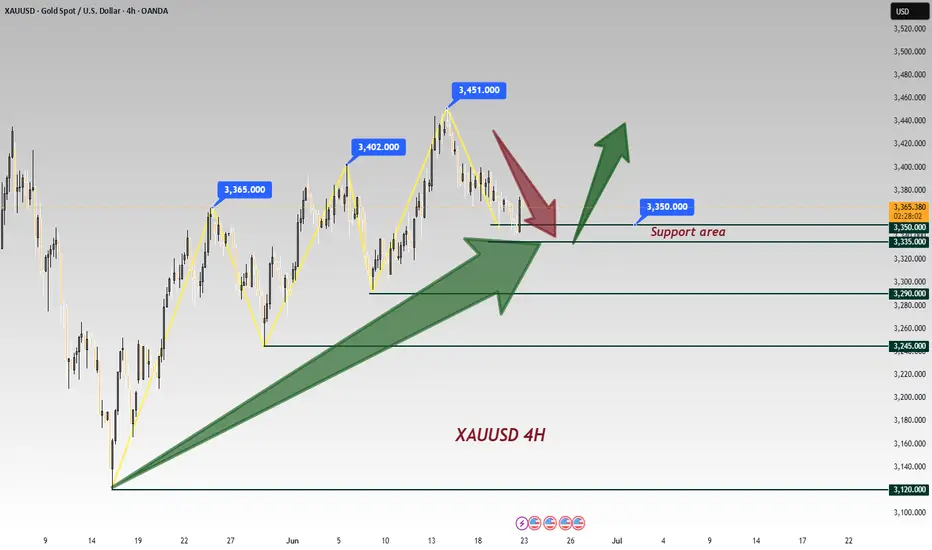
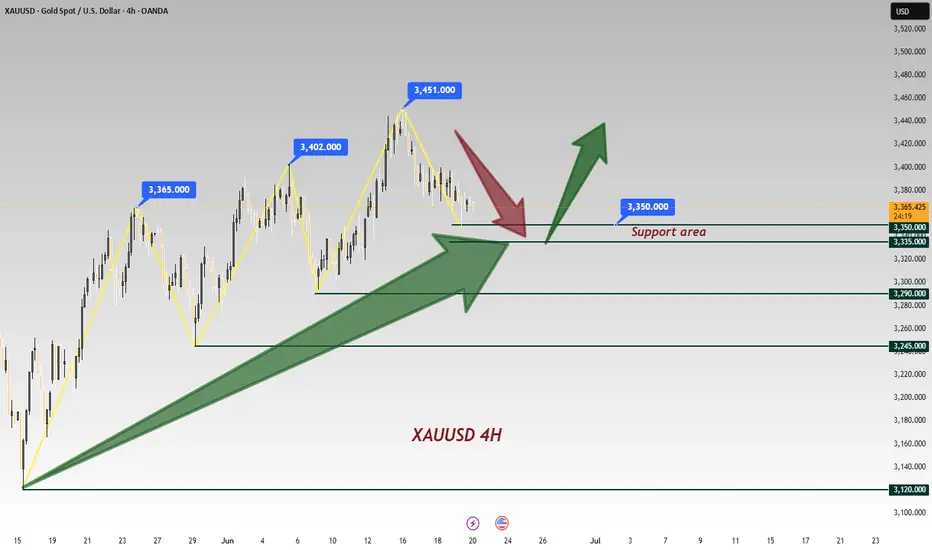
Middle East tensions rise; gold may hit new highs next weekThe Middle East situation has continued to escalate over the weekend, indicating that gold may witness a rally at Monday's opening. On Friday morning, risk aversion surged rapidly, pushing the gold price to around 3,444, followed by a pullback. During the European session, the price quickly retreated to around 3,408 before rebounding—our strategy to go long near 3,410 at the time proved profitable. In the U.S. session, gold mounted a second rally, peaking at around 3,446 before entering a pullback and consolidation phase. However, from a fundamental perspective, the overall trend remains bullish; thus, buying on dips remains the primary trading approach.
From a 4-hour technical view, immediate support lies in the 3,405–15 range, with key support at the recent resistance-turned-support zone near 3,375–80. When gold pulls back, traders should focus on longing near these levels. The critical bullish pivot for short-term traders has shifted up to the 3,345–50 zone; as long as gold holds above this level on the daily time frame, the dip-buying strategy should be maintained.
XAUUSD
buy@3405-3415
tp:3340-3360
Investment itself is not the source of risk; it is only when investment behavior escapes rational control that risks lie in wait. In the trading process, always bear in mind that restraining impulsiveness is the primary criterion for success. I share trading signals daily, and all signals have been accurate without error for a full month. Regardless of your past profits or losses, with my assistance, you have the hope to achieve a breakthrough in your investment.
XAUUSD Trading Signals: Buy Dips at 3335-3345 Amid Bear Trap💡 Trading Framework In-Depth Analysis:
The Fed's policy statement failed to stir volatility (markets had fully priced in dovish expectations 💨);
Weekly market pattern: Asian sessions consistently saw rallies 📈, followed by profit-taking pullbacks in subsequent sessions 📉;
Tactical entry logic: Use intraday highs in Asian trading as resistance references for long positions 🎯.
📊 Technical Validation & Risk Anchors
⚠️ Key Warning: Geopolitical bullish signals ignored → classic "bear trap" characteristics (bear trap 🚫);
⏳ Timing Strategy: Asian session highs form ideal resistance levels—recommend entering on pullbacks to the 38.2% Fibonacci support level 🎯.
⚡️⚡️⚡️ XAUUSD Precision Trading Signals ⚡️⚡️⚡️
🚀 Long Entry Range: 3335-3345 (stop loss can be set below 3325)
🚀 Take-Profit Target Range: 3360-3370 (partial profit-taking at first target 3360 recommended)
📢 Service Value-Added Notes
✅ Core trading signals updated daily in the morning (validated across 4-hour/daily double-timeframes);
✅ Refer to signal logic at any time during trading for sudden situations 🧭 (with historical win-rate statistics attached);
🌟 Wishing you smooth trading Next week — seize pullback opportunities to position 👇
GOLD H4 Chart Weekly Update For 23 - 27 June 25Hello Traders,
welcome to the weekly update, as you can see that market was in range last week
as for now 3400 Psychological remains in focus if market breaks 3400 successfully the GOLD will rise towards 3440
only breaks below 3330 GOLD will leads towards 3250 possibly
FED Chair Powell Testifies due in the upcoming week
USPCE PRICE INDEX due on Friday
Disclaimer: Forex is Risky
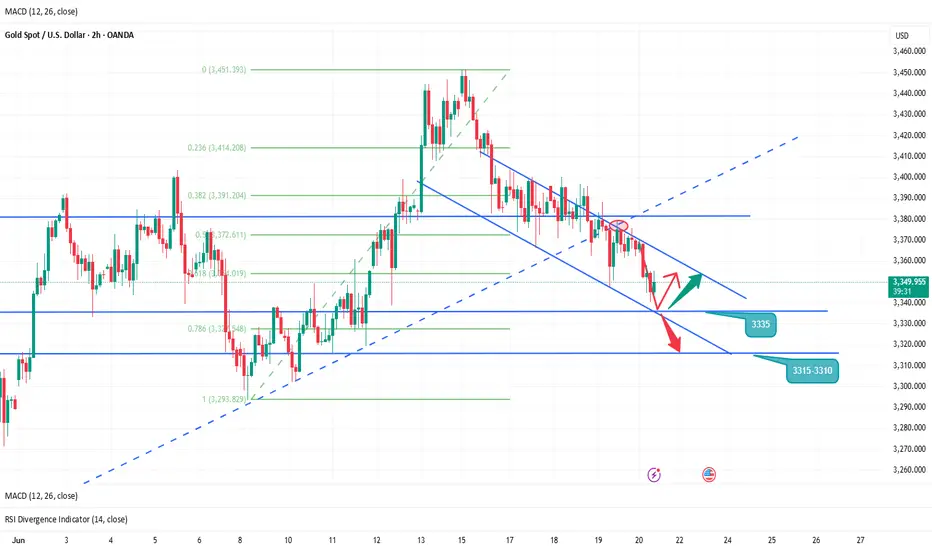
The rebound is weak, is it expected to continue to decline? 📰 Impact of news:
1. Geopolitical situation
2. Pay attention to the impact of short-term trends of the US dollar and silver on gold
📈 Market analysis:
The weekly level large range sweep is still going on, with a focus on the space defense dividing line area of the 10-day moving average and the 3315-3310 area. After falling back to the lifeline in four hours, it continued to bend downward under pressure. During the sweeping decline, the suppression became more obvious. Whether there will be a wave of large-volume market, the pattern is expected to further open and guide the direction. In this process, note that the lifeline 3375 is also the resistance point determined by the last rebound last night. Use this as suppression to sweep the range below. On the whole, for the future gold, if it can maintain the rhythm of defending highs and breaking lows, and successfully closes at a low level today, then next week it is expected to further switch downwards to sweep space. Therefore, we will continue to focus on two support areas, one is 3345-3335, and the other is 3315-3310 after breaking
🏅 Trading strategies:
BUY 3345-3335
TP 3355-3365
SELL 3365-3375
TP 3345-3335-3315
If you agree with this view, or have a better idea, please leave a message in the comment area. I look forward to hearing different voices.
TVC:GOLD FXOPEN:XAUUSD FOREXCOM:XAUUSD FX:XAUUSD OANDA:XAUUSD
Stick to shorting gold and holding itAlthough gold has risen sharply to around 3375 in the short term due to the dovish remarks of Fed officials, it has not made an effective breakthrough. Therefore, gold has not reversed its trend due to the short-term rebound. Gold is still in an obvious short trend. In the short term, gold is obviously under pressure in the 3365-3375 area. If gold fails to break through this resistance area, then after gold consumes a certain amount of long energy, gold shorts will counterattack again and are expected to retreat to the 3350-3340 area again.
In the case that good news cannot support the continued rebound of gold, the market's bullish confidence will be hit again, and the short confidence will be further strengthened, stimulating gold to accelerate its decline, and it is even expected to fall below the 3350-3340 area. Therefore, in short-term trading, I still advocate shorting gold, and I am currently holding a short position in gold, and I look forward to the accelerated decline of gold as expected!
XAUUSD: Is Bullish Trend Ended? Or It is just beginning big moveAs we previously stated that price can reverse between 3340 to 3350 region, which was a pivotal point for bulls. Price smoothly moved currently trading at 3376 and possibly bullish move continuing towards 3400,3450 and ultimately reaching 3600.
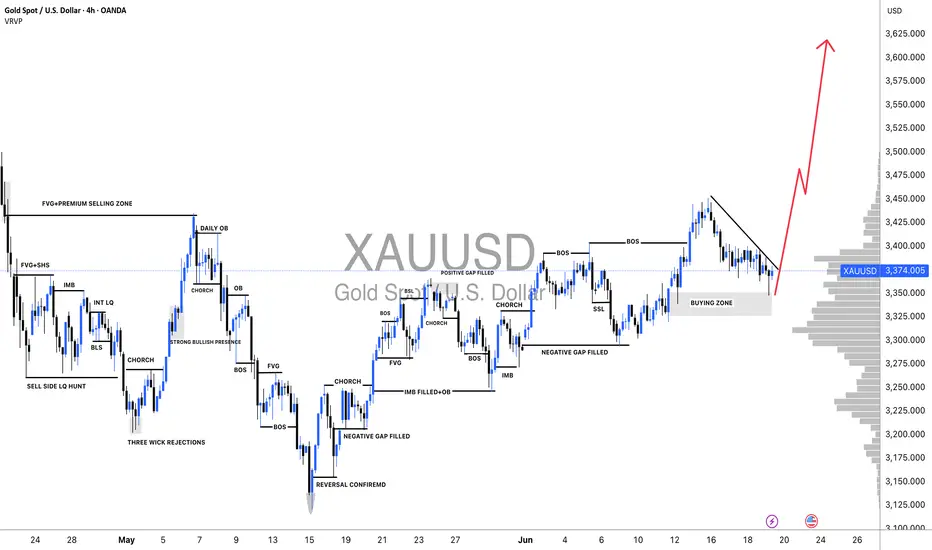
Following the price’s all-time high at $3500, it experienced a sharp decline and failed to maintain that level. A substantial 2400 pips would have resulted in significant losses for many accounts. Initially, it was perceived as a minor correction, with the expectation of further price appreciation. However, this assumption proved incorrect. After reaching an even higher peak, the price invariably undergoes a more substantial correction.
At 3260, substantial bullish volume surged into the market, necessitated by the presence of a fair value gap. Subsequently, the price experienced a decline, reflecting the prevailing bearish trend, which favoured the bears. However, at 3200, a pivotal level representing a discounted price point, bull volume surged. This powerful bullish impulse propelled the price to 3432, ultimately confirming the bullish trend. AB=CD there recurring pattern emerged weekly. When the price reached the 3432 level as a fair value gap, the CD pattern commenced.
AB=CD we have identified a recurring pattern. It appears to be an equal move in any direction, and it has manifested precisely as anticipated. We were aware that the price would reject at 3120, and it did so accordingly. Currently, the market is in our favour. Upon market opening, it exhibited a positive gap, propelling the price to 3450. However, it subsequently declined, reaching 3384.
Presently, we find ourselves in the accumulation phase, poised for distribution. This distribution is anticipated to be substantial, potentially leading to another record high, potentially reaching 3650.
Moving forward, the price could continue towards our target from its current position. Alternatively, there exists a possibility that it may drain the sell-side liquidity and reverse from 3360-3370.
Our take-profit levels are set at 3450, 3490, 3520, and finally, 3600. When entering the market, it is advisable to employ a short time frame. It is important to note that this analysis is merely our opinion, and market conditions may deviate from expectations.
We extend our best wishes for success and safe trading. If you wish to demonstrate your support, you may consider liking, commenting, or sharing this analysis with others.
Sincerely,
Team Setupsfx_
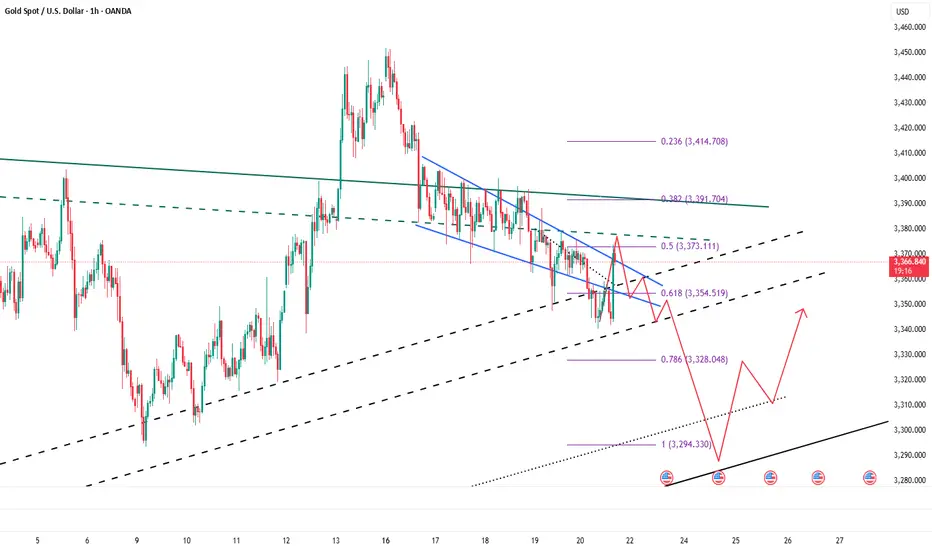
Perhaps 3300 or even 3280 is foreseeable!Obviously, gold is currently fluctuating downward, and in the short term, there is a certain support in the 3340-3330 area, so gold will not fall below this support area in one fell swoop, and it is still possible to rebound to the 3360-3370 area with the support of this area. If gold encounters resistance and retreats again after touching the 3360-3370 area, if there is no major good news, gold is likely to fall below the 3340-3330 area. After gold falls below this support area, the 3300 and 3280 areas are foreseeable.
So according to the above logic, I still hold a long position executed near 3345, and I am very much looking forward to gold reaching the 3360-3365 area;
If gold continues to rebound to the 3365-3375 area, I will try to short gold again; and look forward to the accelerated downward movement of gold!
The above is a preview of the performance of gold. There may be some deviations in the specific execution of transactions, because in short-term transactions, it is necessary to judge the true breakthrough and false breakthrough in advance, but I will still roughly follow the above preview process to execute the transaction! I also hope that this can provide some reference for everyone!
Gold Pullback: Bear Trap or Buy Dip?📊 Chart Analysis: A clear pullback within the established uptrend is visible, testing key support at —a healthy correction that reinforces the bullish structure.
🔍 News Contradiction🌍: Despite escalating Middle East tensions (typically a gold-positive catalyst), prices are trending lower—a classic bear trap scenario 🚫📉. This divergence underscores the importance of buying dips amid emotional sell-offs.
💡 Trading Framework:
Fed policy statement yesterday failed to spark volatility, as markets had already priced in dovish expectations 💨;
Weekly pattern: Asian sessions have consistently seen rallies 📈, followed by profit-taking pullbacks in later sessions 📉;
Tactical entry: Use intraday highs from Asian trading as resistance references for long positions 🎯.
Technical Confirmations:
Risk Warning: Geopolitical bullish signals being ignored suggests deliberate bearish manipulation (bear trap 🚫);
Timing Strategy: Asian session highs serve as ideal resistance markers—look to enter on retracements to 38.2% Fib levels 🎯
⚡️⚡️⚡️ XAUUSD ⚡️⚡️⚡️
🚀 Buy@ 3335 - 3345
🚀 TP 3360 - 3370
Accurate signals are updated every day 📈 If you encounter any problems during trading, these signals can serve as your reliable guide 🧭 Feel free to refer to them! I sincerely hope they'll be of great help to you 🌟 👇
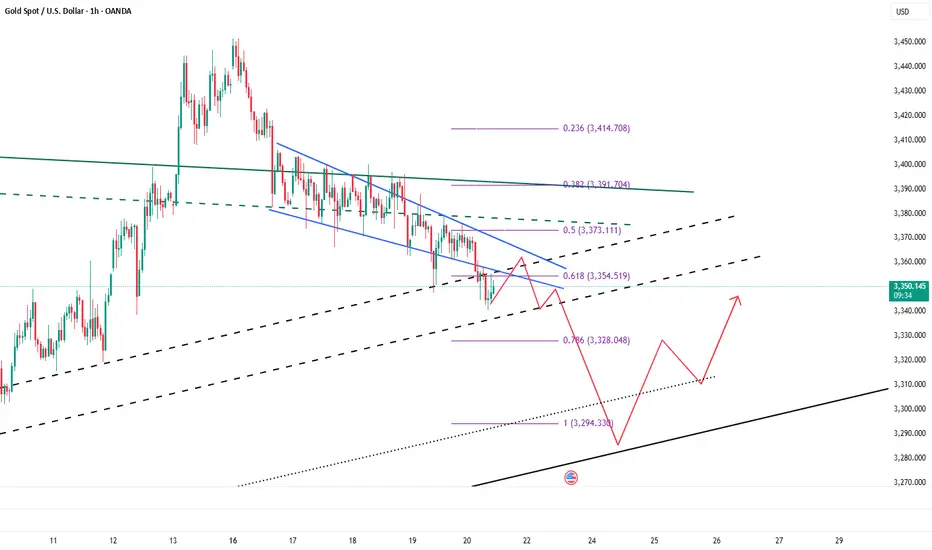
A glimmer of hope for bullish lovers!Gold is currently dominated by bears, but thanks to the support of risk aversion caused by geopolitical conflicts, gold has shown a certain degree of resistance to decline while falling. Therefore, the current market direction is very clear, with weak and volatile downward movement. But under this market situation, we cannot short gold excessively. We can only wait for it to rebound to the pressure level and then short gold, or try to go long on gold with strong support.
At present, gold has touched the 3350 area again, which has a certain support effect. If gold cannot effectively fall below 3350, then gold may still rebound to the 3370-3380 area again; but once gold effectively breaks the support near 3350, gold is expected to continue to fall to the 3340-3330 area.
In terms of short-term trading, I think it is possible to consider starting to try to go long on gold in batches in the 3350-3330 area, TP: 3365-3375