How to plan for the positive effects of CPI data?📰 Impact of news:
1. CPI data is profitable
2. The US CPI rose slightly in May, and Trump's tariff effect has not yet fully emerged
📈 Market analysis:
The CPI data is bullish. The current gold price has risen to around 3360. We took profits at the 3330 level and exited the market, which once again confirmed the forward-looking nature of our trading vision. From a technical perspective, the RSI indicator in the short-term hourly chart is close to the overbought area. In the short term, pay attention to the upper resistance line of 3360-3365. If it rebounds to the 61.8% position and encounters resistance and pressure, consider shorting at high levels. On the contrary, if it effectively breaks through and stabilizes above, it is expected to touch the 3400 line. In the short term, pay attention to the lower support line of 3340-3330.
🏅 Trading strategies:
SELL 3360-3365
TP 3340-3330
If you agree with this view, or have a better idea, please leave a message in the comment area. I look forward to hearing different voices.
TVC:GOLD FXOPEN:XAUUSD FOREXCOM:XAUUSD FX:XAUUSD OANDA:XAUUSD
Xauusdsignal

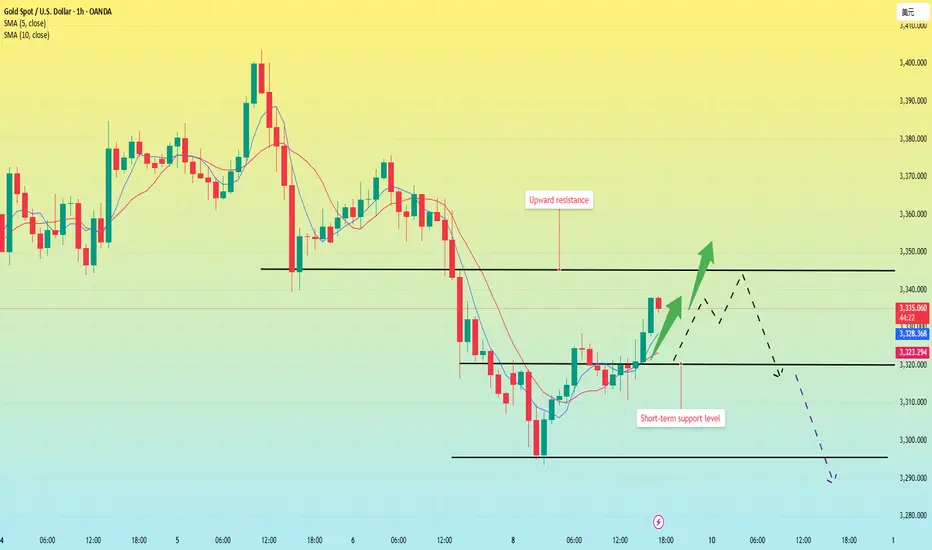
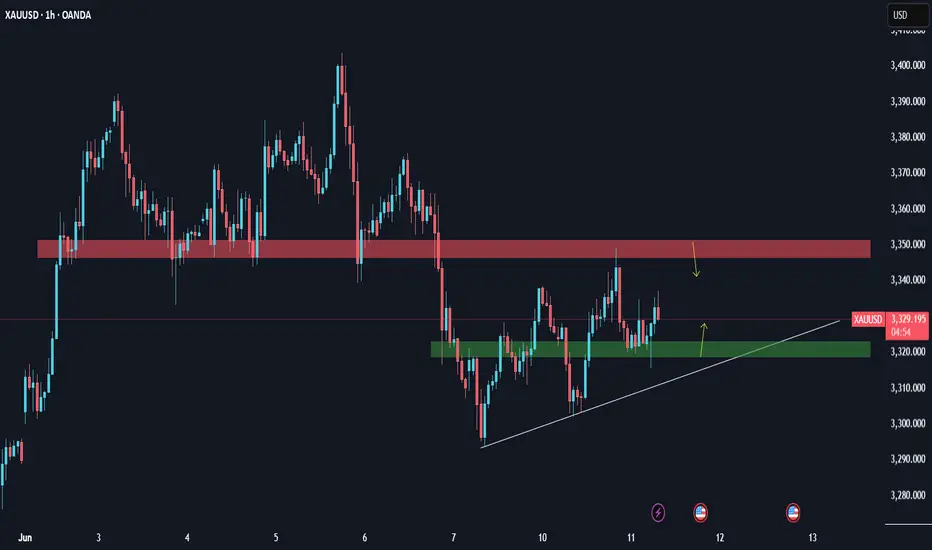
6/11 Gold Analysis and Trading SignalsGood afternoon, traders!
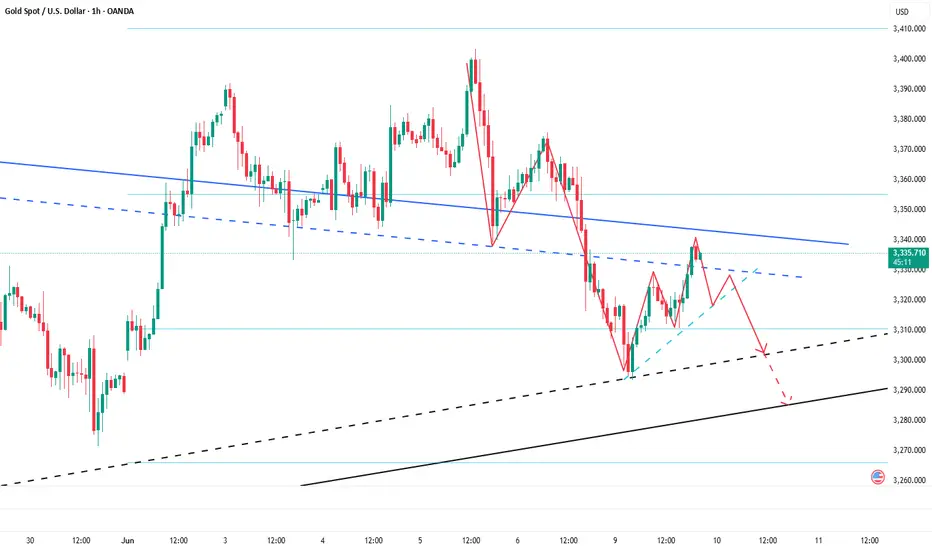
Gold remains capped below the key resistance at 3350, with repeated failed breakouts. Meanwhile, strong support zones below are keeping the price range-bound in a narrow consolidation channel.
📉 Technical Outlook:
As higher lows continue to form, the trendline support is gradually shifting upwards. On the 30-minute chart, we now observe a potential double top pattern forming. If confirmed, it would signal a bearish reversal with the possibility of further downside.
🔍 Key Support Levels:
Watch for the 3330 level as initial support. If it’s broken decisively and the market fails to recover quickly, this may confirm the short-term double top and open the door for more aggressive selling.
On a broader timeframe, focus on 3320 as a critical support area.
📊 Fundamental Focus:
The key event today is the release of U.S. CPI data, which carries significant market-moving potential. A strong reading could be bearish for gold, supporting a shift in sentiment toward the downside.
📌 Today’s Trading Plan:
✅ Buy Zone: 3289–3272
✅ Sell Zone: 3358–3373
🔄 Intraday Levels for Flexible Scalping:
3348 / 3332 / 3319 / 3307 / 3293
Trade cautiously ahead of the CPI report, and keep position sizes moderate to mitigate volatility risk.
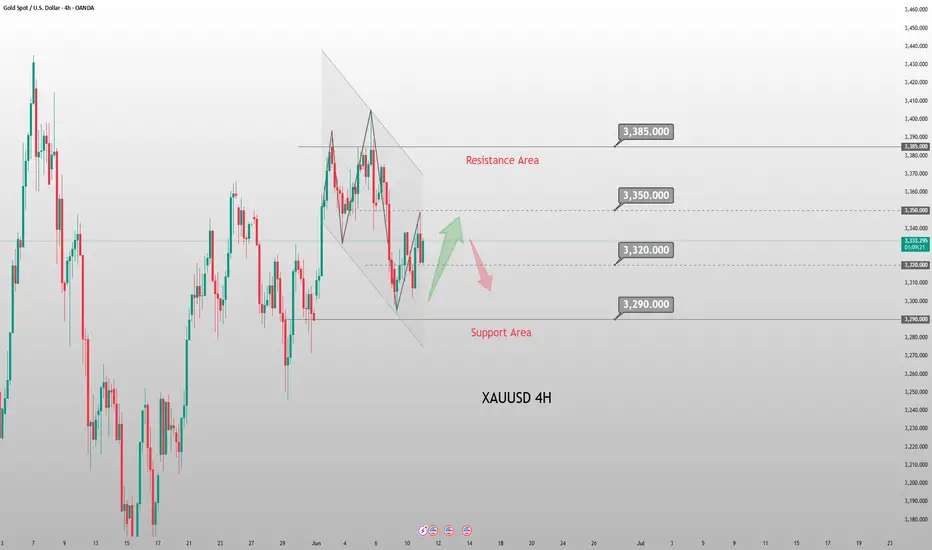
Gold Pulls Back Near 3345: Trend Analysis & Trading TipsWe have once again perfectly predicted the gold trend. Throughout Tuesday, we kept calling for short positions at the rebound level of 3335-45, which offered multiple entry opportunities. With bulls continuously facing overhead pressure, bears should continue to focus on the short-term support at 3295-3306, where the price has been oscillating since the beginning of this week.
From the 4-hour chart, the overhead resistance stands near 3338-45. It is recommended to continue taking short positions based on this level and expect the bearish trend to continue. The support below focuses on the key level of 3288-3290. Overall, the price is expected to continue wide-range oscillation within this interval. The uptrend cannot be confirmed before the daily closing price breaks above and holds 3345.
XAUUSD
sell@3340-3350
tp:3330-3320
Gold Weekly Chart May Form a Mid-Term Bearish Pattern (3142)Gold faced resistance near 3338 and has pulled back,
but the 2-hour chart still suggests that the rebound isn’t over yet, with short-term targets at 3340–3350.
—
📌 For Long Position Holders:
If you're stuck in long positions, consider adding near 3326–3316 support
to average down the cost and prepare for an exit on the next rebound.
⚠️ However, be mindful of your account risk —
If your position is deeply in the red or the account is under pressure, closing out early might be the smarter move.
—
📅 Key Focus This Week: Weekly Chart Signals Critical
🔸 Price is currently testing weekly MA10 — a break below it would target MA20 around 3142
🔸 On the daily chart, MA60 is at 3234, and if support near 3388 breaks,
combined with weak rebound volume, a bearish trend could be confirmed.
In that case, even the 3273 support may fail under bearish momentum.
—
📣 Bottom Line: The bullish setup isn’t invalidated yet,
but caution is crucial when trading long —
📉 If momentum fades, adjust your strategy quickly to protect capital.
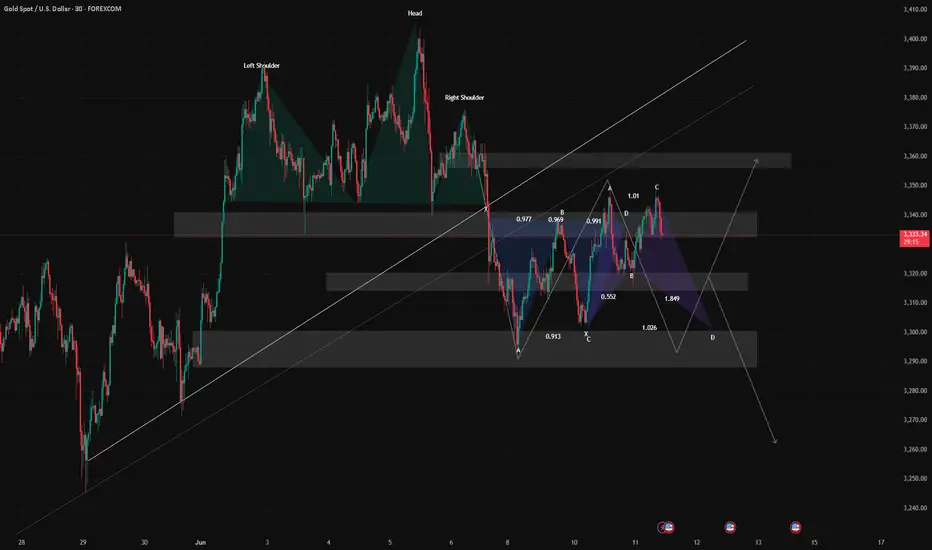
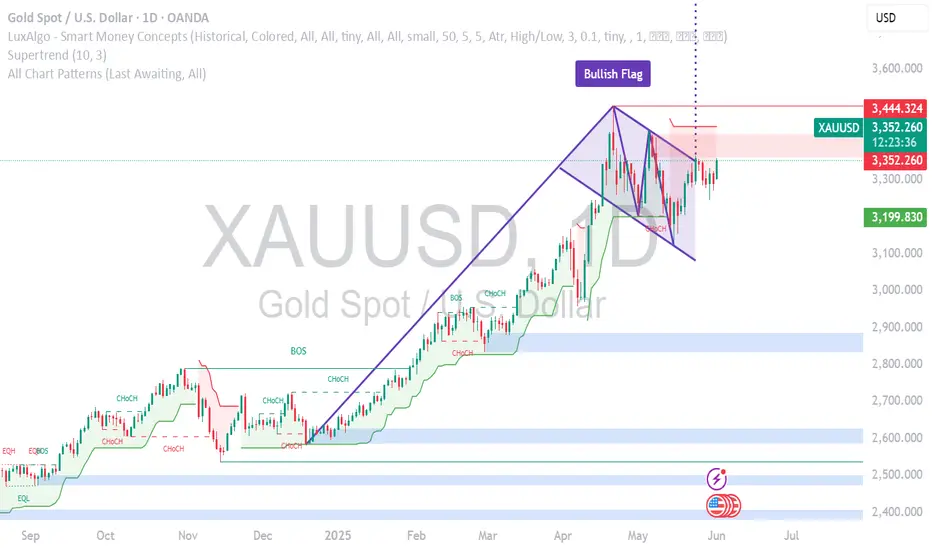
XAUUSD Top-down analysis Hello traders, this is a complete multiple timeframe analysis of this pair. We see could find significant trading opportunities as per analysis upon price action confirmation we may take this trade. Smash the like button if you find value in this analysis and drop a comment if you have any questions or let me know which pair to cover in my next analysis.

GOLD PAY ATTENTION TO BULISHXAUUSD (Gold) Technical Signal ⚠️ | Price action is forming a classic bull flag pattern, showing consolidation after a strong upward move. The flag is starting to 'blush' — early signs of momentum building for a potential breakout. If price breaks above the upper trendline with volume confirmation, we could see a continuation toward higher resistance levels. Traders, keep a close eye – gold may be preparing for its next leg up. #XAUUSD #GoldSignal #BullFlag #TechnicalAnalysis #ForexSignals #GoldBreakout #PriceAction"
GOLD under Influence Of CPI and US-CHINA Trade Agreement.3323-3350 is still Consolidation area until CPI shows any movement.
Also US-CHINA both agreed for new trade deal in London. It's gonna have a strong negative fundamental affect on the price during NY.
Price has already broken the pattern and currently consolidating till CPI. There's clear strong zone around 3350 which seems like holding due to US-CHINA agreement. Expecting a push down under 3250.

GOLD M30 intraday chart update for 11 June 25Hello Trader, Welcome to the US CPI Day
AS you can see that market is still below 3350 Psychological level with given rewards multi-time from that level
now all eyes on US CPI if market successfully breaks 3350-60 zone today the it will move towards 3370/80 or even 3400 psychological level
below 3350 psychological level market remains bearish for shorter term
Disclaimer: Forex is Risky

XAUUSD Bearish Rejection Setup Unfolding – June 11, 2025XAUUSD Bearish Rejection Setup Unfolding – June 11, 2025 🧠🔍
📊 Technical Breakdown:
🔴 Resistance Rejection Zone (Supply Area)
Price recently tested the $3,440 - $3,460 resistance zone, marked with red arrows. This zone previously acted as a strong supply area, leading to aggressive sell-offs.
📉 Bearish Rejection Candle
A rejection occurred near the same supply zone again, hinting at a potential double top or failure to break structure. Sellers seem to defend this area aggressively.
📍 Current Price: $3,338.6
Price is hovering below mid-range resistance at $3,396.5, indicating weakness after a failed breakout.
📉 Bearish Plan in Motion:
🔁 Scenario Highlighted:
Price might retest the $3,396.5 level (purple line) before resuming the downward move (illustrated by the blue and black arrows).
A breakdown below the $3,290.3 support zone will likely trigger further downside.
🎯 Target Levels:
1st Target: $3,290.3 – Key structural support. A close below this level will confirm the bearish momentum.
2nd Target: $3,207.0 – Final support area aligned with previous accumulation zone.
🛑 Invalidation Point:
A sustained breakout above $3,460 would invalidate the bearish bias and suggest continuation to the upside.
✅ Summary:
Bias: Bearish 📉
Strategy: Sell on pullback to $3,396.5 with stops above $3,460.
Targets: 🎯 $3,290.3 ➡️ $3,207.0
Watch for a strong bearish confirmation candle below $3,290.3 to load in shorts.
🔔 Stay alert for volume spikes and lower time-frame breakdowns to fine-tune entries! 💼📊

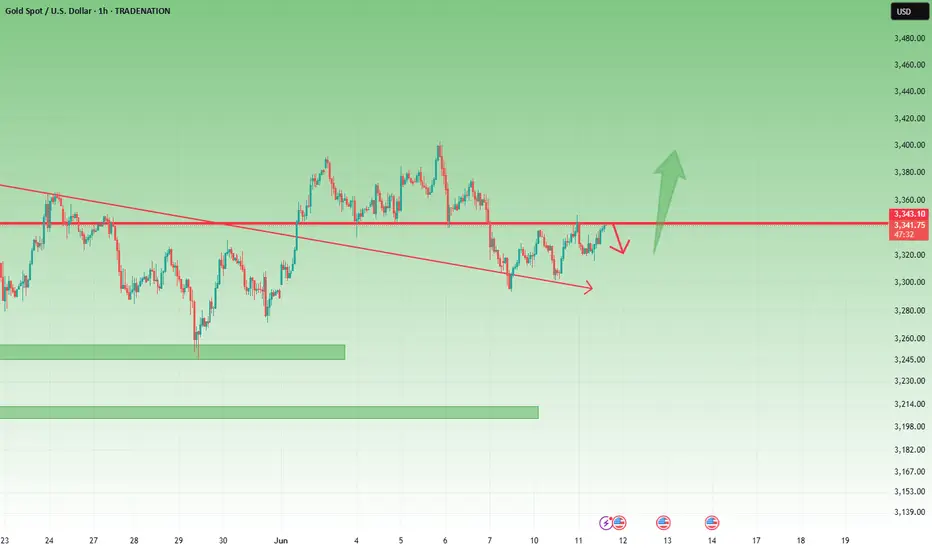
XAUUSD Builds Higher Floors – 3350 Under Pressure1. Recap of Yesterday’s View
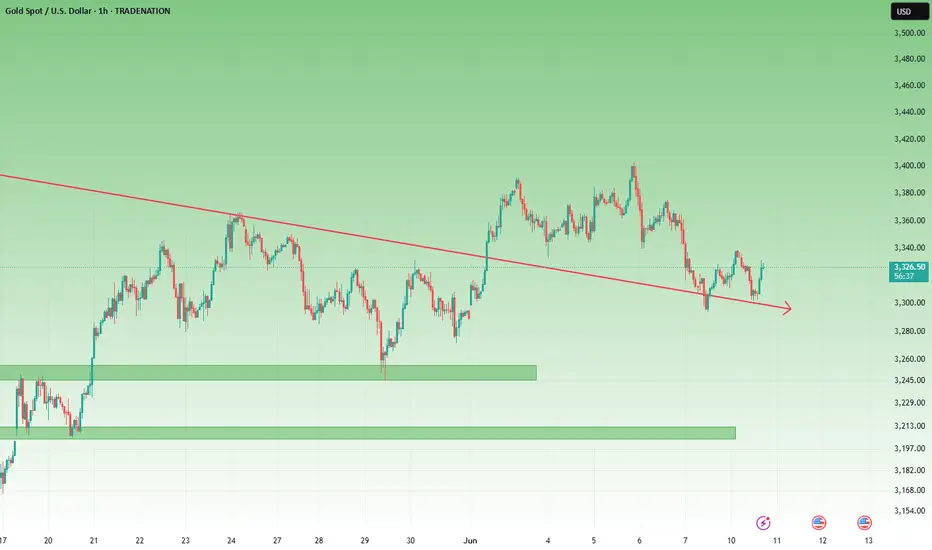
In yesterday’s analysis, I noted that Gold appeared to have built a strong floor around 3300, and while the 3340–3350 resistance zone was still capping the upside, the structure hinted at a potential breakout.
2. What Happened Since?
✅ Price once again rallied into resistance and was rejected.
But here’s the key shift:
🔹 This time, the drop only reached 3315, and it was quickly bought back.
🔹 A new higher base around 3320 is now visible.
🔹 Gold is already back into the resistance zone.
3. Technical Implication
This evolving structure signals bullish pressure is building.
Every dip is being bought higher than the last — a classic sign of demand stepping in.
We are now closer than ever to a confirmed breakout.
4. Trading Strategy
📌 A clear break and close above 3350 = breakout confirmed
🎯 Target: 3400 and above
📉 Until then, buying dips into 3315–3320 remains my preferred strategy.
5. Final Thoughts
The yellow metal is coiling tightly under resistance.
The higher floors are shouting one thing: buyers are in control.
Disclosure: I am part of TradeNation's Influencer program and receive a monthly fee for using their TradingView charts in my analyses and educational articles.
How is the market situation during the China-US talks?Information summary:
On Tuesday, as the China-US trade negotiations entered the second day, the US dollar index fluctuated around the 99 mark.
The gold price once approached the 3,300 US dollar mark in the Asian market, and then continued to rise, reaching the highest of the 3,350 US dollar mark. After the opening of the US stock market, all the gains during the day were given up, and it has been maintained below 3,350 for consolidation.
From the current known negotiation information, the two sides basically agree on the general direction and principles, but it means that more specific content and details have not yet been fully negotiated, and more dialogue is needed to resolve.
Market analysis:
From the current gold market, as long as the 3,350 mark cannot be strongly broken through next, the price will fall again. The consolidation range will remain at 3,300-3,350. As long as the price fails to break through strongly, there will still be a fifth wave of downward trend.
Therefore, gold is still maintaining short selling operations at high points.
Operation strategy:
Short at 3345-3450, stop loss at 3360, the first target is this week's low of 3300, the second target is 3285, and the third target is 3250.
XAUUSD: Analysis June 11Positive signals in US-China trade negotiations put pressure on gold. However, escalating geopolitical tensions between Iran and Israel and Russia and Ukraine have limited the decline of gold. Today, the market focuses on CPI data released today. If the data is released above expectations, it may force the FED to keep interest rates high for a longer period of time, thereby causing gold prices to decrease. On the contrary, if the data is released below expectations, gold will be supported to increase.
From a technical perspective.
The gold sell signal 3340 - 3342 in the US session last night had a very good profit. Gold declined below 3320 but then increased again and moved steadily above this support zone, indicating that the gold's upward momentum may continue.
Analysis of Today's Gold Market Trend and Trading IdeasYesterday, gold prices rose to $3,338 before pulling back, closing the daily chart with a doji star. Weekly and monthly charts suggest an adjustment is needed, but short-term momentum is lacking, keeping the market in consolidation. During today's Asian session, gold prices fell to $3,302 under pressure and stabilized.
In the 4-hour timeframe, the rebound to $3,338 confirmed the previous support-turned-resistance level, which also coincides with the resistance of the broken low and the middle band of the Bollinger Bands. The current range-bound pattern remains unchanged. Today's strategy is to stay bearish but avoid chasing short positions—enter short trades when the price rebounds and meets resistance. Focus on the $3,340 resistance level, with support at the $3,300-$3,290 range.
XAUUSD
sell@3335-3340
tp:3310-3290
Investment itself is not the source of risk; it is only when investment behavior escapes rational control that risks lie in wait. In the trading process, always bear in mind that restraining impulsiveness is the primary criterion for success. I share trading signals daily, and all signals have been accurate without error for a full month. Regardless of your past profits or losses, with my assistance, you have the hope to achieve a breakthrough in your investment.

6/10 Gold Analysis and Trading SignalsGood afternoon, traders!
Gold continues to move within the predefined trading range from yesterday. Both the short from 3338 and the long from 3306 turned out profitable. Currently, price action is developing into a potential double bottom, with price once again testing key resistance around 3338.
🔍 Key Technical Outlook:
If gold breaks above 3338 decisively, and can hold above 3317 on any pullback, the next bullish target area lies between 3345 / 3352–3368.
However, if price fails to break out, then focus shifts back to the 3303–3286 support zone, which may serve as a potential buy region again.
📉 4H Trend Structure:
On the 4-hour chart, price has already broken below the previous uptrend line.
For the bulls to reclaim control, gold must re-establish above 3350 and sustain momentum. Failure to do so confirms bearish dominance, with the next major support near 3257.
Any weak rebound below key resistance can be treated as a short-selling opportunity.
📊 Macro Focus:
No major economic releases today, but traders should prepare for tomorrow's CPI data, which could be a key driver for gold volatility and inflation sentiment.
📌 Today’s Trading Plan:
✅ Buy zone: 3296–3286
✅ Sell zone: 3348–3358
🔄 Pivot levels for flexible intraday trades:
3343 / 3334 / 3326 / 3318 / 3309 / 3300
Stay cautious, manage position sizes wisely, and be alert for momentum shifts as CPI draws closer.
Gold Hits Target Zone — Uptrend May Continue if Support HoldsGold broke below the 3326–3316 support zone earlier today,
but found strong buying interest near 3300, rebounding into the 3340–3350 target range.
Despite facing resistance here, the 2-hour chart still shows an incomplete bullish formation,
suggesting potential for further upside.
—
📌 Key Technical Zones to Watch:
🔸 If price pulls back from the 3340–3350 resistance, monitor 3326 as the key support
🔸 If 3326 holds, bulls may regain control and push the price swiftly toward
→ 3358–3368 resistance zone
🔸 3352 is a critical bull/bear pivot point — a breakout above it could signal a renewed bullish breakout
—
🎯 Trade Strategy:
✅ Long positions may consider partial profit-taking near resistance
✅ If price pulls back and holds above support, re-entry opportunities may arise
⚠️ Watch volume closely and avoid chasing high if momentum stalls

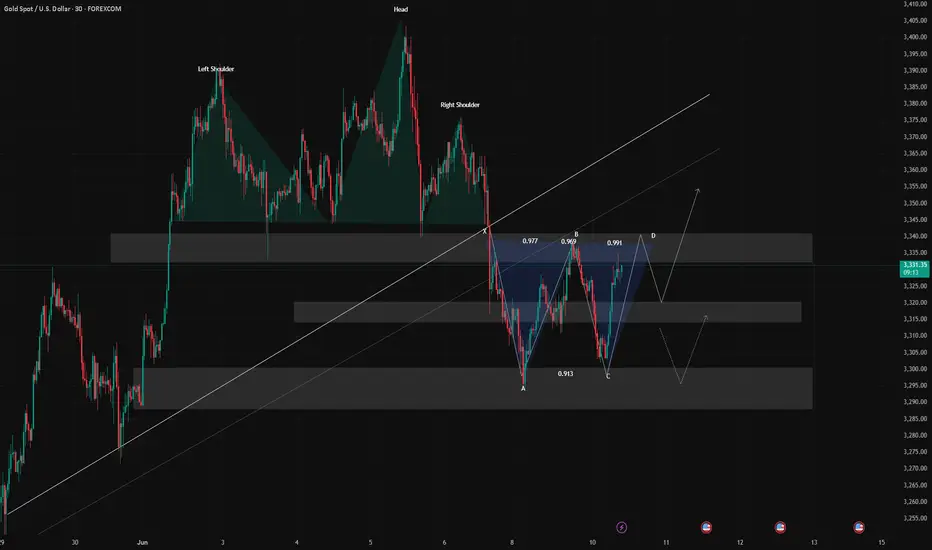
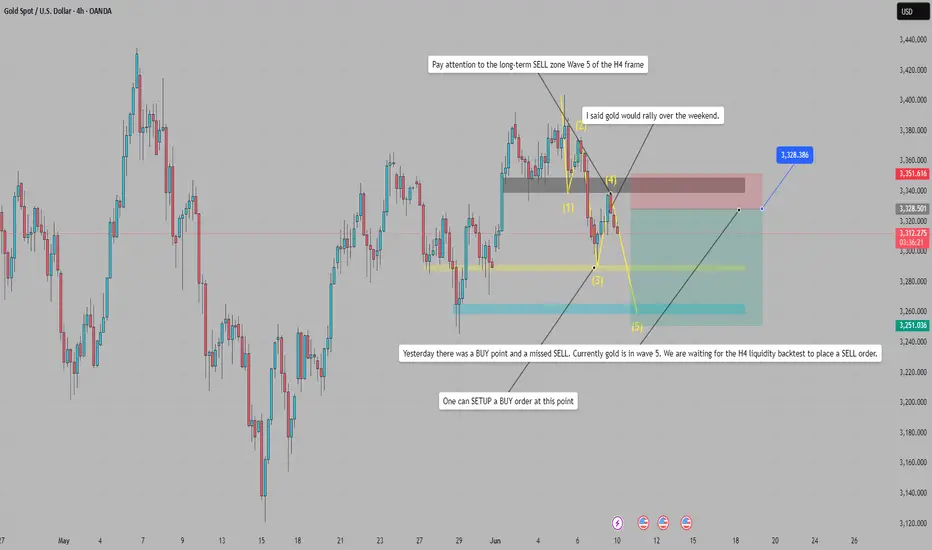
We are waiting for the H4 liquidity backtest to place SELL GOLDYesterday there was a BUY point and a missed SELL. Currently gold is in wave 5. We are waiting for the H4 liquidity backtest to place a SELL order.
World gold prices rose after the People's Bank of China announced on June 7 that it had added gold to its reserves for the seventh consecutive month in May. China's gold reserves were valued at $241.99 billion at the end of last month, down from $243.59 billion at the end of April. Gold prices hit an all-time high (over $3,500/ounce) in April, which boosted the value of China's holdings of the precious metal.
Investors are now waiting for the US Consumer Price Index (CPI), data due on June 13, to assess the country's economic health and predict the trajectory of the US Federal Reserve's interest rate cuts.
Let's wait for SELL
Best regards, StarrOne !!!
gold on bullish#XAUUSD Price still at same movement, expecting bullish to break 3345.
Await 2 times breakout at 3326 for buy, target 3345,SL 3315.
Below the 3313 have a strong bearish continuation, target 3280
Continue buying on multiple breakout above 3342
GOLD M30 Intraday Chart Update For 10 June 2025Hello Traders
Market tested 3302 level this morning and move back towards 3340 SBR structure zone
all eyes on 3340 level clear breakout once market breaks 3340 level it will move towards 3350 Psychological Level or even 3365
Key Support for the day 3300 Psychological Level
Disclaimer: Forex is Risky

Gold rises and then falls, short at 3330📰 Impact of news:
1. Geopolitical situation
2. Impact of the US dollar trend on gold
📈 Market analysis:
Gold rebounded again after falling to 3301, but the upper 3330-3340 line still has strong suppression on gold. Judging from the current trend, because the gold price has risen in the short term and returned to the 3325-3327 line, the short-term resistance is still 3330-3335 and it is expected to fall under pressure. Look for the 3315-3310 position. If it falls below this support, look down to the 3300-3290 line.
🏅 Trading strategies:
SELL 3330-3340
TP 3315-3310-3300
If you agree with this view, or have a better idea, please leave a message in the comment area. I look forward to hearing different voices.
OANDA:XAUUSD FX:XAUUSD FOREXCOM:XAUUSD FXOPEN:XAUUSD TVC:GOLD
Gold Outlook: From Resistance Rejection to Bullish Revival1. Recap of Yesterday's Expectations
In my previous analysis, I highlighted the 3340–3350 zone as key resistance and suggested that any rise into that area could give sellers a better entry.
✅ Indeed, price rallied into that zone and was rejected, validating the plan.
2. What Happened Next?
After rejecting the resistance, gold touched 3300 again, but again, the bulls stepped in:
🔹 A higher low formed compared to the previous day.
🔹 This suggests the market is now shifting its structure from down to potential up.
3. Why 3300 Looks Like the New Floor
Several bullish clues:
- The quick bounce back to 3330 shows buying power.
- Price structure is developing a series of higher lows.
- This suggests growing confidence from buyers.
4. Trading Plan
🔸 A break above 3340 would confirm bullish momentum and open the door toward 3400 again.
🔸 Any dives toward 3300 should now be viewed as potential buying opportunities.
5. Final Thoughts
The market is telling a story of bullish pressure building under 3340 and potential break back above.
Disclosure: I am part of TradeNation's Influencer program and receive a monthly fee for using their TradingView charts in my analyses and educational articles.
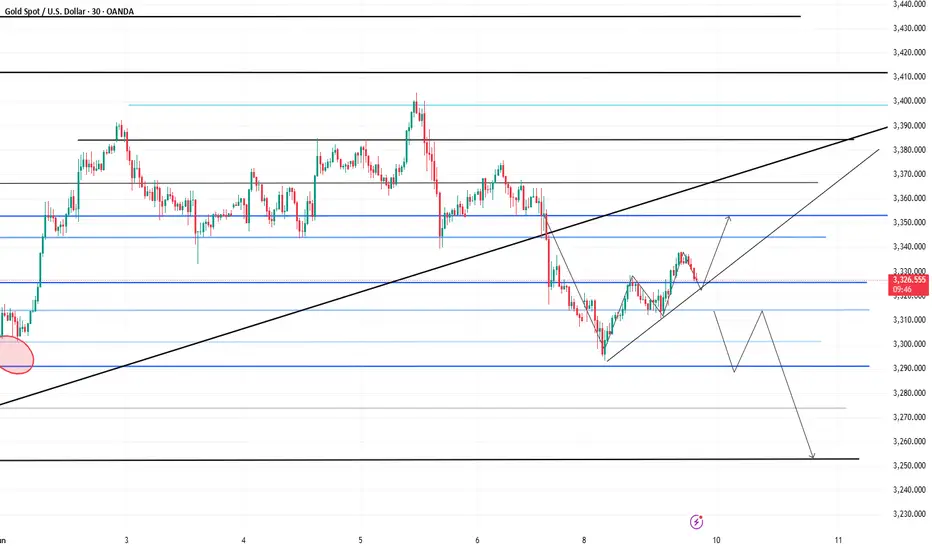
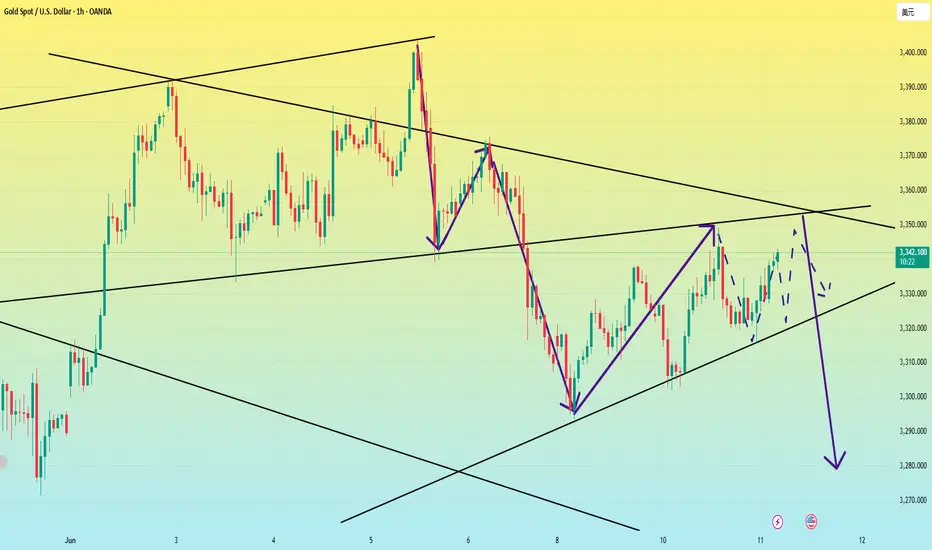
Gold is falling. Where is the low point?Market summary:
Yesterday, thanks to the weakness of the US dollar, the US dollar once fell below the 99.0 mark. Spot gold rebounded from the low of 3293 hit earlier in the session, recovering all the losses during the day, and the highest point was near 3338.
It fell from the high point in the early Asian session on Tuesday, and has been consolidating in the 3300-3310 range so far. In my early analysis, I pointed out that there is a high probability that the fifth wave of the wave trend will fall at the beginning of this week, and as I predicted, it is completing the fifth wave of the downward trend.
Trend analysis:
From the four-hour chart, the fourth wave of rebound has been completed, so today is the fifth wave of the downward trend. Next, we look at the two target ranges.
The first target is around 3280, and the second is 3260-3350. And today, it is highly unlikely to stabilize above 3310, so don't choose to short at the rebound high point, the chance is very slim.
Operation strategy:
Short around 3310, stop loss at 3320, profit range 3380-3350.

Rebound is a good opportunity to short goldGold gradually rebounded after touching 3295. The highest price has rebounded to 3338. Although the rebound has reached $43, the upward momentum is not strong during the rebound. Therefore, the current rebound cannot be confirmed as a reversal trend. Moreover, gold has not yet effectively broken through the 3330-3340 area. Gold is still weak in the short term. Gold still has the potential to fall after the rebound. It will at least retest the 3315-3305 area again.
Therefore, there is no need to fear the rebound of gold for the time being. The rebound of gold is a good opportunity to short gold. I think gold will at least retest the 3315-3305 area again, and even exceed expectations to the area around 3280. Shorting gold is the password for profit in the short term!
Gold price rebounds, short-term strength?After the opening of the U.S. stock market today, the price of gold rose rapidly, breaking through the first resistance level of 3325, and currently reaching the intraday high of 3337.
However, from the hourly chart, the current price has not reached the upward trend point I predicted, so the price is likely to rise slightly again in the future.
From the 4-hour chart, gold rose again after falling back in the U.S. market, and the price broke through the 3325 position upward, which means that the short-term is strong; in the morning analysis, I predicted that gold would fall back and rush high, and the fall back can be short-term long, and the volatile market can be operated in the short term according to this strategy.
At present, the 4-hour MA5-day and 10-day moving averages have a trend of forming a golden cross upward, and after the fall in the morning, the moving averages are currently showing an upward turning trend.
Therefore, after the price breaks through 3325, the probability of continuing upward is still relatively large, and the pressure position is 3345; this position is the point after the fall back from the high point in May, and it is also an important pressure position after the current price falls back and rebounds.
The price is currently heading towards a retest of 3340-3345 levels. If the dollar continues to fall and gold manages to consolidate above 3345, the bullish trend is likely to continue. However, a false breakout of 3340-3345 area could trigger a further decline following the breakdown of the bullish structure.