Bulls pressure, gold price grows 3409⭐️GOLDEN INFORMATION:
Gold prices rallied sharply on Monday, reaching their highest level in over four weeks, as geopolitical risks escalated over the Russia-Ukraine conflict. Renewed tensions on trade between the United States (US) and China prompted investors to buy the yellow metal throughout the day. At the time of writing, XAU/USD trades at $3,377, up by 2.70%.
Market sentiment shifted sour as news broke that Ukraine staged an aerial attack on Russia, which destroyed long-range bombers and other aircraft. Meanwhile, US President Donald Trump doubled down on tariffs over steel and aluminum imports to 50%, effective June 4, and rhetoric against China sent US global equities lower.
CNBC reported that Trump and China’s President Xi Jinping could speak this week, but not on Monday.
⭐️Personal comments NOVA:
Gold prices maintained their upward momentum at the beginning of the week, tariff tensions and the war with Russia remain unpredictable. Gold prices supported to return to the 3400 zone.
⭐️SET UP GOLD PRICE:
🔥SELL GOLD zone : 3409- 3411 SL 3416
TP1: $3400
TP2: $3388
TP3: $3372
🔥BUY GOLD zone: $3313- $3315 SL $3308
TP1: $3327
TP2: $3340
TP3: $3355
⭐️Technical analysis:
Based on technical indicators EMA 34, EMA89 and support resistance areas to set up a reasonable BUY order.
⭐️NOTE:
Note: Nova wishes traders to manage their capital well
- take the number of lots that match your capital
- Takeprofit equal to 4-6% of capital account
- Stoplose equal to 2-3% of capital account
Xauusdsignal

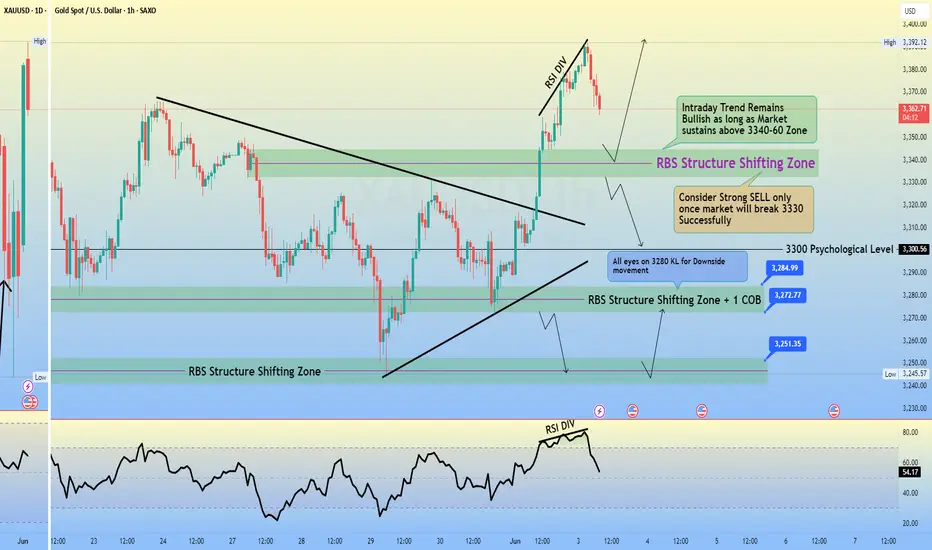
GOLD H1 Intraday Chart For 3 June 2025Hello Traders,
GOLD is in mid term Bullish Trend for now as we already captured nice pips yesterday with directional sequence
but now all eyes on 3400 Psychological Level Breakout once it will break market will move towards 3430
for market in is consolidation zone between 3340-60 and expected to move back towards 3380 or even 90
if market breaks 3330 successfully today then it will move towards 3330 Psychological Level
Disclaimer: Forex is Risky
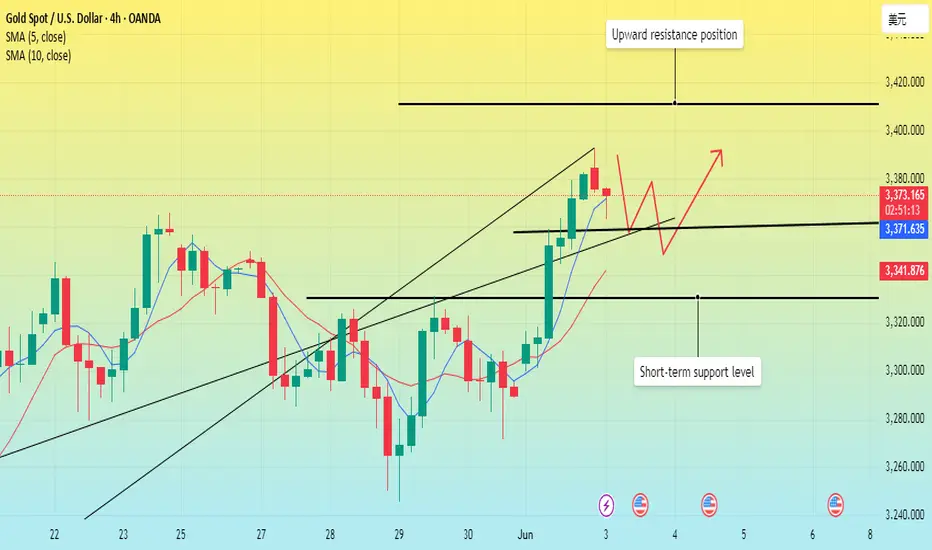
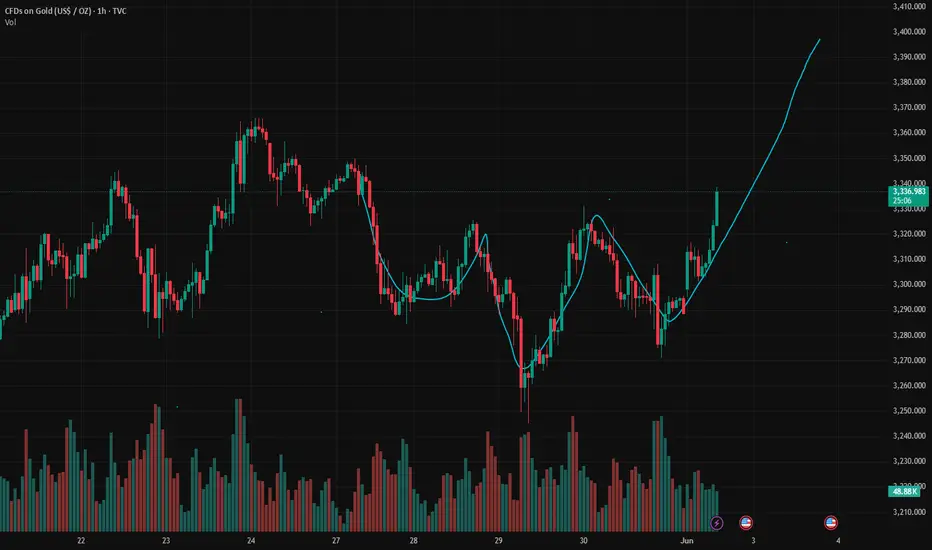
After the price surge, has the trend of gold changed?Gold opened slightly higher in the Asian morning on Monday and then rose. It basically maintained a slow and volatile rise throughout the day. It rose to around 3383 before the close, and the daily line closed with a big positive line.
The current 5-day moving average and the 10-day moving average form a golden cross and extend upward. This signal indicates that the short-term trend is strong. In the short term, we need to focus on the moving average support. The 5/10-day moving average support is in the 3330-3325 area. As long as the price remains above this area, it can be treated as strong. The upper resistance level needs to pay attention to the previous secondary high point of 3438.
In terms of points, the lower support level first looks at around 3360, which is the previous high point of the short-term. After breaking through, we need to pay attention to the top and bottom conversion. The second is the 3330-3325 area support. Pay attention to the top and bottom conversion. If the price falls back strongly, we need to pay attention to the 3300 mark support. This is the current support area of the trend line formed by the low point connection of gold since the rise of 3120.
The upper resistance level is around 3410, followed by the resistance in the 3448-3458 area. This area is the current resistance area of the rising channel formed by the high point since the rise from 3120.
Operation strategy:
Short at current price, stop loss at 3390, profit range 3360-3340;
Long at price drop to around 3340, stop loss 3325, profit range 3345-3360.
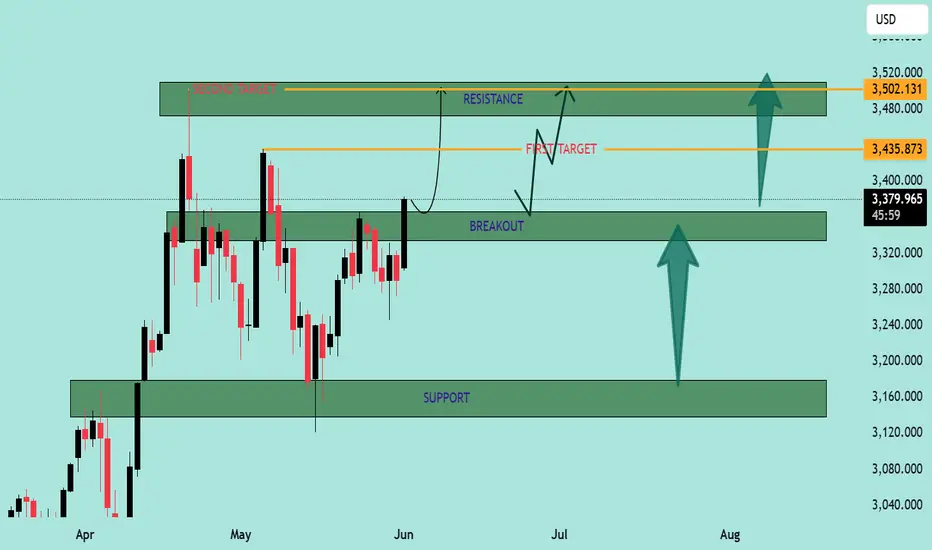
XAU/USD Price Action Analysis – Bullish Breakout Setup XAU/USD Price Action Analysis – Bullish Breakout Setup 🚀
🔍 Chart Overview:
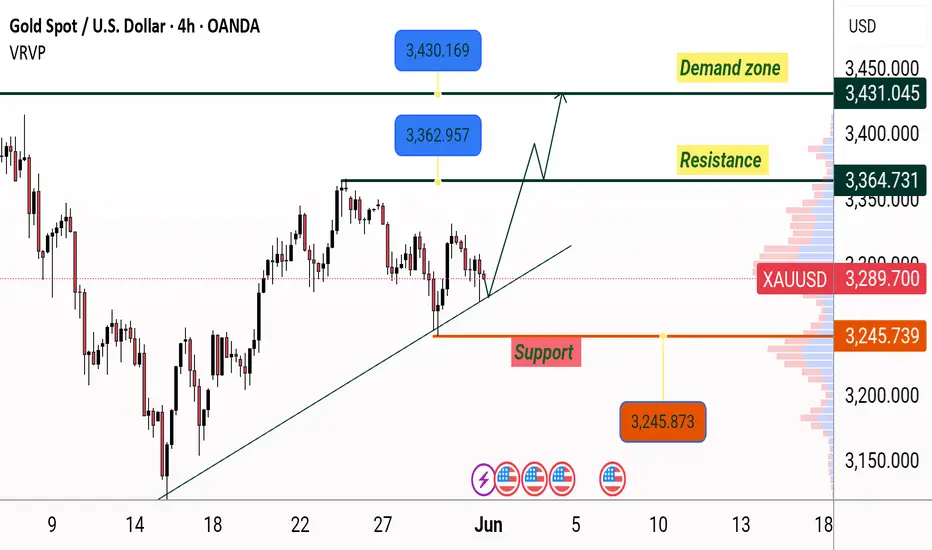
This chart illustrates the price movement of XAU/USD (Gold vs USD) on a mid-term time frame, highlighting a potential bullish breakout scenario from a key resistance zone.
🟩 Key Levels:
Support Zone: 🛡️
➤ $3,140 – $3,200
This zone has acted as a strong support multiple times, preventing further declines and serving as a springboard for bullish moves.
Breakout Zone (Current Level): ⚡
➤ $3,340 – $3,390
Price is currently testing this crucial resistance-turned-potential-breakout zone. A successful close above this level could confirm bullish continuation.
First Target: 🎯
➤ $3,435.87
This intermediate resistance aligns with a previously tested high. It may act as the first barrier after the breakout.
Second Target: 🥇
➤ $3,502.13
This is the major resistance zone. If bulls maintain momentum, this area will likely be tested.
🧭 Market Structure & Bias:
Price is forming higher lows, signaling growing bullish strength.
The chart shows a bullish breakout of a sideways consolidation zone.
The upward arrows and curved projection suggest a potential pullback-retest scenario at the breakout level before rallying towards targets.
🧠 Trading Plan (Illustrated by Chart):
📈 Breakout Entry:
Wait for confirmation above $3,390 with strong bullish candles and volume.
🔁 Retest Opportunity:
If price pulls back to the breakout zone ($3,340 – $3,390), this may serve as a solid re-entry point for long positions.
🎯 Profit Targets:
TP1: $3,435
TP2: $3,502
🛑 Invalidation:
A strong close back below $3,320 may invalidate the bullish bias.
📌 Conclusion:
The chart indicates a bullish continuation setup for XAU/USD with clearly defined breakout, retest, and target zones. Traders should monitor price action closely around the breakout area for confirmation before entering long positions. Risk management remains key. 🧮⚖️
Gold breakout? My opinionGold in short time frame was in bearish trend which it broke out of, however price action is still bearish. Generally trendlines are powerful enough to change price section. Turning points are marked on the chart, I will look for trades in these areas.
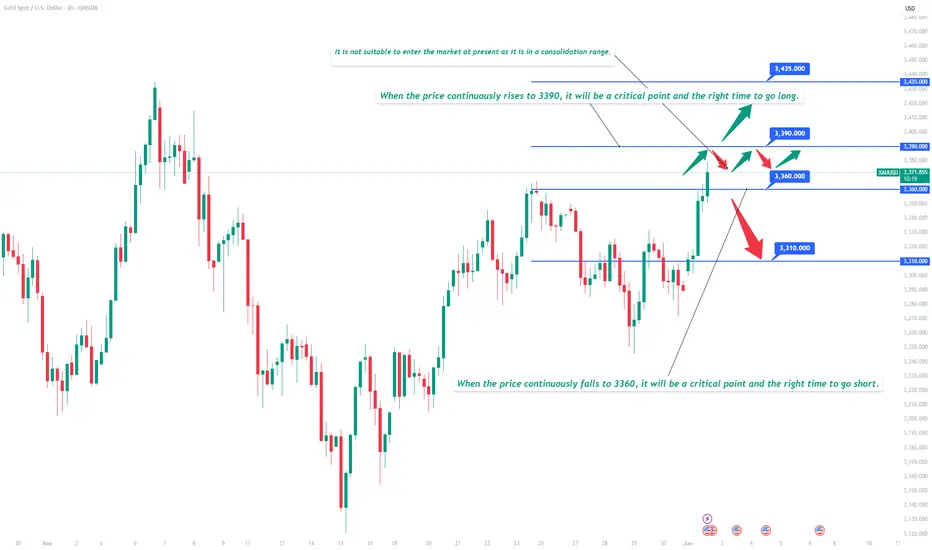
Gold stumbles at 3379 resistance! Bull-bear eyes 3360-3390 zone I. Resistance and Support Levels
Resistance 🚧: The intraday high of 3379 acts as initial resistance, with strong resistance in the 3390-3400 zone 🏔️.
Support 🛡️: Initial support is at 3360-3365, while strong support lies in the 3325-3330 range 📉.
II. Trading Strategies
(1) Aggressive Long Position 🚀
Entry 📊: Lightly initiate long positions when the price pulls back to the 3365-3368 zone and stabilizes (e.g., bullish candlestick patterns appear 🔥).
Stop Loss ⛔: Exit if the price breaks below 3360.
Targets 🎯: First target at 3390; if breached, aim for 3435* (Note: "34350" in the original text is likely a typo—adjust based on actual market conditions ⚠️).
(2) Conservative Long Position 📈
Entry ⏳: Enter long after the price validly breaks above 3379 and retests support at the 3390-3395 zone 🔄.
Stop Loss ⚠️: Exit if the price falls below 3375.
Targets 🎯: Same as the aggressive long strategy 📍.
(3) Short Position 📉
Entry 📊: Lightly initiate short positions if the price rejects resistance in the 3380-3385 zone (e.g., bearish candlestick patterns form 📉) or fails to break above 3390 and drops below 3375 ⬇️.
Stop Loss ⛔: Exit if the price breaks above 3388.
Targets 🎯: First target at 3360; if breached, aim for 3330 🏁.
Professional trading strategies are pushed daily 📊
Lock in precise signals amid market fluctuations 🚀
Confused about market trends? Stuck in strategy bottlenecks?
Real-time strategies serve as your "trading compass" 🌐
From trend analysis to entry/exit points, dissect market logic comprehensively
Refer now 📲
Help you move steadily forward in investments ✨
👇👇👇
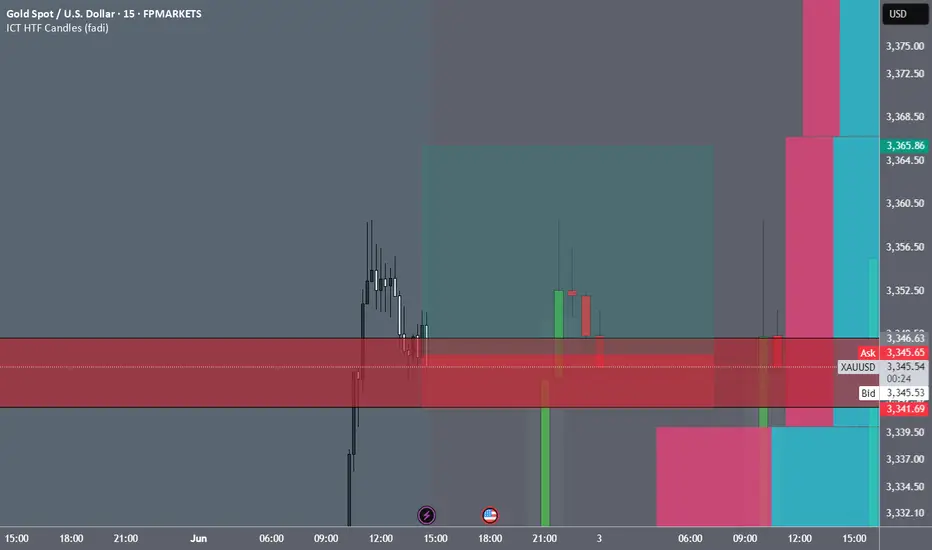
XAUUSD Daytrade Signal!!!!Hello everyone i want share my trade at XAUUSD.
I will make full analysis tonight at gold.
Open long position at 3346
Stop loss at 3342
Take profit at 3366
Always make your own research!!!!
6/2 Gold Analysis and Trading SignalsGood evening, traders!
Gold surged more than $70 today, reaching an intraday high of 3363.
If you held short positions from last Friday’s close based on my plan, I hope your SL protected you from major losses.
📉 Technical Insight:
The rapid rally has triggered overbought signals and correction pressure
Watch for pullback support levels at:
3342
3328–3321 zone
If these hold, price might retest 3400 tomorrow
🎯 Trading Plan:
📉 Sell around 3360–3372 (with tight stop)
📈 Buy near 3328–3318 (if price stabilizes)
🔁 Scalp zones:
3332 / 3338 / 3343 / 3352 / 3366
Gold 1D timeframe. What Next Moment?Hello everyone, I am back after 3 years. Finally I have decided to continue my trade journey in forex and crypto professionally.
Here is the analysis of XAUUSD/Gold.
Gold has taken a big bold moment of Uptrend since strong resistance breakout on march of 1st, 2024. Since that time Gold didn't looked back & continued it's rally in uptrend. So our major trend is Uptrend in 1D and 4H timeframe. Gold did some downtrend and sideway rally and again took another uptrend rally on Dec of 18th, 2024. Gold break all top high and made new high 3500.
If I talk in 1D timeframe gold is trading in bullish flag, and I am not wishing it right now to break upward. But has you know it is gold anything can happen. While today is Monday and market opening was in gap. So it needs to fill the gap after that we can execute a trade. Still now needs some confirmation that it will come down. So have patience and watch the market carefully.
Key point.
Resistance - 3356, 3369, 3396
Support - 3343, 3323, 3304
Any Query Reach Us or comment down
Rudra Vasaikar Wishes You A Great And Very Amazing Trading Life. Trade Safe, Trade Right.
RISK WARNING 🔴 🔴 🔴
There is high risk of loss in Trading Forex, Crypto, Indices, CFDs, Features and Stocks. Choose your trade wisely and confidently, please see if such trading is appropriate for you or not. Past performance is not indicative of future results. Highly recommended - Information provided by Pro Trading Point are for Educational purpose only. Do your investment according to your own risk. Any type of loss is not our responsibility.
HAPPY TRADING.
#gold #xauusd #xauusdtrading #goldtrading #goldanalysis #forextrading #forex #trendline #goldsignals #goldnews goldlatestanalysis #xauusdtradesetup #forextradingguide #fxgold

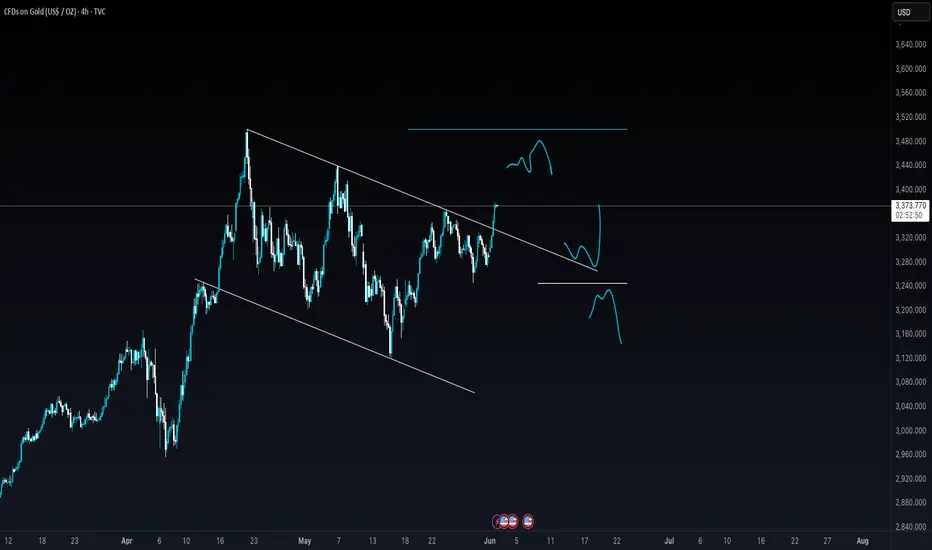
Will Gold drop to 3200 zone next week?🟡 1. What happened last week with Gold (XAUUSD)
Gold began last week by testing the 3350 resistance zone, hinting the end of the correction and the potential for an upside breakout.
However, in the following days, the market reversed aggressively, reaching as low as 3250 on Thursday — a drop of nearly 1000 pips from the local top and resistance zone.
After this sharp fall, Gold bounced back above 3300, retested the 3325–3330 area, but failed once again — closing the week below 3300.
❓ 2. Key question: Has the rebound ended or is it just a deeper trap?
The market has shown a fake-out followed by compression under resistance.
So the real question becomes: Will the 3280–3290 support finally give in, or will bulls defend it again?
________________________________________
🔻 3. Why I expect a continuation to the downside
Here’s what the chart structure tells us:
• Clear lower highs and lower lows — the trend remains bearish
• 3330 has turned into major confluence resistance
• Every bounce is sold, showing fading bullish momentum
• The support at 3280–3290 is being squeezed repeatedly
If 3280 breaks cleanly, price action will likely accelerate downward.
________________________________________
🧭 4. Trading Plan for Next Week
Focus remains on selling rallies, especially if price rises above 3300.
📉 Invalidation: any clean break and hold above 3330
🎯 Target Zones:
• 3250 = Soft target (first reaction zone)
• 3200 = Real target (bearish continuation zone if structure unfolds as expected)
Use structure, not emotion. Let the breakout confirm the plan.
________________________________________
🚀 5. Final thoughts
The price action around 3280 will likely set the tone for next week.
A breakdown here confirms the bearish structure and opens the door to 3250, then 3200.
Until then: sell rallies, manage risk, and wait for the chart to validate your edge.
Stay sharp. 🚀
Disclosure: I am part of TradeNation's Influencer program and receive a monthly fee for using their TradingView charts in my analyses and educational articles.
XAUUSD:BUYAfter the good news came out. XAUUSD followed my expectations. Continued to rise above 3300. The current quotation is 3317.
The tariff issue was released again over the weekend. Inflation fermented again, and the Russian-Ukrainian negotiations reached a tense and uncertain stage again.
Traders who followed me to buy near 3290 successfully made good profits.
Trading reference
XAUUSD:
Pressure position: 3360-3350
Support position: 3305-3295
BTCUSD:
Pressure position: 107000-106000
Support position: 103000-102000
This week, there is the impact of the release of non-agricultural data.
Usually divided into the front, middle, and back end of the triple impact. For traders, every time is a good trading opportunity. The impact is also very large.
This week, we will focus on the impact of news and the stimulation of news to layout the wonderful transactions of XAUUSD and BTCUSD. Remember not to trade independently to avoid losses. If you have any ideas, remember to leave a message to me and my assistant.
Is the positive news fading? The latest analysis of gold📰 Impact of news:
1. The conflict between Russia and Ukraine breaks out again, exacerbating the uncertainty of the situation
2. The tension in the Middle East continues, Iran claims to be ready to defend its airspace at any time, and the Houthi armed forces attack Israeli airports
3. May PMI data released
📈 Market analysis:
As geopolitical conflicts between Russia and Ukraine and the Middle East broke out again over the weekend, gold jumped higher today. From a technical perspective, the 1H chart shows a bullish arrangement, but the gold price is in a downward channel at the daily level. The gold price is currently near the middle track of the Bollinger Band and is obviously suppressed by the downward channel. The 4H level Bollinger Bands narrowed, the moving averages adhered, the long and short positions were in a stalemate, and the MACD indicator hovered around the 0 axis. 3330 - 3335 above is the key resistance area. If it breaks through 3340, it is expected to continue to see new highs. At the same time, there is short-term support in the 3285-3280 range below. 3270 - 3265 becomes the key important support. If it falls below, it may fall to 3245. For short-term operations in the Asian and European sessions today, if the resistance area of 3325-3335 cannot be effectively broken through, you can consider shorting and look towards 3310-3290 in the short term.
🏅 Trading strategies:
SELL 3325-3335
TP 3310-3290
If you agree with this view, or have a better idea, please leave a message in the comment area. I look forward to hearing different voices.
TVC:GOLD FXOPEN:XAUUSD FOREXCOM:XAUUSD FX:XAUUSD OANDA:XAUUSD
Here's a weekly buy-side analysis🟢 Bias: Bullish (Buy)
Gold remains in a long-term uptrend, with fundamental and technical factors supporting continued upside.
50 & 100 EMA: Price is well above both EMAs, confirming bullish momentum.
RSI: Around 60–70 on the weekly; no bearish divergence yet.
MACD: Histogram ticking upward with bullish crossover in play.⚠️ Risk Factors
Sudden USD strength due to surprise Fed hawkishness.
Strong U.S. labor or inflation data that pushes bond yields higher.
Gold profit-taking near ATH could cause sharp but temporary pullbacks.
Trade conflicts are re-emerging, will gold rise?Information summary:
Gold prices rose slightly in early Asian trading on Monday, affected by the long-term uncertainty of tariffs and international geopolitical conflicts, which increased the demand for safe-haven assets.
Trump made a statement earlier that China had violated the Sino-US trade negotiation regulations in a big way; then the US Treasury Secretary assured that the United States would never default. This has once again led to tensions in Sino-US trade relations, and investors are also cautious about this news.
This news has undoubtedly disrupted the international market and supported the rise in gold prices.
Traders need to pay attention to the May ISM manufacturing report to be released by the United States today, which may affect the new trend of gold.
Trading analysis:
I think the repeated emotions of the United States on tariffs will cause gold prices to rebound after a downward adjustment, and then fall slightly.
If gold cannot break through the upward 3350 cycle pressure level strongly and stabilize above this position. Then the price will fall back below this position.
Operation strategy:
Long at 3340, stop loss at 3330, take profit at 3350.
Short at 3350, stop loss at 3365, profit range is around the early support level of 3300-3390.
If you want to trade steadily, you can continue to wait and see for some time, because there are too many black swan events in the Asian market today, and the market is full of uncertainty.

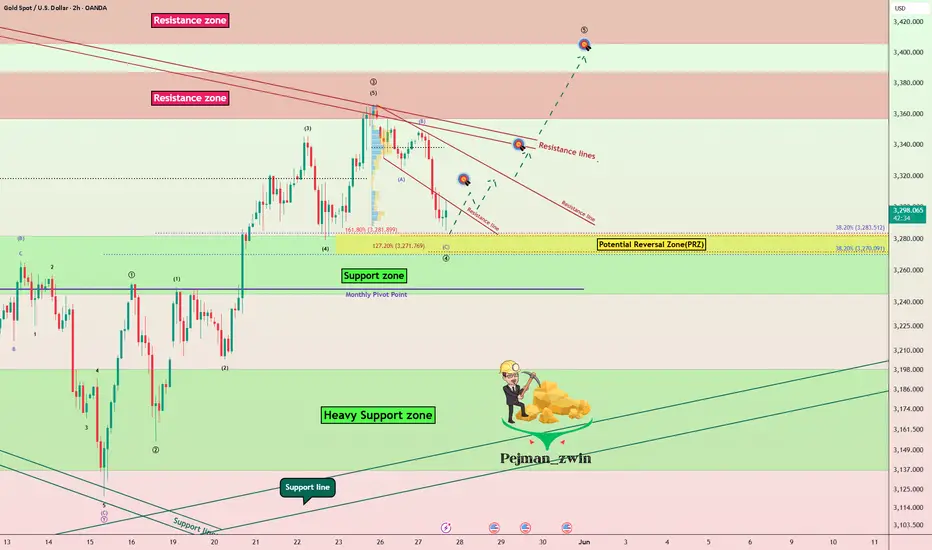
Gold Finds Support in PRZ – $3,337 in Sight? As I expected in my previous idea , Gold ( OANDA:XAUUSD ) moved towards the Support zone($3,280-$3,245) after breaking the lower line of the ascending channel.
Gold is moving near the Support zone($3,280-$3,245) , Potential Reversal Zone(PRZ) and Monthly Pivot Point .
In terms of Elliott Wave theory , Gold appears to be completing a main wave 4 . The structure of the main wave 4 can be complex . Confirmation of the end of the main wave 4 requires a break of the Resistance lines and Resistance zone($3,387-$3,357) .
I expect Gold to move up after entering the Potential Reversal Zone(PRZ) and the first target could be $3,314 and the second target could be $3,337 . If the momentum is high for Gold, you can consider higher targets for Gold to increase .
Note: If Gold touches $3,245 , we should expect further declines.
Gold Analyze ( XAUUSD ), 2-hour time frame.
Be sure to follow the updated ideas.
Do not forget to put a Stop loss for your positions (For every position you want to open).
Please follow your strategy; this is just my idea, and I will gladly see your ideas in this post.
Please do not forget the ✅' like '✅ button 🙏😊 & Share it with your friends; thanks, and Trade safe.
GOLD H1 Chart Update For 2 June 25As you can see that there are some important zones mentioned on the chart
First read all details carefully market is in sideways for now once market will break 3330 level then it will move further higher towards 3360 even 3370
3300 Psychological Remains in focus once market breaks 3300 then it will try to fill the OPENING GAP which is due on 3289
for today if market sustains below 3280 level then it will move towards 3240-50 zone
Scalping or shorter term range in 3295-3320
Remember always use SL
Disclaimer: Forex is Risky

The international situation is turbulent, how is the trend of goInformation summary:
On June 1, Russia and Ukraine continued to clash. Ukrainian drones attacked several Russian military airports, including military bases in eastern Siberia, more than 40 aircraft were damaged, and the loss was about 2 billion US dollars. This was the first time that a military base in Siberia was attacked by a drone. Murmansk Oblast was also attacked by a drone on the same day.
However, on the same day, Russia and Ukraine planned to hold a second round of ceasefire negotiations in Istanbul on June 2. The United States said that it was not informed of the Ukrainian attack in advance. Russia and the US Foreign Minister discussed the negotiation plan by phone. The Hungarian Prime Minister revealed that the mediation in 2024 was unsuccessful, and the two sides had obvious differences on the timing of the ceasefire.
The current situation is complicated, the prospects for peace talks are unclear, and market risk aversion and economic data (this week's employment report, central bank interest rate decision, etc.) have become new focuses.
Gold trend analysis:
From the daily chart, the current daily support position is around 3280. This position is the key to the gold band trend. Since the price has broken upward recently, it has stepped back many times and finally closed above the daily support, so the position of the daily support is still the key. Before falling below this support level, the price will most likely maintain a range of 3320-3280 US dollars.
Operation strategy:
Buy near 3280, stop loss 3270, profit position 3320.

The dollar is strong, will gold break through the consolidation?At the beginning of this week, the US dollar index fell to a one-month low due to Trump's sudden change in the direction of the EU policy. Subsequently, due to the contest between Trump and the US Trade Court ruling, the prices of gold and the US dollar fluctuated greatly.
I think the US dollar will start to rise next week with the help of non-farm payrolls data. I am afraid that a new round of price fluctuations is coming.
If the US dollar is to have a new upward trend in June, gold will also be affected. Judging from the current daily line of gold, the overall trend is also to be adjusted downward.
The high point of gold in May was 3438, and the low point was 3120. I also drew the Fibonacci dividing line in the figure. The most critical position is 3317 at the 0.382 position and 3280 at the 0.5 position.
Gold is still maintaining a consolidation of 3317-3280. Although there have been breakthroughs above and below, they are all within the daily range. Next week, as long as gold can close below 3280 on the daily line, it will start a correction trend step by step. The first target below is around 3250, and the second is 3180-3200.
As long as the daily line of gold can close below 3180, then we will usher in a big bearish trend at the daily level. On the contrary, the daily line of gold cannot close above 3317 again. In a better situation, it may touch around 3340 again and then retreat again.
The bad result is that it directly breaks through the pressure level and stands above the 3340 trend line. If this happens, the price of gold may move towards a new high.

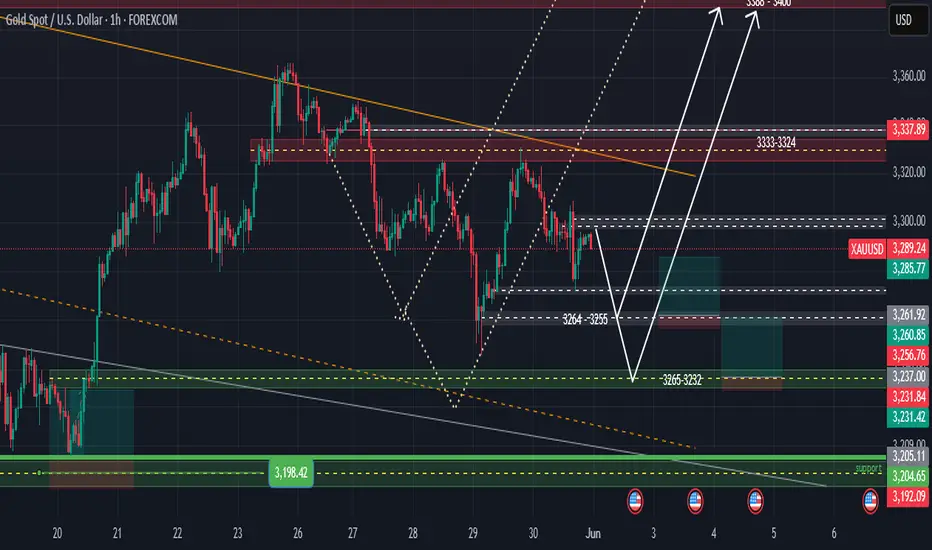
Gold Analysis
Last week's movement so far on the chart moved as expected. To continue this week's path, expect another step to correct to two support areas, first the 3264-3255 range, and if lost to the support area 3265-3232. It can be considered that from one of these two supports, the upward movement for the liquidity above it will continue. The resistance/support areas will change their nature if lost.
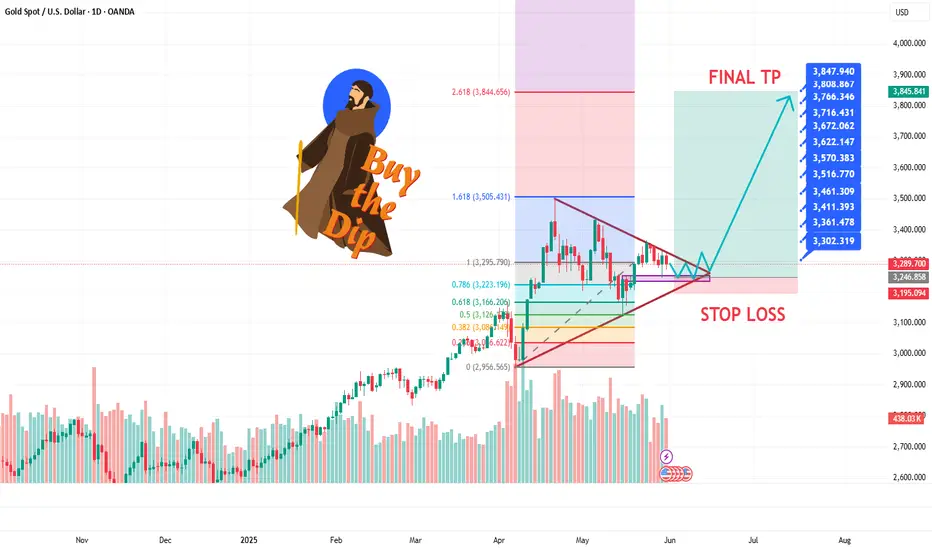
GOLD AND WAR NEXT TO 4K$Hello traders
as i can see gold is trading in a Decending Triangle zone and it had tested Fibo 0.61 ratio in month of may dip as we can see gold close monthly candle above 3280 zone which is a clear sign that big players and banks are still prefer Safe haven we can see US econmey in a bad recession zone unemployment and higher inflation is a big problrm for $ and on all these things Mr. Trump Tariffs is a game changer in commodities markets if we see Geopolitical issues around the world it esculating more war in diffrent regions of the world.. Now Israiel & US have a new biggest problem Iran which is showing us a attack on Iran can be happen incoming days as we can see 6 meetings was unsucessful in Oman for a Deal to Stop Iran's Nucler Enrichment Program which is not good... other then fundamental Charts are crystal clear and showing us a clear view for a New ATH on Gold our Risk reward ratio is prefect for us have a proper research before taking any trade its just an trade idea share your thoughts with us it will help many other traders Comments are open we love your comments and support the channel so it can diliver to many other new traders Stay Tuned for new updates ..
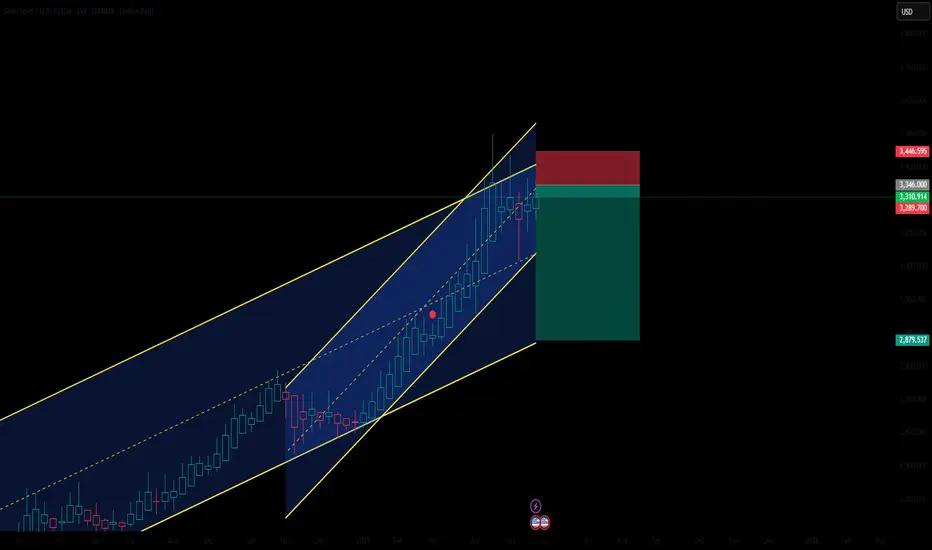
Gold Channel Rejection ZoneGold (XAUUSD) remains in a strong long-term uptrend, respecting a well-defined ascending channel on the weekly timeframe. Price is currently testing the upper boundary of this channel, suggesting potential exhaustion near the resistance zone.
A bearish rejection from this area could trigger a corrective move toward the lower boundary of the channel, aligning with a healthy pullback in an overall bullish structure. The chart also highlights a clear risk-to-reward setup, with a stop loss positioned above the recent highs and a target toward channel support.
As long as price remains below the channel top, downside pressure is likely in the incoming weeks. A confirmed breakout above the channel, however, would invalidate the bearish move and signal continuation of the bullish momentum.
Stop loss: 3443
Take profit: Around 2895 ( EMA 200 Daily )
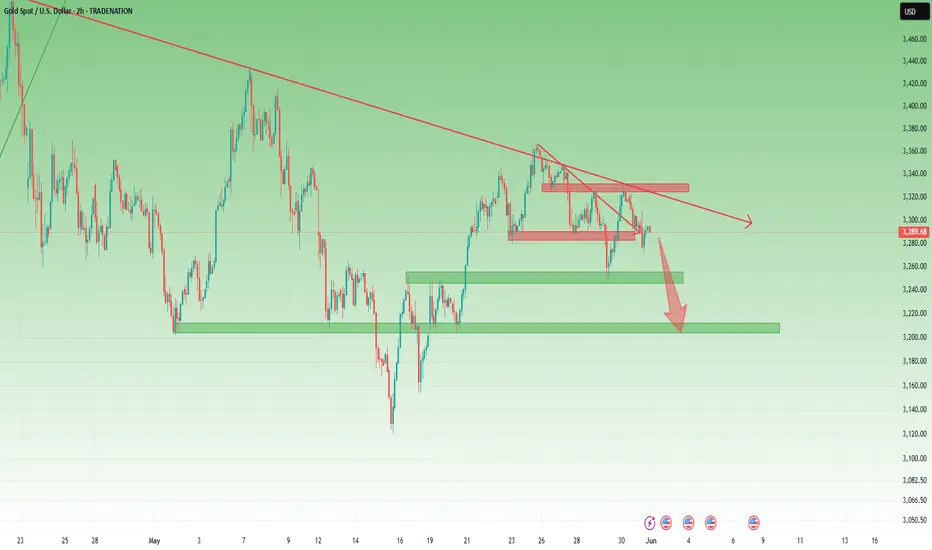
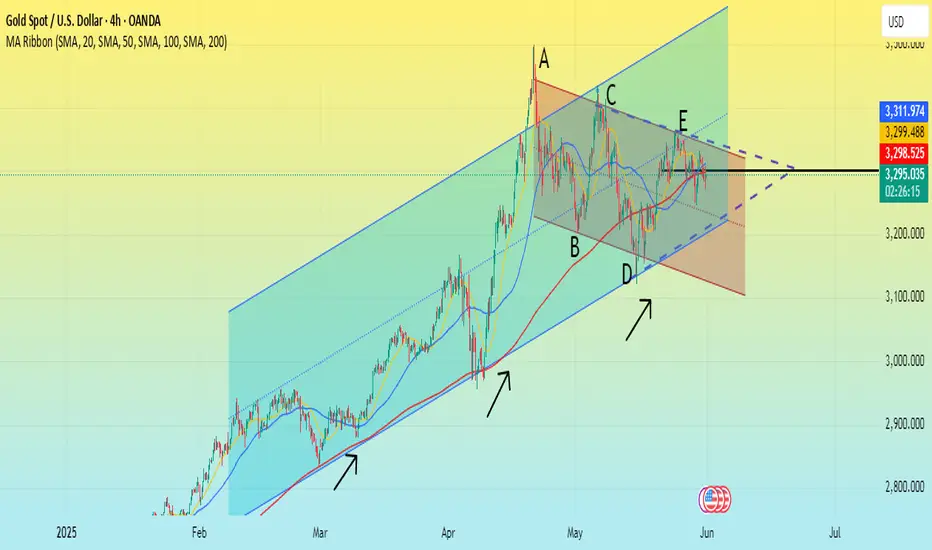
Technical Analysis → Gold will remain stableThroughout May, the news backdrop, including international trade tariffs and geopolitical turmoil, led to a technical peak of around $3,430 and a low near $3,130 in gold. As of now, the price per ounce is stable at around $3,300, roughly the same level as at the beginning of the month.
This shows that supply and demand forces are basically balanced, and prices are maintained between these two extremes. Gold technicals further confirm this and highlight the importance of the $3,300 level.
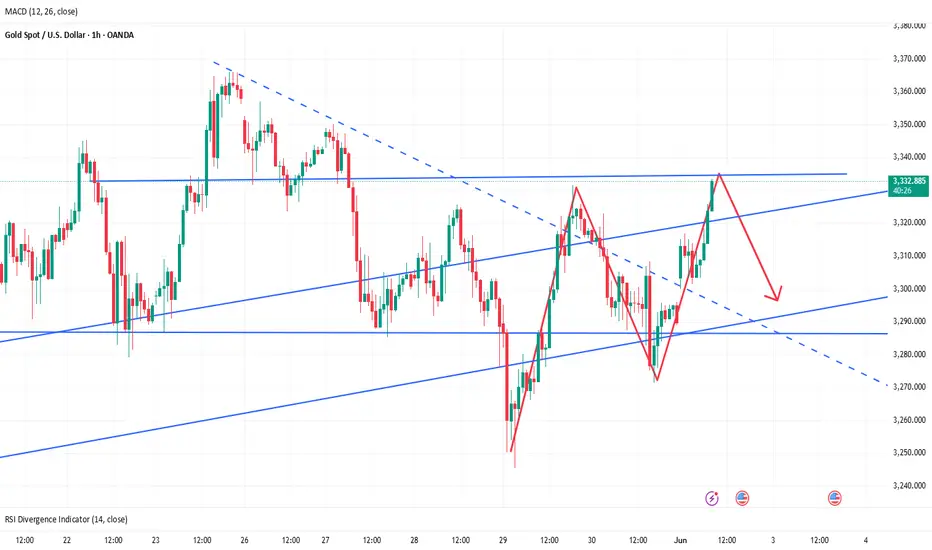
Bearish perspective: The A→B→C→D→E sequence forms a peak high and a cycle low, which is a clear downtrend signal. The trajectory is marked in red, and the upper line constitutes resistance.
Bullish perspective: Since the beginning of 2025, the price of gold has been in an upward trend, represented by the blue channel, and its lower boundary constitutes key support (marked with arrows).
It is worth noting that these support and resistance lines are converging, forming a narrowing triangle. This shows that supply and demand are balancing and the market has reached a consensus around the $3,300 level, which is exactly the central axis of the triangle.
Based on this, we can reasonably assume that the technical side of gold in June may continue to fluctuate within this triangle unless a special event occurs that causes a significant break in the current balance.
5/30 Gold Analysis and Trading SignalsGood morning everyone!
Yesterday, we successfully executed short at 3290 and long at 3250, and also entered the 3316–3328 short zone near the close. All signals were hit, and profits were solid ✅.
📉 Technical Outlook:
The 1-hour chart remains in a clear bearish trend, indicating that this pullback is not yet complete.
Initial support at 3296 is very likely to break
Focus shifts to 3278 support, though it appears technically weak
If price hits 3278, a minor bounce is expected, but it's likely just a retracement, not a reversal
🗞 Fundamental Watch:
The U.S. Consumer Confidence Index will be released during the U.S. session today.
Market reaction is expected to be similar to yesterday’s initial jobless claims — possibly triggering short-term moves, but not changing the broader trend.
📈 Trade Plan for Today:
📉 Sell in the 3316–3328 zone (key resistance)
📈 Buy in the 3238–3221 zone (key support area)
🔁 Scalp/flexible trading zones:
3303 / 3288 / 3276 / 3265 / 3252 / 3238
Stick to proper risk management, and stay alert during U.S. data releases.
Trade with the trend and close the week strong!
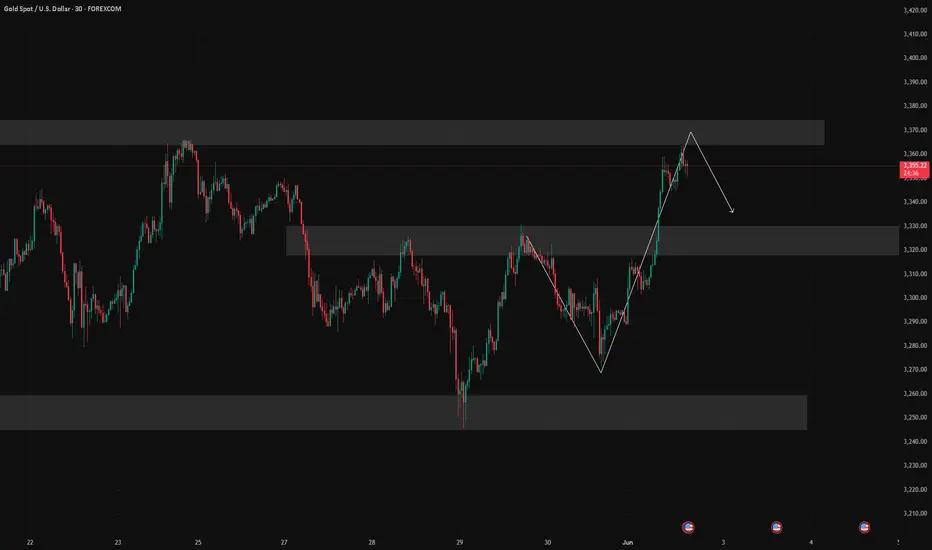
Additionally, on the 30-minute chart, gold appears to be forming a potential inverse head and shoulders pattern. If this pattern completes and breaks the neckline successfully, the price may surge toward the 3336–3352 area, or even up to 3360.
For those considering short positions, it’s crucial to control position size and avoid entering too early. Try to wait for price action to reach higher resistance levels before making a move. Don’t worry about missing a perfect entry — even if one trade is missed, it won’t affect your overall profitability for the week.
The market always offers opportunities. Stay calm, stick to your strategy, and remember: consistency and patience lead to long-term success.
