5/19 Gold Trading Signals🔍 Market Overview:
Last Friday, gold prices entered the 3176–3148 buy zone, and after the market opened today, prices rose to 3249, yielding substantial profits.
From a technical perspective, the overall trend is still under the pressure of a double-top pattern. In the short term, price action remains in a range, but the lows are gradually rising. However, indicators are not yet favorable for bulls. In this case, if the bulls want to take control, then the support at 3182–3176 becomes extremely important during any pullback.
🗞️ News Background:
Trump’s tax cut bill has been approved by a key committee in the U.S. House of Representatives.
👉 This week, further progress must be closely monitored as it directly impacts gold's safe-haven demand.
If trade tensions flare up again, gold is likely to rise sharply due to renewed safe-haven demand.
If tensions continue to ease, downward pressure on gold will likely increase.
Also, watch out for any comments on monetary policy — if rate cut expectations increase, gold could face additional downside risk.
📈 Today’s Trading Strategy:
🟢 Buy Zone: 3196 – 3176
🔴 Sell Zone: 3293 – 3318
🔄 Scalp/Flexible Trading Zones:
3188-3209-3236-3252-3269-3282
Xauusdsignal
Gold is rising strongly? Beware of a sharp rise to the high poinThe US sovereign credit rating was downgraded from AAA to Aa1; affected by this, gold opened sharply higher in the Asian market on Monday, and the highest so far is around 3250.
However, 3250 is not the high point at present, and it is only warming up in the Asian market. The important thing should be in the European and American markets. Such a major breaking news must be seen in the US stock market.
If gold can continue to rush above 3250 in the short term, then we will see 3280-3300 later. It is not ruled out that the Asian market will continue to fluctuate sideways in the short term, but I think it will still rise. The high point of 3250 may be broken at any time.
From the 4-hour chart:
This K line is very strong. Once this K line closes above 3230, the highest high point can be seen from the 4-hour chart here.
Judging from the current trend, I think the gold price is bullish as long as it is above 3200 in the Asian market. The lowest price in the Asian market in the morning retreated to around 3210, so it is not known whether it will retreat to around 3200.
Then, for the short-term strategy, you can go long around 3210, with 3200 as the stop loss position. As long as the upper target stands at 3250, you can continue to see the profit range of 3280-3300.

GOLD set for another drop?As expected in our previous analysis XAUUSD bounced to daily resistance and started to get rejected with a strong momentum in the major direction of the trend. As we see series of lower high formation XAUUSD may continue to drop to daily support level following the long term trend.

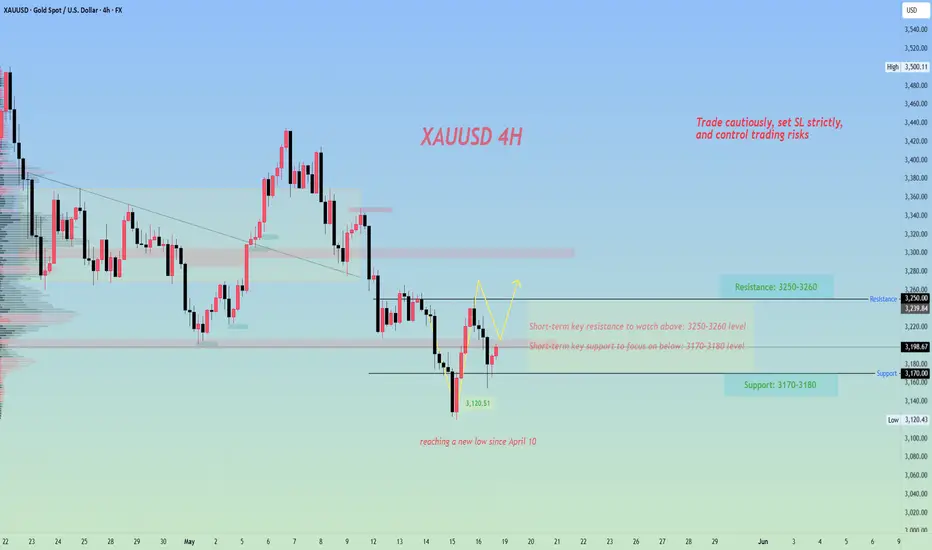
Gold Market Analysis for Next WeekLast Friday's chart analysis was highly consistent with the market trend, and satisfactory results were achieved in trading.👉👉👉
Based on the 4-hour trend analysis, for the opening of gold on Monday, we will first focus on the short-term resistance at the 3,224-3,230 level, and the key resistance at the 3,253-3,260 level. Below, we will pay attention to the short-term support at the 3,170-3,175 level. The operational suggestion is to focus on shorting on rebounds.
XAUUSD trading strategy
sell @ 3230 - 3240
sl 3260
tp 3215 - 3220
If you think the analysis helpful, you can give a thumbs-up to show your support. If you have different opinions, you can leave your thoughts in the comments. Thank you for reading!👉👉👉

Gold Market Summary for Last WeekLast Friday's chart analysis was highly consistent with the market trend, and satisfactory results were achieved in trading.👉👉👉
On Friday, the international gold price fell, potentially recording its largest single-week decline in six months. This trend is mainly attributed to the strengthening of the U.S. dollar and the easing of concerns about the China-U.S. trade war, which together weakened gold's appeal as a safe-haven asset. Gold prices plummeted by more than 2% at one point on Friday, with a cumulative decline of nearly 4% this week—largely driven by increased risk appetite brought about by the trade agreement—marking the largest single-week drop since last November.
The mitigation of the trade war has led to a rebound in risk appetite across the market. This shift has prompted futures traders to take profits, particularly in the gold market, triggering a week-long wave of position liquidation. Gold has faced pressure in recent weeks as the market has ruled out stagflation expectations and repriced rate-cut expectations. Currently, the market expects the Federal Reserve to cut interest rates by approximately 58 basis points by the end of the year, compared to 120 basis points at the peak of panic in April. However, in the short term, the repricing of rate-cut expectations may exert pressure on gold.
XAUUSD trading strategy
sell @ 3230 - 3240
sl 3260
tp 3215 - 3220
If you think the analysis helpful, you can give a thumbs-up to show your support. If you have different opinions, you can leave your thoughts in the comments. Thank you for reading!👉👉👉
XAUUSD forecast for this week (19th May 2025)Recent candlestick patterns, coupled with supportive evidence from technical indicators (RSI, ADX, parabolic SAR), underscore that XAUUSD has transitioned into a corrective phase after peaking near $3,500. Major catalysts over the past week—including the U.S.–China 90-day tariff pause, softer U.S. inflation data (CPI, PPI), and strong dollar moves—have eroded safe-haven flows, pushing gold into a short-term descending channel. While Asian physical demand around $3,120–$3,200 provides intermittent support, the likelihood of dipping back into the $3,100–$3,150 zone remains high.
Support & Resistance levels for tomorrow (19th May 2025):
$3,265–3,275 Resistance 2
$3,250 Resistance 1
$3,150–3,160 support 1
$3,120 support 2
I am expecting a continuation of the modest bearish bias into the upcoming Asian session, there is a 60% probability to a bearish continuation and 40% to a bullish rebound. Traders should monitor the $3,150-3160 support area closely—any decisive break below there could open the path toward $3,120 and ultimately $3,000
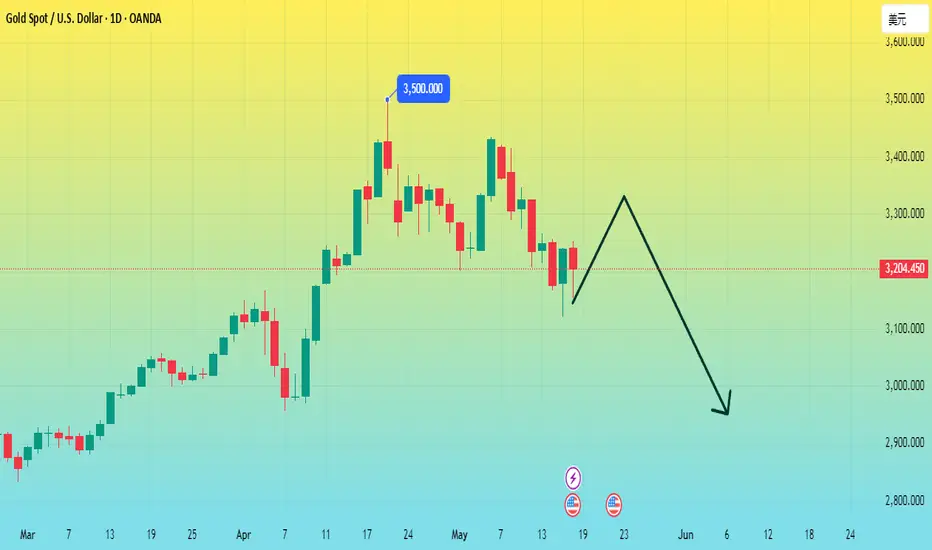
Moody's downgrades US credit rating, will gold be affected?Information summary:
At about 4:43 pm on Friday (the last minute before the market closed), Moody's downgraded the US sovereign credit rating from AAA to Aa1 on the grounds of "surge in debt and fiscal out of control", ending the US's last "top credit" title among the three major rating agencies.
Perhaps considering reducing the impact, Moody's announced this news after the US stock market closed. But at this time, gold, foreign exchange and other markets still have more than ten minutes of trading time. The 10-year US Treasury yield once rushed from 4.44% to 4.49%, the US dollar index fell, and gold rushed up.
The downgrade is a super-class data, which may cause gold to rebound in stages, but not continuously. If nothing unexpected happens, after the adjustment, gold may continue to retreat in a trend.
Technical analysis:
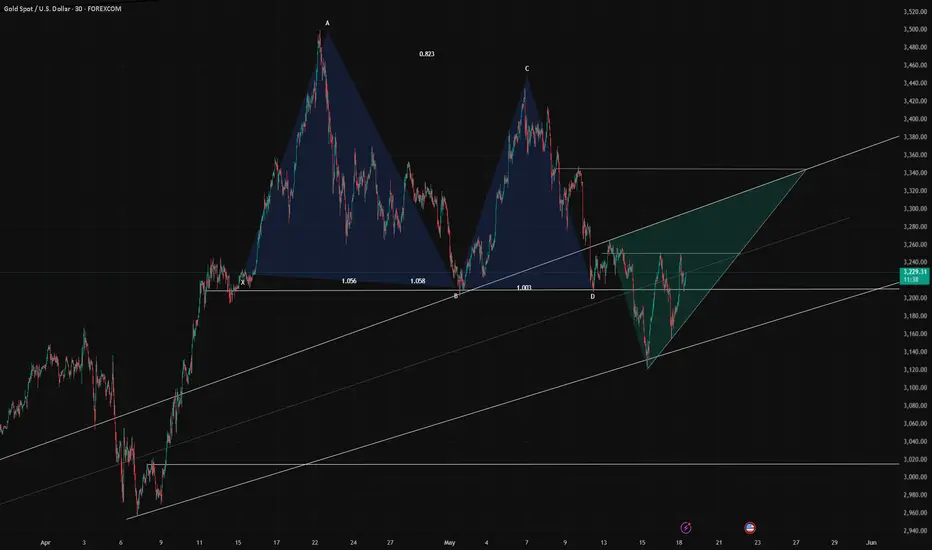
Next week, gold may rebound in stages to 3330-3340. Then there may be a trend decline again, and I estimate that it may test around 2950 below. As for why it went to 3330-40, here is an analysis:
I think the current gold trend is very similar to the holiday trend in Asia from May 1st to 5th. It also fell sharply, then bottomed out and rebounded, and then stretched up again. I also drew it in the picture, which is basically consistent with the current trend. If the next market trend is copied from the previous paragraph, then I think it should test the 3330-40 point.
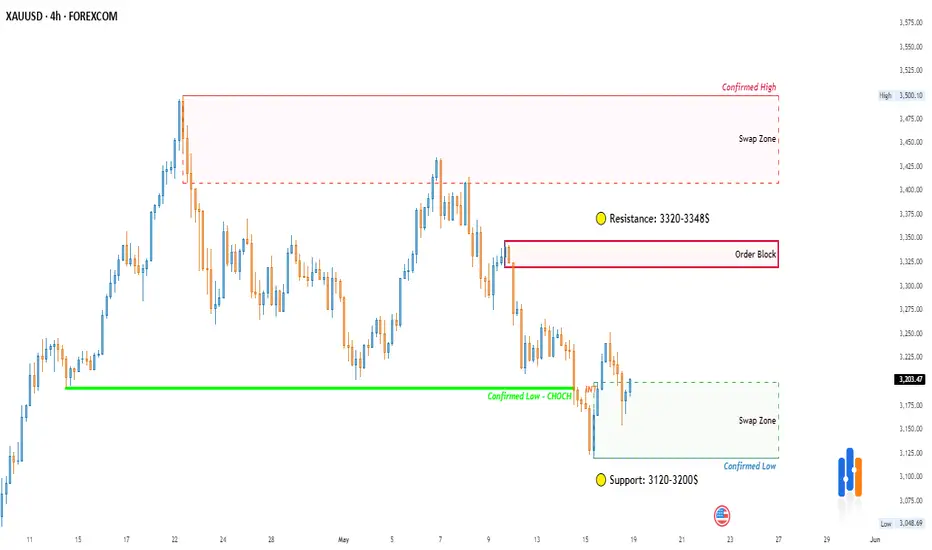
gold(4H)📌 Gold (XAU/USD) - Key 4H Levels
🔍 Critical Zones:
▫️ Resistance: 3320-3348$
▫️ Support: 3120$
▫️ Trend: Bullish above 3120$
⚡️ Trade Plan:
• Entry: 3120-3200$
• Target: 3320$ | SL: 3120$
• Risk: ≤1% capital
💬 Poll:
"Which scenario is likely?
1) Break 3348$
2) Reject at 3320$
Reply ↓"
Xauusd down trendTye xauusd has been on a downtrend this week. It will probably continue and it has a pull down on Friday before the market close. It will continue on a downtren definitely.
Take profit is at 3121.27
XAUUSD[GOLD]; Is it the beginning of the major correction? XAUUSD dropped from 3265$ to 3127$, as predicted in our previous analysis. However, after touching 3127$, the price has retraced slightly and is currently trading at 3178$. In our opinion, the price can go up to $3220 maximum and reject at that level. We need to wait and see how prices behave. Another possible entry point is at 3178$, which is the current trading price. We believe this region is good for selling because the price has struggled to break through it. Please use a proper trading plan while trading gold.
As always, this analysis doesn’t guarantee that price will move as described in the chart. Please use your own knowledge and trading plan while trading gold. Good luck and trade safely.
Want to support us? Do the following ❤️
-LIKE THE IDEA
-COMMENT YOUR VIEW
-SHARE IF YOU AGREE
Much love ❤️
Team Setupsfx_

GOLD H4 Weekly Chart Update For 19 - 23 May 25As you can see that GOLD H4 for weekly term
First of all note all mentioned levels Carefully, right now market just close above 3200 psychological level
2 upside GAPS remains in focus for now
1st one around 3330-3340
2nd one is 3430
so keep in mind overall trend is remains bullish for now on senior timeframes

XAUUSD FLAG BULLISH PATTERN (HIGHER HIGH) ANLYSISThe XAUUSD Market momentum has made a flag bullish pattern showing the strong uptrend had the confirm targets at different zones.
1st Target Zone 3260
Final Target Zone 3350
resistance level: 3100
Conclusion: If the market momentum moves towards target then hold on your trades but if the market moves against to the target then there is an option of stop loss point active and all the trades should be closed.
Gold Sell to 3080? Gold just broke the channel.
There is a potential bearish move to 3080 and if that breaks, 3050
Long orders are trapped,what should we do with the US gold marke🗞News side:
1. India considers using new Indus River project to cut water supply to Pakistan.
2. Pay attention to the news of Russia-Ukraine ceasefire negotiations today
📈Technical aspects:
Gold once fell to around 3170, which is in line with our judgment of bullish weakness. This is why we are not in a hurry to participate in long orders today. I know that many bros also listened to the outside world and went long around 3200, which led to being trapped. At present, the gold price is constantly testing the 3170 support line. If it falls below, it will look to the 3150 support line. If it does not break, it will be treated as a shock. On the top, temporarily pay attention to the 3205-3215 line of resistance. If it encounters resistance and pressure, go short. On the bottom, first pay attention to the 3170 support line, and then pay attention to the 3150-3140 support line. Hold if it breaks.
If you agree with this view, or have a better idea, please leave a message in the comment area. I look forward to hearing different voices.
OANDA:XAUUSD FX:XAUUSD TVC:GOLD FXOPEN:XAUUSD FOREXCOM:XAUUSD

"Buy Setup @3202 – Layered Entry with Smart Risk Management"Buy @3202
🎯 Targets:
TP1 – 3215
TP2 – 3229
TP3 – 3255
TP4 – 3283
🛑 Stop Loss: 3186
✅ Enter in Layers
✅ Follow Proper Money Management
✅ No Over-Leverage – Stick to the Plan

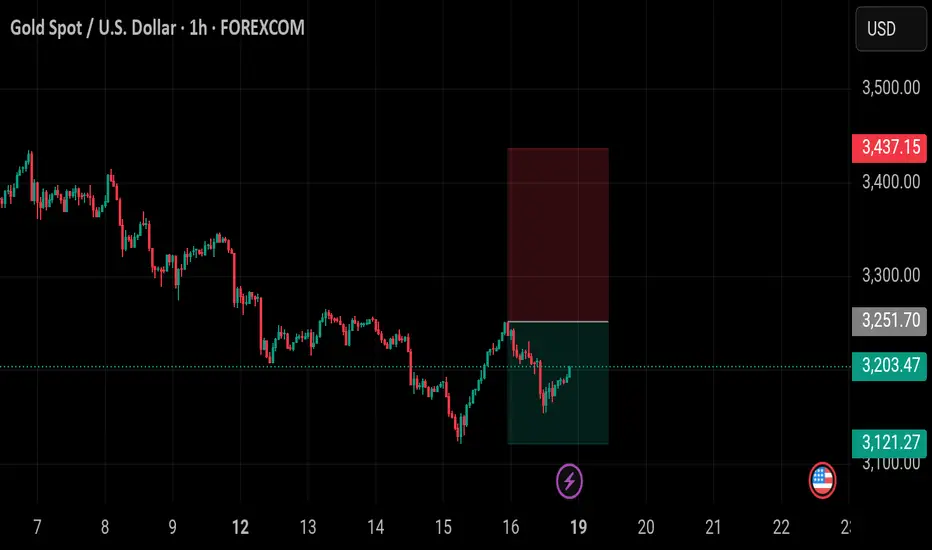
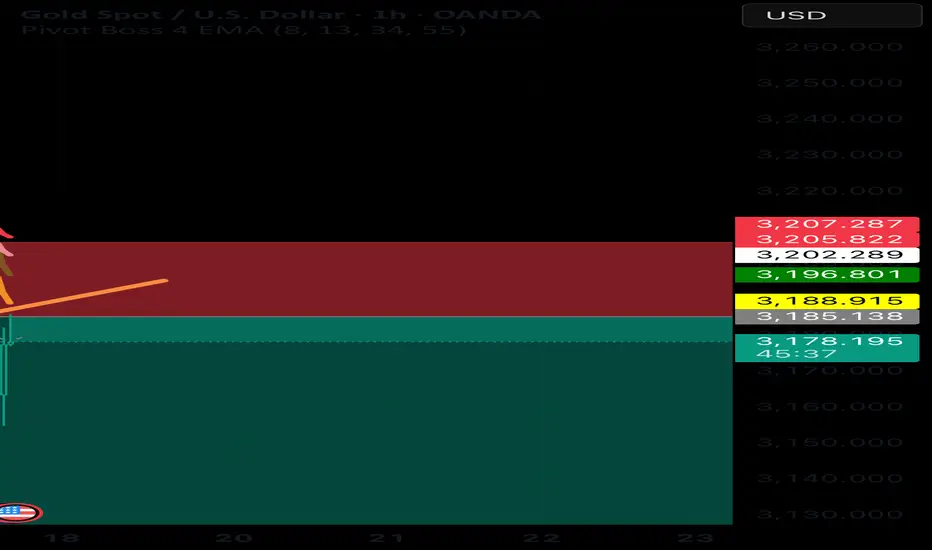
GOLD Update – Short Opportunity After Pullback! Gold traders! 💛 Our key support zone (3,212 - 3,196) has just been broken, and price is now consolidating below! 🎯
We previously took big profits from this level (our followers know!), and now we’re waiting for a pullback to enter a high-probability short trade!
⚡️ Golden Rule:
✅ If price retests the level as new resistance, go SHORT!
✅ If it reverses and breaks back above, consider a LONG!
📌 Always trade with a strategy—be ready for any scenario!
💸 The Secret to Trading Success:
🔹 Keep losses small & controlled.
🔹 Let profits run & grow!
🔹 We can’t control the market, but we CAN control our risk!
🚀 Gold is always hot—what’s your take?
👇 What’s your analysis on this move?
For detailed entry points, trade management, and high-probability setups, follow the channel:
ForexCSP

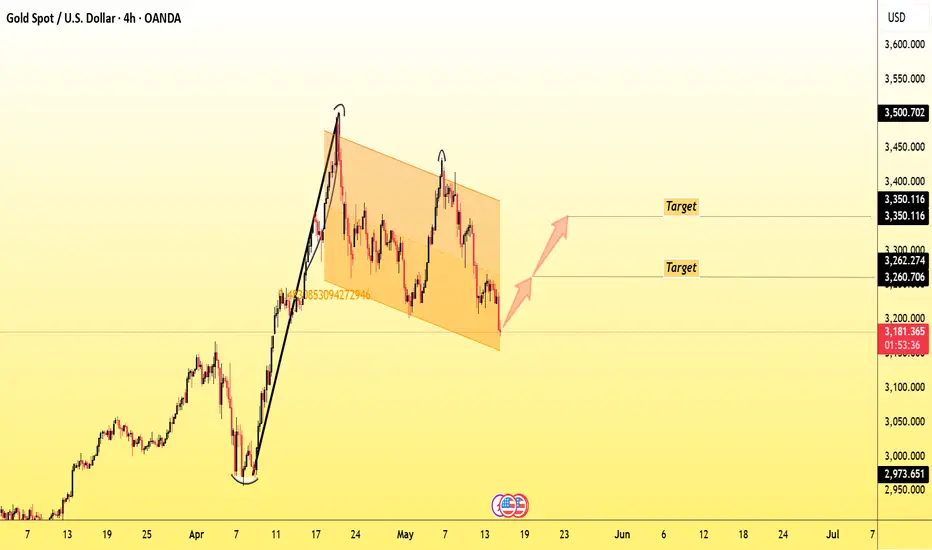
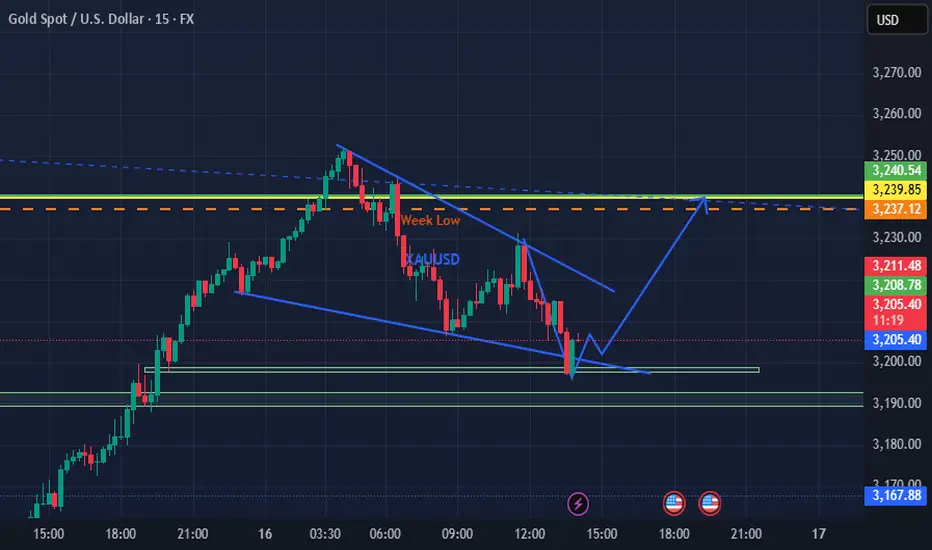
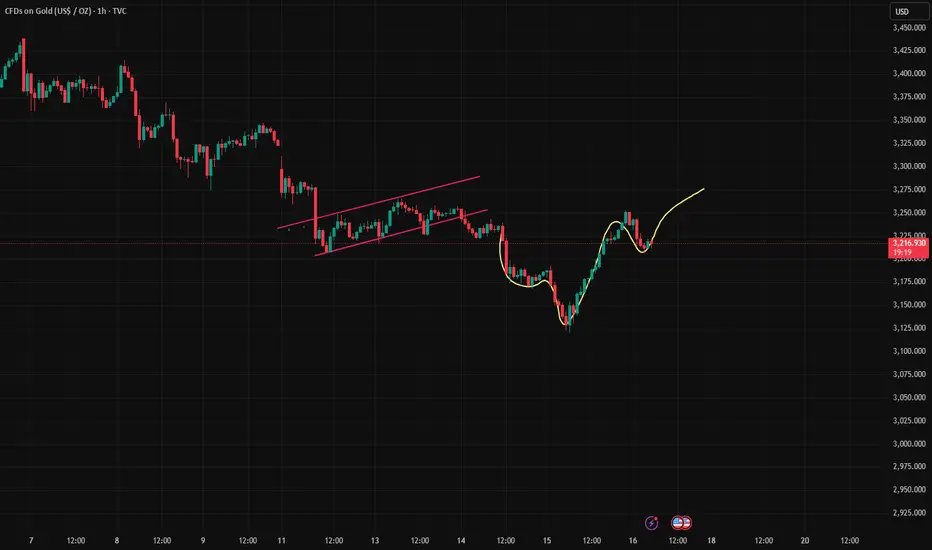
Gold Bullish Outlook - Gold BullishFollowing strong buying momentum observed yesterday, gold is currently consolidating within a falling wedge pattern — a typically bullish setup. A breakout from this pattern could trigger a fresh upward move in the price of gold.
Post-Breakout Bullish Targets:
Target 1: 3230
Target 2: 3240
Target 3: 3250
Target 4: 3275
Disclaimer: This is a technical analysis-based outlook. Please assess your risk-to-reward ratio and follow your individual trading strategy. This is not financial advice — trade responsibly and according to your plan.
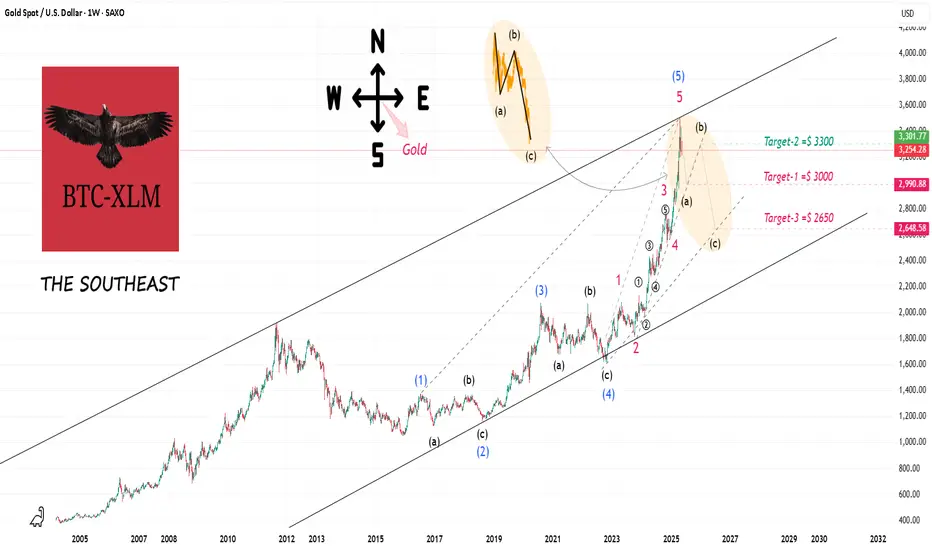
THE SOUTHEASTEveryone would sell out and go,
everyone who counts.
Technical Section:
ABC bear market (the price of gold must come down)
Target-1 =$ 3000
Target-2 =$ 3300
Target-3 =$ 2650
We shall see.
The focus of gold today is 3200!News:
The US economic data in April was weak across the board, with the producer price index (PPI) unexpectedly falling by 0.5%, retail sales growth plummeting to 0.1%, and manufacturing output falling by 0.4%, which severely hit the market's confidence in the US economy. Affected by this, the US bond market fluctuated violently, with the 10-year US bond yield plummeting by 11 basis points and the 2-year yield plummeting by 9.2 basis points; the US dollar index fell by 0.2%, and the real interest rate fell. At the same time, geopolitical risks continue to heat up. The Russia-Ukraine peace talks have reached a deadlock, Putin refused to meet with Zelensky, and the Iran nuclear agreement negotiations have not progressed smoothly. Against this background, the safe-haven attribute of gold has been highlighted, and market attention has increased significantly. Looking ahead to this trading day, a number of important US economic data will be released soon, and the progress of the Russia-Ukraine talks and Trump's dynamics are also attracting much attention. These factors will continue to affect market trends.
Technical aspect: From the perspective of the daily line, gold can no longer be regarded as a unilateral decline after yesterday's bottoming out and rebounding. It should be directly followed by the idea of oscillation! The primary focus today is still the position of the dividing line of 3200.
Trading idea: Go long if it doesn’t break around 3200, sl3190, target 3230
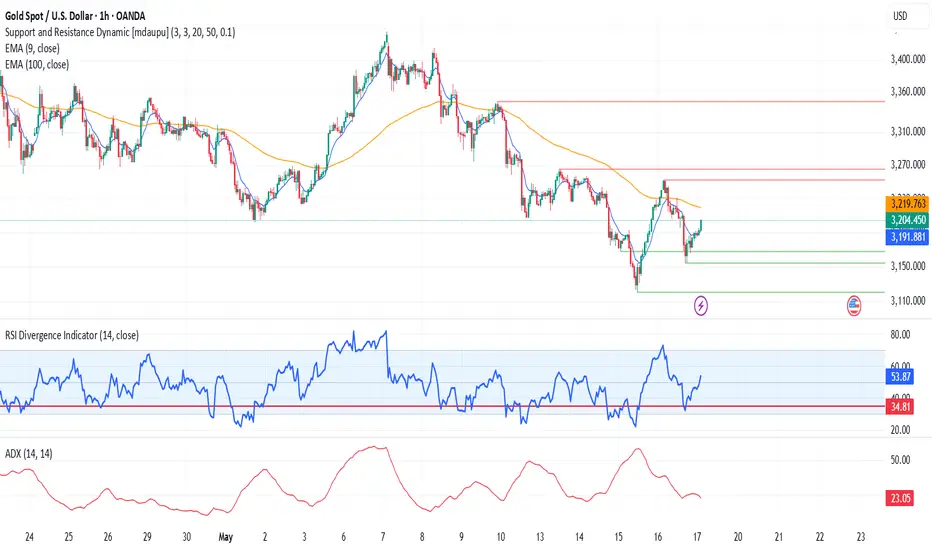
Gold has a strong deep V, 3200 support is good for longThe 1-hour moving average of gold begins to turn and continue, so the momentum of gold bears begins to weaken, and gold bulls may begin to exert their strength. However, gold started to rise all the way from 3120 to 3252 yesterday. Gold rose by about 130 points, so the volatility began to increase. Therefore, we must wait patiently for gold to adjust. Because of such a large fluctuation, an adjustment will also be tens of dollars. We must wait patiently for the adjustment and stabilize before going long. After gold breaks through 3192, it is considered a strong deep V breakthrough of important resistance. Then 3192 of gold has now become an important support level. If it falls back to 3192 in the Asian session, go long on dips. If gold falls back to near the 3200 mark, you can try to go long.
Since gold has started to reverse strongly, gold bulls have begun to show their muscles. In the short term, we should not be stubbornly bearish anymore. We should be flexible and adapt to the market. The market is like this, changing rapidly. We should adapt to the market and not be too obsessed with bears or bulls. Obsession is a trap. Gold bulls are strong now, so gold is now the home of bulls. Go long when the Asian session falls back.

5/16 Gold Trading Signals
🌇Good afternoon, everyone!
Gold made a strong one-way rally from 3120 to above 3200 yesterday, perfectly achieving our bullish target with substantial profits.
Today, after a slight uptick at the open, gold started to pull back and enter a consolidation phase. Technically, this is a normal correction after a $120 surge. However, the key question now is:
🔍 Is this just a healthy pullback, or a bearish continuation pattern?
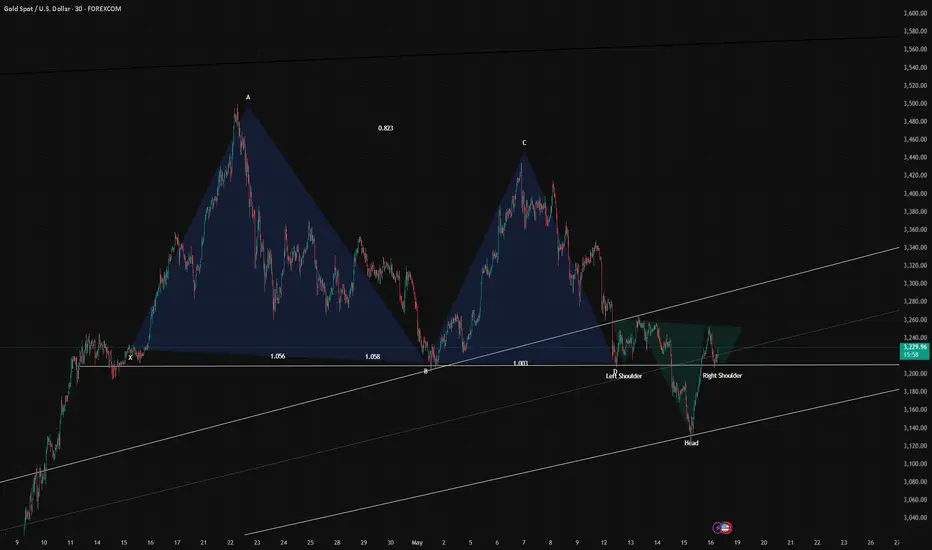
There’s some uncertainty in the current structure:
On the larger scale, the market still appears to be forming a double top.
On the shorter-term, this week’s pattern resembles a head and shoulders bottom, and price is now testing the neckline zone.
🧭 So, while the direction remains unclear, we can still identify key trading zones to act on.
🗞 News Watch:
Several important U.S. data releases are scheduled during the New York session. They may provide crucial directional signals for gold.
📌 Today’s Gold Trading Strategy:
🟢 Buy Zone: 3176 – 3148
🔴 Sell Zone: 3265 – 3287
🔄 Flexible Trading Zones (watch for reversals or breakout plays):
▫️3187-3198-3209-3237-3258-3267
✅ Reminder: With the structure being complex and direction unclear, avoid aggressive positioning. Focus on scalp or short-term trades near key zones and react to market post-data.
Latest trading opportunities for XAUUSD.The market went to the target position smoothly as expected.
Due to the sharp decline this week, there was a huge rebound in technical demand on Thursday. The highest broke through 3175/3200/3250. There were some pullbacks in the Asian market. So what positions should we pay attention to now? How to trade?
From the news side. The results of today's meeting between Russia and Ukraine are very important. The delay of one day in yesterday's negotiations has increased geopolitical uncertainty again. This is the biggest black swan event and the factor affecting the rise of XAUUSD. Before the results are announced today. There are still uncertain factors, which are the support for the decline of XAUUSD. However. If the results of the meeting are announced on the news side, then XUAUSD will have a corresponding response in the market. Then we can naturally choose the direction of trading.
Two results. Stop or extend the truce, then XAUUSD will fall further. If no agreement is successfully reached, then it is an opportunity to buy. So the impact of today's news results is very large. It needs to be paid attention to.
The basic data needs to pay attention to the support of 3200. Maintain the principle of long.
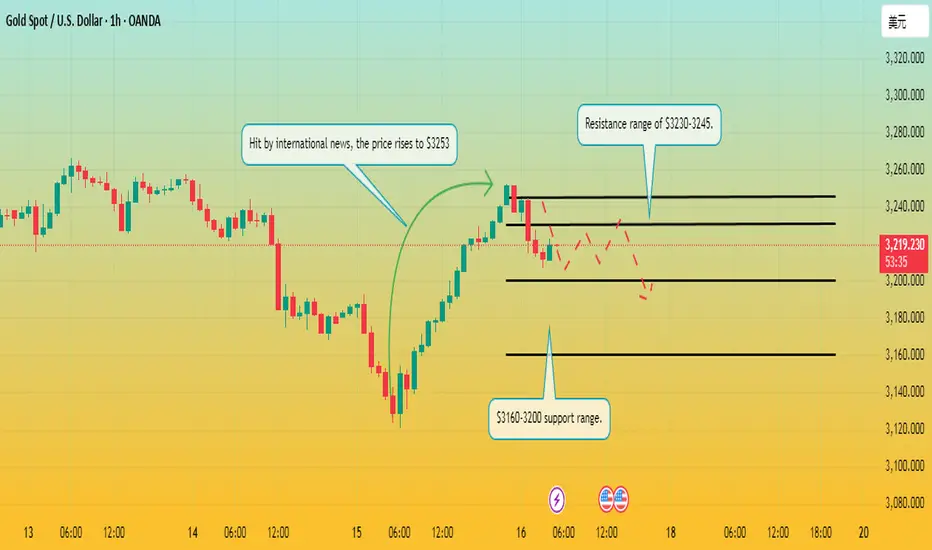
Gold price rises and then sells off?Information summary:
Yesterday morning, gold prices soared due to the impact of international news, hitting an intraday high of $3,253.
On Friday, Asian time, gold suddenly fell rapidly in the short term, and the price of gold currently fell to around $3,215/ounce, a sharp drop of nearly $28 in the day.
Gold price targets higher, but the bullish potential is limited in the short term. The focus will be on the preliminary value of the University of Michigan Consumer Confidence Index in May.
Technical analysis:
Looking at the daily chart, gold prices rose on Thursday, but both the high and low points of the day moved down from the previous trading day. On the other hand, the 20-day moving average eased down to around $3,305/ounce, while the 100-day and 200-day moving averages maintained an upward tilt at a level far below the current gold price. Finally, the trend of technical indicators is upward, but it is still below the previous intraday high and in the negative range, which shows that buyer sentiment is not very high.
The short-term trend shows that gold buyers still lack full confidence.
You need to pay attention to the important support and resistance levels:
Support level: $3,200; $3,175; $3,160.
Resistance level: $3,230; $3,245.
Operation strategy:
Buy around $3,200, stop loss at $3,190, and profit range at $3,250-3,280.