GoldXau usd daily analysis
Time frame 4 hours
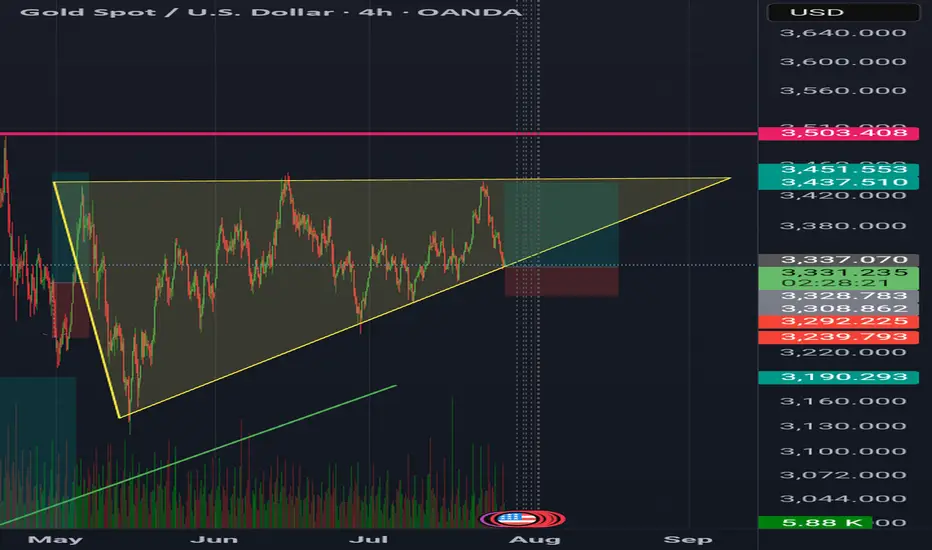
Gold is moving up and down in the yellow triangle, you can see on the chart
I think Gold move up to 3450 $ and if we have no positive news, it will drop to the down side. This analysis has good benefit and Risk rewards ratio is 3
On the other hand if Gold break the 3320 $ my analysis is faild and must listen to the economic news
Xauusdsignal
XAUUSD Analysis TodayHello traders, this is a complete multiple timeframe analysis of this pair. We see could find significant trading opportunities as per analysis upon price action confirmation we may take this trade. Smash the like button if you find value in this analysis and drop a comment if you have any questions or let me know which pair to cover in my next analysis

Gold is weak. It may break through next week.This week, gold rose and fell, rising for two consecutive days on Monday and Tuesday, and falling for three consecutive days from Wednesday to Friday. The weekly line finally closed with a small real body negative line with a long upper shadow.
Gold's trend this week was due to the strengthening of the US dollar and the progress in US-EU trade negotiations, which hit the safe-haven demand, leading to a decline in gold prices.
Next week, focus on multiple time points that may trigger market trends, including the Federal Reserve's decision, non-agricultural data, the August 1 tariff deadline, and the economic and trade talks between Chinese representatives in Sweden and the United States. These events may set the tone for the market in the second half of the year and need to be paid attention to.
At the beginning of this week, we focused on the triangular convergence pattern formed by the high and low points since 3500 points. On Tuesday, gold broke through the pattern upward, but failed to stand firm on Wednesday. Instead, it fell to form a false breakthrough, and on Friday it fell to the lower edge of the triangular convergence range. However, from the perspective of the international futures market, the overall situation is still in the triangular convergence pattern and has not achieved an effective upward breakthrough. Based on this, we need to continue to keep a close eye on the changes in the triangle convergence pattern next week. The direction of its next breakthrough will have an important impact on the short-term trend.
Operation strategy:
Short near 3350, stop loss 3360, profit range 3320-3315. If the price continues to fall, you can hold a small position, and the area near 3300 is likely to be touched.

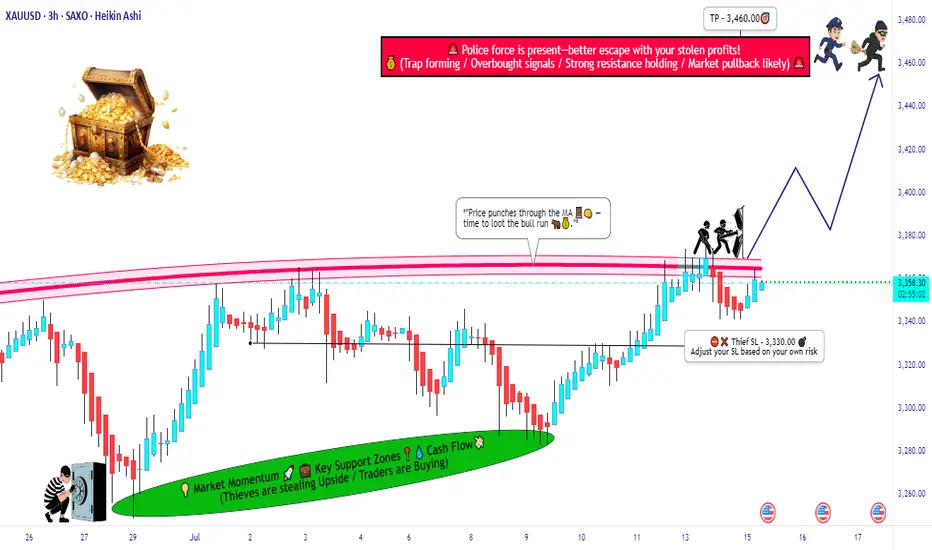
XAU/USD Breakout Playbook – Rob the Market!🚨💰 GOLD HEIST IN MOTION! | XAU/USD Thief Trading Strategy (Breakout Edition) 🏴☠️
🧠 Strategic Mindset | Not Your Average Chart Talk
Yo Market Bandits & Pip Hunters – welcome to the underground playbook!
This isn't your grandma’s chart breakdown – it’s a Thief Trading Takedown on XAU/USD (Gold), where we’re not chasing the market… we’re outsmarting it.
THE MASTER PLAN: Enter Like a Ghost, Exit Like a King 👑
📍 ENTRY POINT – The Break-In Begins!
💥 Breakout Level: Watch for 3370.00 resistance to crack – this is our green light.
🕵️♂️ Entry Style:
• Buy Stop above MA resistance zone (fast & clean)
• OR Buy Limit near swing low zones after confirmation pullback (sniper entry)
🧠 Thief Tip: Wait for the breakout to happen. No orders, no SL before it. Patience is profit.
🔄 Layer the Entry:
• Deploy DCA (Dollar Cost Averaging) or scaling entries with precision
• Build positions like stacking cash bags — smart, silent, and calculated
🛡️ PROTECT THE LOOT – Stop Loss Logic 💣
📍 SL Guide: 3310.00 (4H swing low – update as price structure evolves)
🔥 SL ONLY comes after breakout. Set it too early? That’s how you get caught.
⛔ No pre-breakout orders. No early SL. Stay invisible till it's go time.
🎯 THE ESCAPE – Profit Like a Phantom 🚀
💸 Take Profit: 3450.00
📉 Scalpers: Trail SL as price pushes – never give back stolen pips
🌀 Swing Traders: Monitor resistance layers – don’t let the bulls turn on you
🧭 CONTEXT – Why This Setup?
🔍 Macro Snapshot:
• Trend: Neutral/Bullish Lean
• Influencers: COT reports, geopolitical tension, dollar flows
• Sentiment Shifting – watch the herd, but don’t run with it
🗞️ News Risk: Don’t get wrecked by events! Avoid entries during high-impact news.
🚨 Trailing SL is your best weapon during volatility.
⚡ POWER UP THE CREW – Support the Movement
💬 Drop a comment, hit the 🔥 like button, and share with your trading gang
More Thief Trading blueprints coming soon – bigger breakouts, cleaner setups
⚠️ STAY SHARP, THIEVES!
This ain't financial advice – it’s an outlaw’s edge on the market.
Trade smart. Risk well. Protect the bag.
🏴☠️ XAU/USD GOLD HEIST IN PROGRESS... Join the Movement. Let’s Rob the Market.
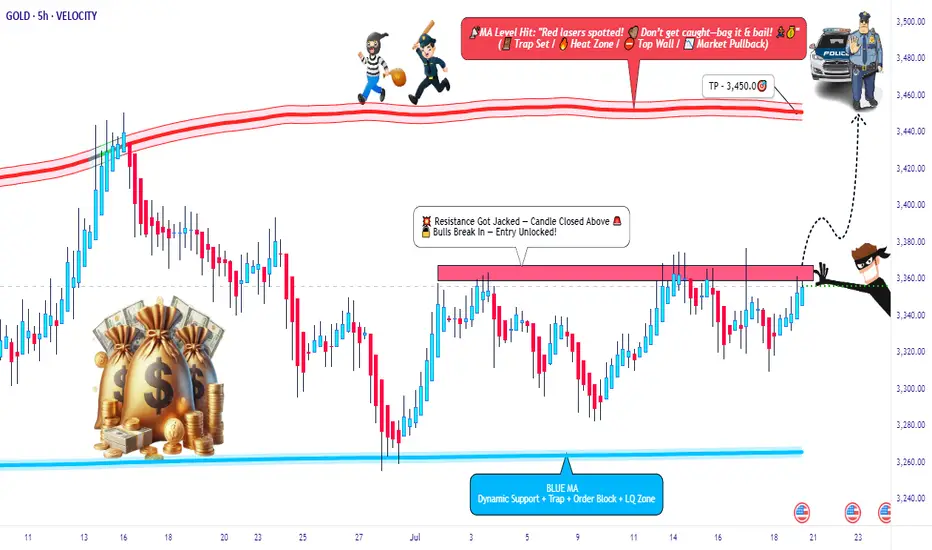
GOLD (XAU/USD) MA Breakout – High-Probability Long Setup!💰🚨 GOLD HEIST ALERT! XAU/USD MASTER PLAN (Thief Trading Style) 🎯
🔥 Steal Pips Like a Pro – High-Probability Gold Breakout Strategy! 🔥
🎯 Thief Trading’s GOLD Heist Strategy (Swing/Day Trade) �💸
👋 Hey there, Market Pirates & Profit Snatchers! 🌍✨
Based on our 🔥Thief Trading Style🔥 analysis, we’re plotting a major heist on XAU/USD (GOLD). The plan? Buy the breakout, escape before the cops (resistance) arrive! 🚔💨
📈 ENTRY ZONE: The Heist Begins!
🚀 "Wait for the MA Breakout (3400) – Then Strike!"
Bullish Confirmation: Enter on a 15M/30M pullback after MA breakout.
Thief’s Trick: Use Buy Stop above MA or Buy Limit near swing lows for best risk-reward.
DCA/Layering Strategy: Deploy multiple limit orders to maximize gains.
🔔 Set an ALERT! Don’t miss the breakout – thieves move fast! ⏳
🛑 STOP LOSS: Protect Your Loot!
📍 Thief’s SL Placement: 3330.00 (4H Swing Low) – Adjust based on your risk & lot size.
⚠️ WARNING: If using Buy Stop, DO NOT set SL until after breakout – unless you love unnecessary losses! 🔥
🎯 TARGET: Escape with the Gold!
🏴☠️ Take Profit Zone: 3460.00 (or Exit Early if Bears Show Up!)
Scalpers: Only trade LONG side – use trailing SL to lock in profits.
Swing Traders: Ride the wave but watch for resistance traps!
📰 MARKET CONTEXT: Why This Heist?
Neutral Trend (But Bullish Potential! 🐂)
Key Factors: Geopolitics, COT Data, Macro Trends, Sentiment Shift
🚨 News Alert: Avoid new trades during high-impact news – trailing SL saves profits!
💥 BOOST THIS HEIST! (Like & Share for More Pips!)
💖 Hit the 👍 Boost Button to strengthen our Thief Trading Crew!
🚀 More Heist Plans Coming Soon – Stay Tuned!
⚠️ DISCLAIMER (Stay Safe, Thieves!)
This is NOT financial advice. Do your own analysis & manage risk.
Markets change fast! Adapt or get caught.
🎯 Happy Trading, Pirates! Let’s Steal Some Gold! 🏴☠️💛
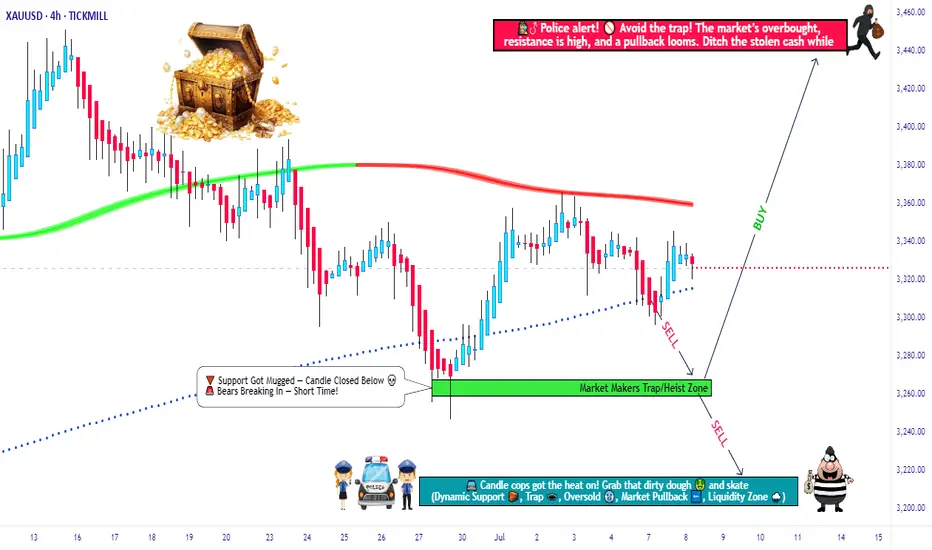
"GOLD Bandit Strategy: Loot Pips Like a Pro!🏆 GOLD HEIST ALERT! 🏆 XAU/USD Bandit Strategy (Swing/Day Trade)
Steal Pips Like a Pro! 💰🔓 Bull vs. Bear Raid Plan
🌟 Greetings, Market Pirates! 🌟
"The trend is your accomplice—time to loot!"
🔮 Thief’s Technical & Fundamental Intel:
XAU/USD (The Gold Vault) is flashing BEARISH signals, but we’re ready to raid both sides! Follow the heist blueprint below 👇
🎯 ENRY POINTS (Where to Strike!)
🏴☠️ LONG RAID (Bullish Thieves):
Break & Grab: Enter above 3450.00 (Pullback Zone)
"Wait for the breakout, then ambush!"
🐻 SHORT RAID (Bearish Bandits):
Sneak Attack 1: Sell below 3300.00
Sneak Attack 2: Sell below 3260.00 (Support Wall Cracked!)
🛑 STOP-LOSS (Escape Routes)
Bullish Trade: SL at 3230.00 (Guard your loot!)
Bearish Trade 1: SL at 3360.00 (Don’t get caught!)
Bearish Trade 2: SL at 3280.00 (Risk = Reward!)
(Adjust SL based on your risk appetite & lot size!)
💰 TAKE-PROFIT (Cash Out & Flee!)
Bullish Thieves: TP at 3270.00 (Or escape early!)
Bearish Bandits (1): TP at 3270.00
Bearish Bandits (2): TP at 3210.00 (Big score!)
⚠️ WARNING: Market Traps Ahead!
News = Danger Zone! 📢 Avoid new trades during high-impact news.
Trailing SL = Your Getaway Car! Lock profits & evade reversals.
📰 FUNDAMENTAL BACKUP (Why This Heist Works)
Bearish momentum fueled by macro trends, COT data, & sentiment.
Stay sharp—markets shift fast!
💥 BOOST THIS HEIST! 💥
Like & Share to strengthen our pirate crew! 🚀 More alerts = More profits!
🚨 Next Heist Coming Soon… Stay Tuned! 🚨
Gold is weak. Will it explode next week?Gold prices failed to stabilize above $3,400 after a bullish breakout this week. The technical outlook highlights the recent indecision of gold bulls.
In the first two trading days of this week, spot gold prices rose by 2.4%, but the cumulative decline in the last three trading days of this week reached nearly 3%. The sharp fluctuations this week were due to the positive progress in Trump's trade negotiations, and the rebound in market risk appetite, which hit the safe-haven demand for gold.
Looking at next week, the economic calendar will provide several high-impact data releases. The Federal Reserve will announce its monetary policy decision after the policy meeting on July 29-30; the US Bureau of Labor Statistics will release the July employment report; and some important news such as the US-China trade negotiations may trigger the next major move for gold.
From a technical perspective, the current market short-term technical outlook highlights the hesitation of gold buyers. The daily chart shows that the RSI is still slightly below 50, and gold prices have difficulty staying away from the 20-day and 50-day MAs after breaking through these two levels earlier this week.
On the upside, 3450 constitutes the first resistance for gold prices. If it breaks through this resistance, gold prices will most likely hit the 3400 integer mark again.
On the downside, if gold prices remain below 3340, technical sellers may still be interested. In this case, 3310 can serve as the first support level, followed by the second support level near 3285.
A new week is about to begin, and I wish all traders good luck.
Gold Trade SetupI will risk!!!
It seems we are near at the end of correction wave...
The first target R/R is 2 and the second is 4...

Gold - The clear top formation!🪙Gold ( TVC:GOLD ) just created a top formation:
🔎Analysis summary:
Over the past four months, Gold has overall been moving sideways. Following a previous blow-off rally of about +25%, this cycle is very similar to the 2008 bullish cycle. Bulls are starting to slow down which will most likely result in the creation of at least a short term top formation.
📝Levels to watch:
$3.000
🙏🏻#LONGTERMVISION
Philip - Swing Trader

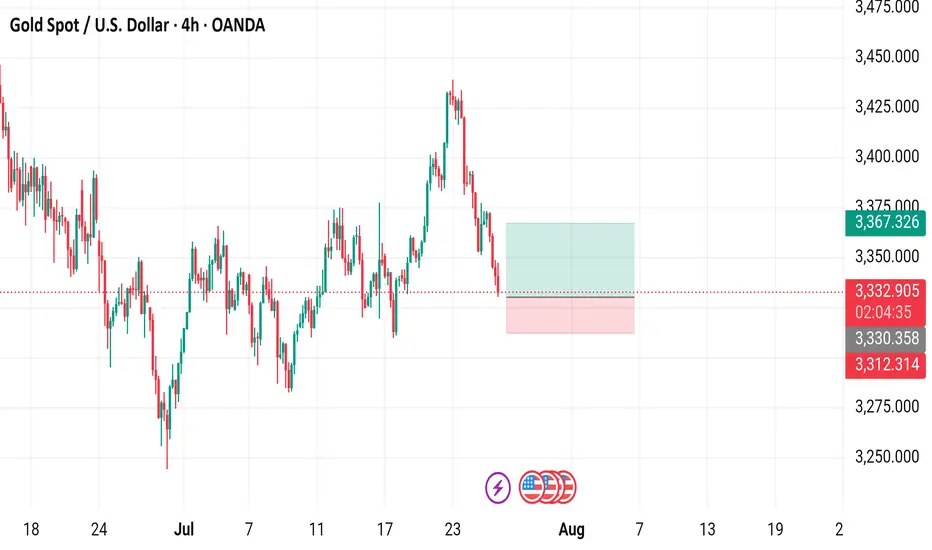
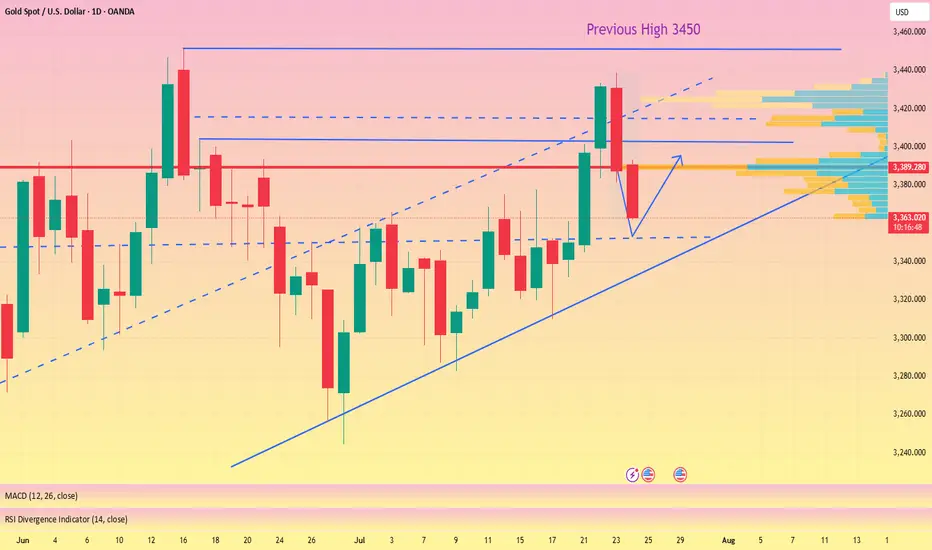
Gold Spot / U.S. Dollar (XAUUSD) - 4 Hour Chart (OANDA)4-hour chart from OANDA displays the price movement of Gold Spot (XAUUSD) from late July to early August 2025. The current price is $3,332.775, reflecting a decrease of $35.935 (-1.07%) as of 07:54 PM PKT on July 25, 2025. Key levels include a sell price of $3,332.480 and a buy price of $3,333.050. The chart shows recent volatility with a shaded support zone around $3,312.314 to $3,367.326, indicating potential price stabilization or reversal areas.
7/25: Key Levels to Watch Closely for Next Week's TradingGood evening, everyone!
Due to health reasons, I had to take a short break from updates — thank you all for your understanding and support.
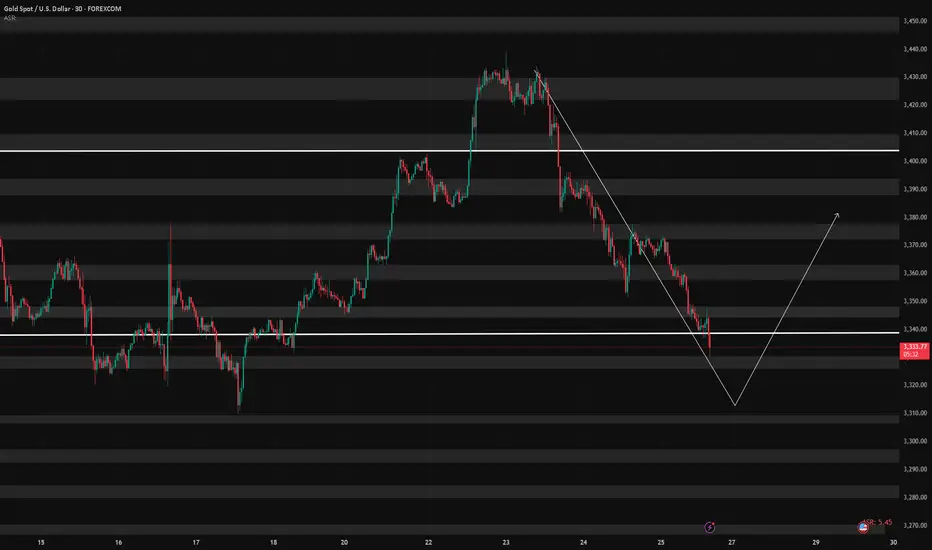
This week, gold rallied to the 3440 level, forming a double-top pattern, and has since entered a phase of consolidation with a downward bias, currently retracing back to the key 3337-332 support area.
While a short-term rebound is possible from the 30-minute chart perspective, the weekly structure is not favorable to the bulls. On the daily chart, price has once again reached the MA60 support, and is currently forming three consecutive bearish candles, which suggests that bearish momentum may continue.
Unless there is significant bullish news next week, the market may remain under pressure. Key levels to monitor:
Upside resistance zones: 3343, 3352, 3358, 3366, 3372, 3378, and 3386–3392
Downside support zones: 3337, 3332, 3323, 3312
If the weekly chart breaks down, watch for: 3300 psychological level and 3260 (weekly MA20)
Additionally, during this week's decline, a price gap has been left between 3395–3398. If the market starts to rebound on the 2-hour chart, there is a chance this gap will be filled. However, this area also serves as strong resistance, and any approach toward it could result in heavy selling pressure. Caution is advised in the event of a sharp rally.
I'm still recovering and unable to monitor the markets for extended periods. Once my health improves, I’ll resume regular updates. In the meantime, feel free to leave any questions, and I’ll do my best to respond. Thanks again for your continued support, and I wish everyone success and strong profits in the market!
XAUUSD – The Structure Is Still Bullish... But Barely Holding 📌 In yesterday’s analysis, I mentioned that although Gold corrected deeper than expected, dropping below 3400, the bullish structure remained intact — and I stayed true to that view by buying dips.
🎯 The trade didn’t go as planned. Fortunately, the New York rebound from 3350 helped me exit at breakeven.
🧭 So now the big question is:
Is Gold reversing to the downside?
The answer: Not confirmed yet.
The structure is technically still bullish, but the chart is far from pretty.
🧨 What’s going wrong?
❌ Bearish engulfing candle on Wednesday – I chose to ignore it yesterday, but it’s still there.
❌ The breakout above 3375 (ascending triangle resistance) is failing – and could now turn into a false breakout trap.
❌ The ascending trendline from January 2025 is under pressure.
❌ And if today we close near 3350, the weekly chart will show a bearish Pin Bar – not exactly a sign of strength.
📉 My current plan:
- If price rallies back above 3380 → I’m looking to sell into strength, not buy.
- If we break below 3350 → I’ll also look to sell the breakdown.
Right now, for Gold to regain bullish momentum, it needs to reclaim 3400. No compromise.
⚠️ Summary:
Yes, the bigger structure is still bullish.
But momentum is fading, and price action is starting to turn against the bulls.
We need confirmation, not hope.
If 3350 breaks cleanly – things could accelerate to the downside.
Disclosure: I am part of TradeNation's Influencer program and receive a monthly fee for using their TradingView charts in my analyses and educational articles.

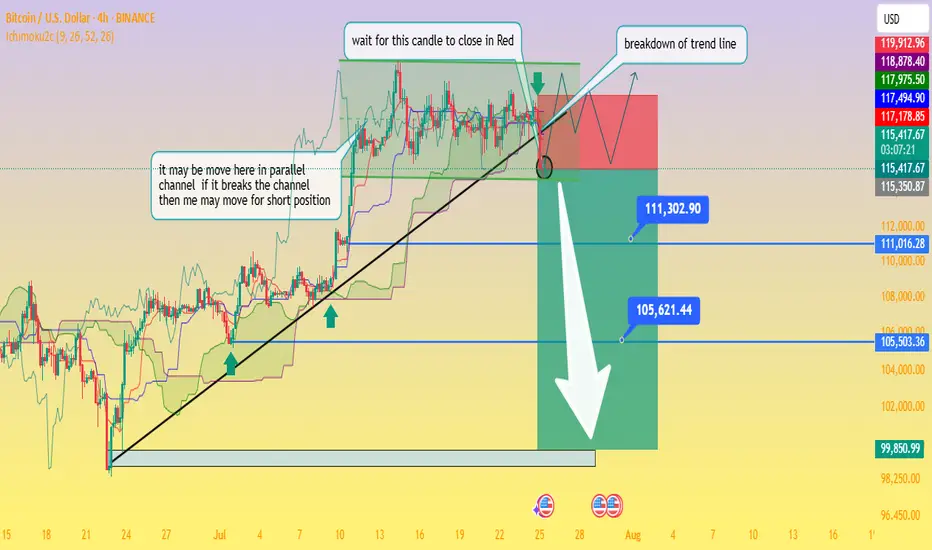
Critical Breakdown: BTC/USD Poised to Fall — Waiting on H4 CloseAnalysis of the BTC/USD 4‑Hour Chart
From the chart you provided, here's how the technical situation looks:
Ascending trendline support has been tested multiple times and was recently breached this afternoon, signaling a possible shift from the bullish setup to a bearish continuation.
The price is now trapped within a descending triangle formation beneath a well‑defined swing high resistance zone. This reflects indecision in the market, with neither buyers nor sellers in clear control
Business Insider
+15
Fxglory Ltd
+15
Bitcoin News
+15
.
Key levels to monitor:
Support zone: ~$115,500, extending down to ~$111,300 and ~$105,600 as deeper targets if bearish momentum strengthens.
Resistance zone: ~$119,000–120,000 area, forming strong overhead supply
Economies.com
DailyForex
Bitcoin News
.
The chart’s annotations align with a classic breakout strategy—with the caveat: wait for a confirmed close below the trendline before considering short positions (as noted in your “wait for this candle to close in red” comment).
Breakout confirmation would likely pave the way toward your indicated profit zones near ~$111k and ~$105k, with a larger potential down to ~$99.8k if further downside pressure builds.
🔍 What the Broader Market Signals
Technical sentiment from sources covering today’s analysis shows BTC/USD hovering just under $120,000, stuck within the defined range of $115.5k support to $120k resistance
Economies.com
.
While there’s still neutral momentum in indicators like RSI and MACD, the short-term direction leans bearish if the breakdown is confirmed on the H4 timeframe
Fxglory Ltd
.
Analysts emphasize that sustained movement above $116.5k could retarget resistance near $119–120k. A failure there and a move below $115.5k may thrust price deeper toward your downside zones
DailyForex
.
✅ Trading Strategy Overview
Scenario Trigger Target Levels
Bearish Breakdown H4 candle closes below trendline ~$115.5k $111.3k → $105.6k → possible $99.8k zone
Bullish Rejection Bounce back above ~$116.5k and trending above resistance $119k–120k retest, potential breakout if sustained
Neutral / Wait-and-see No decisive candle close yet Hold for confirmation
⛳ Final Thoughts
chart highlights a critical point: don’t act prematurely. Wait for a decisive H4 candle close below the trendline before committing to shorts. Confirmed bearish action around the breakout could open the path to the lower targets you identified. However, if price rebounds above support and climbs above $116.5k, a short-term retest of $119k–120k is still in range.
Traders should maintain prudent risk management—watching the unfolding price action around these pivot points without overreaching. Let me know if you'd like help crafting entry/exit zones or risk profiles for this setup!
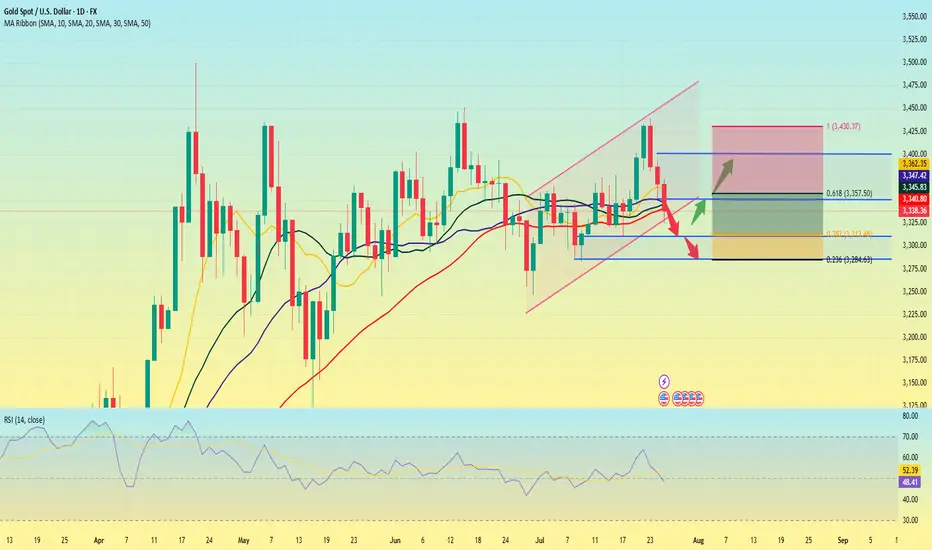
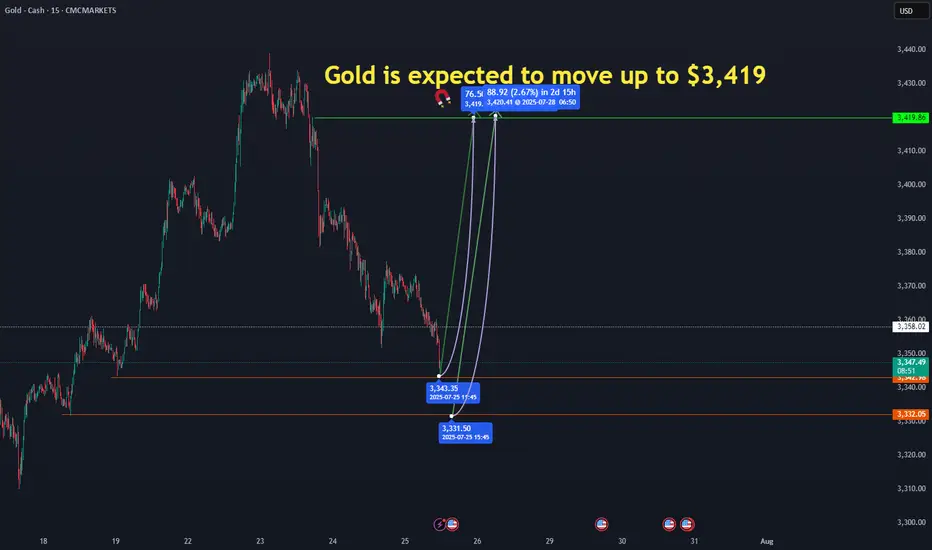
GOLD move up to 3419$Gold has the potential to start an upward move from the 3,343 and 3,331 levels. Reaching 3,419.86 is certain." CMCMARKETS:GOLD
Gold at Key Support – Will Bulls Step In or Drop Continue?🌐 Market Overview
Gold has struggled to recover after yesterday's sharp drop, driven by macro-political concerns and profit-taking at recent highs.
🔻 On July 24, former President Trump made an unexpected visit to the US Federal Reserve, sparking speculation that he's pressuring the Fed to cut interest rates soon.
While the Fed has yet to make any dovish moves, short-term bond yields dipped slightly, showing growing market expectations for policy easing.
The US dollar remains strong, reflecting some skepticism around the Fed’s possible shift despite recent economic strength.
📉 Technical Outlook
On the H2 chart, gold still maintains an overall bullish structure. However, it's approaching a critical support level near 3338, which aligns with the VPOC and the ascending trendline.
📌 If this zone breaks, price may rapidly fall toward deeper liquidity zones in the 332x – 329x range.
🎯 Trade Setups
🔽 BUY SCALP (Quick Reaction Play)
Entry: 3338 – 3336
Stop Loss: 3332
Take Profit: 3342 – 3346 – 3350 – 3354 – 3360 – 3365 – 3370 – 3380
🟢 BUY ZONE (Deep Buy Area – Long-Term Potential)
Entry: 3312 – 3310
Stop Loss: 3305
Take Profit: 3316 – 3320 – 3325 – 3330 – 3340 – 3350 – 3360 – 3370 – 3380
🔻 SELL ZONE (if market retests)
Entry: 3374 – 3376
Stop Loss: 3380
Take Profit: 3370 – 3366 – 3360 – 3355 – 3350 – 3340 – 3330
🔍 Key Levels to Watch
Support: 3350 – 3338 – 3325 – 3310 – 3294
Resistance: 3374 – 3390 – 3400 – 3421
⚠️ Risk Note
As we head into the weekend, liquidity sweeps are common – especially on Fridays. Be cautious of sharp moves.
Focus mainly on scalp setups today. Avoid early long entries unless strong confirmation appears at lower liquidity zones.
Always follow your TP/SL strategy to protect your capital.

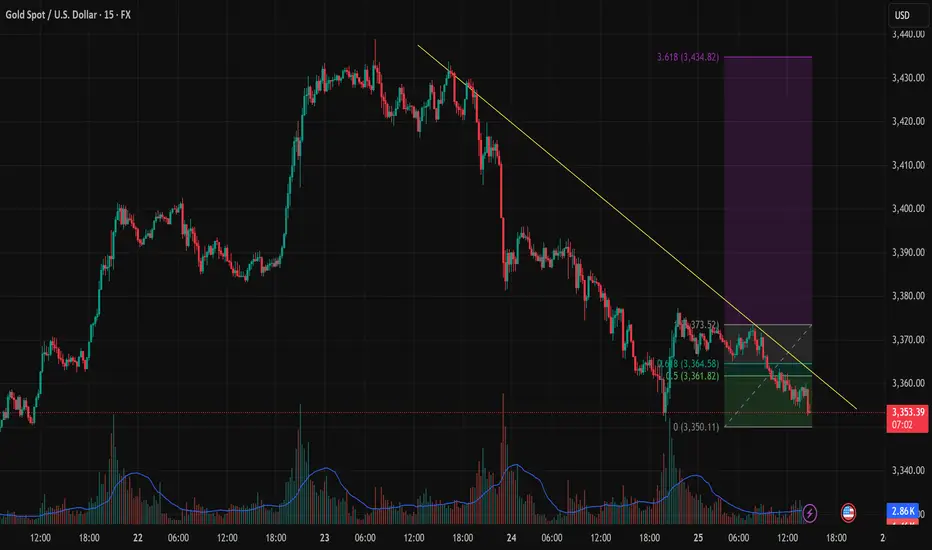
BULLISH REVERSAL SIGNAL FROM 3,350 SUPPORTOn the 15-minute chart (M15), XAUUSD is showing early signs of recovery after a sharp decline that found support around the key 3,350 USD level. This area has been tested multiple times with increasing volume, suggesting potential buyer accumulation.
Technical Analysis: Downtrend Line: A descending trendline (yellow) from the July 23 high has acted as dynamic resistance. Price is now approaching this line again.
Fibonacci Retracement: The recent rebound from 3,350.11 to 3,373.52 shows key resistance zones at the 0.5 (3,361.82) and 0.618 (3,364.58) Fibonacci levels.
Volume Spike: Notable volume surges at the bottom suggest increased buyer interest near support.
Key Price Levels for Today: Technical Zone Role 3,350 – 3,353
Strong short-term support 3,361 – 3,365
Fibonacci 0.5–0.618 resistance 3,373.5
Previous swing high 3,400 – 3,434
Fibonacci 3.618 extension target
Trading Strategies: Scenario 1: Bullish Breakout Above Trendline Entry: Buy stop above 3,366 with increasing volume.
TP1: 3,373.5
TP2: 3,400
TP3: 3,434 (Fibonacci 3.618 extension)
SL: 3,348 (below recent low)
Scenario 2: Trendline Rejection – Bearish Continuation Entry: Sell limit at 3,364–3,366 if bearish pin bar / engulfing pattern appears
TP1: 3,350
TP2: 3,338
SL: 3,375
Additional Confirmation Signals: Closely watch price action near the trendline and Fibonacci zone (3,361–3,364).
RSI is not yet oversold, so a short-term technical rebound remains possible.
Conclusion: Gold is currently testing a significant support zone around 3,350 USD. If price successfully breaks above the descending trendline and holds, we may see a bullish impulse targeting as high as 3,434 USD. However, failure at this resistance may trigger another leg down.
Gold in Demand Zone | Target $3,380🚨 GOLD/USD – BIG MOVE LOADING! 🚨
🔍 Price is currently reacting from a major demand zone ($3,340–$3,345) with signs of accumulation and a possible double bottom pattern forming.
📉 After a strong downtrend, this looks like a liquidity sweep and smart money trap — prepping for a reversal back to the $3,380 resistance zone where liquidity resides.
📈 Scenarios to Watch:
1️⃣ Price sweeps support again and reverses hard
2️⃣ Clean structure break above $3,365, followed by a retest
🎯 Target: $3,380–$3,385
🛡️ Invalidation: Strong close below $3,335
⚠️ Confirmation Required! Best entry would be after structural break + retest. Keep your risk tight, and let the market show its hand.
⸻
📌 Key Levels:
• Support Zone: $3,340–$3,345
• Target Zone: $3,380–$3,385
• Invalidation: Below $3,335
⸻
📣 If this setup helps you, like 👍, comment 💬, and follow 🔔 for more high-probability ideas every week!
#Gold #XAUUSD #SmartMoney #LiquidityGrab #ForexSetup #PriceAction #BreakoutTrade #DoubleBottom #TradingView #GoldAnalysis #ForYou #FXStrategy #SupplyAndDemand
Gold is weak. Beware of lows.On Thursday, the dollar index ended a four-day losing streak thanks to the progress of the fund between the United States and its trading partners.
As signs of easing global trade tensions curbed demand for safe-haven assets, gold fell for the second consecutive trading day, and yesterday it hit the 3350 bottom support level.
From the 4-hour chart
although it rebounded to the 3370-3380 range after hitting 3350. But it can be found that the current rebound is actually weak, and it is still maintained at 3360-70 for rectification. At present, the bottom of the 4-hour bottom is absolutely supported at 3340-3335. The rebound high is around 3375. As of now, gold has not rebounded above 3375, and gold is actually in a weak position.
Secondly, from the hourly chart, the weakness is even more obvious. The high point on Thursday was around 3395. Today's current high point is around 3375. It can be seen that if the bottom falls below the 618 position 3350 again, it will directly touch around 3335. It coincides with the target position of 3340-3335 in the previous 4-hour chart.
Therefore, it is not possible to buy the bottom and go long today. Be alert to the possibility of further touching 3340-3335.
Gold (XAU/USD) 4-Hour Technical Analysis Report - 25 July 2025 📌 Market Context & Sentiment Overview
The gold market is currently trading in a state of technical compression, with the price hovering just beneath the mid-3360s. After a significant rally earlier in the month, the recent sessions have seen price action coiling within a tight ascending triangle—a classic pattern known to precede breakouts.
According to recent publications by FXEmpire, FXStreet, and Investing.com, sentiment remains moderately bullish. Analysts point to strong institutional demand near the 3320–3330 zone, while also warning of resistance pressures near the 3380–3390 zone. These insights align with our technical findings, which suggest a developing structure with increasing breakout potential.
📊 Technical Structure Analysis (4-Hour Timeframe)
🔹 Price Action & Structural Patterns
The prevailing structure is a rising triangle anchored between support at 3320 and resistance near 3380–3390. Price has been forming higher lows, indicative of underlying buying pressure, while simultaneously facing resistance at increasingly frequent tests of the upper band. The contraction of candlestick bodies and volume confirms the presence of a coiling market—hinting at an imminent directional move.
The presence of upper-wick rejections near 3380 signals seller interest, while long-tailed candles at 3330 underscore buyer defense of the rising trendline. This dynamic equilibrium is the hallmark of a triangle formation nearing completion.
🔹 Support & Resistance Levels
Our analysis identifies the following zones as technically significant:
Key Support (Buy Zones):
3320–3330: This zone hosts a major bullish order block, 8/21 EMAs, and the lower trendline of the rising triangle. It is further supported by the 61.8% Fibonacci retracement drawn from the 3300 low to the 3390 swing high.
3300–3310: A psychological level and previous 4-hour swing low. Acts as a secondary defense level.
Key Resistance (Sell Zones):
3380–3390: Triangle resistance, aligned with the 50 EMA and a bearish order block.
3440–3450: An upper extension zone if breakout materializes, noted in external institutional outlooks.
🔹 Volume, VWAP & Institutional Concepts
Volume has notably contracted, a classical feature of triangle formations, with most trading volume aggregating at the mid-point (~3345–3355). VWAP sits just below the current price, reflecting mean reversion tendencies. Furthermore, liquidity pockets are observed just beneath 3320, suggesting potential for liquidity grabs before a bullish reversal.
From a Smart Money lens:
A bullish order block has formed near 3320–3330.
A bearish OB and resistance cap prices around 3380.
A small Fair Value Gap (FVG) lies around 3340–3350, acting as a potential price magnet.
🔹 Indicators & Oscillators
Moving Averages: The 8/21 EMA cluster lies just below current price, offering dynamic support.
MACD: Negative but converging—suggesting bearish momentum may be waning.
ADX: Reading ~40, indicating a trending market, though momentum has slightly slowed.
RSI: Hovering near 35–40, close to oversold; signals potential bounce.
Stochastics & CCI: Both deeply negative—supporting the case for a mean-reverting move.
🎯 Strategic Buying & Selling Zones
✅ High-Probability Buy Zones
3320–3330:
Rationale: Confluence of bullish OB, rising trendline, EMAs, and Fib 61.8%.
Confidence: High (★ ★ ★)
3300–3310 (buffer zone):
Rationale: Psychological and historical swing low support.
Confidence: Moderate
❌ High-Probability Sell Zones
3380–3390:
Rationale: Triangle resistance, prior highs, and bearish OB presence.
Confidence: High
3440–3450:
Rationale: Post-breakout measured move target and potential take-profit zone.
Confidence: Moderate
🏆 The Golden Setup: High-Conviction Trade Idea
Direction: Long
Entry: 3325
Stop Loss: 3300
Take Profit: 3390
Confidence Level: ★ ★ ★ (High)
🔍 Justification
This setup takes advantage of the strongest structural support within the triangle—centered around 3325. This level is reinforced by the 61.8% Fibonacci retracement, bullish order block activity, and EMA compression, all coalescing with the triangle’s rising support line.
Indicators are turning from oversold, and the volume profile suggests that institutional players may look to engineer a liquidity sweep under 3330 before a continuation push to test the 3380 resistance. The reward-to-risk ratio is favorable, and the setup offers clear invalidation with a tight stop at 3300.
Should momentum continue post-breakout, a secondary TP could be explored at 3440. However, for the purpose of tactical execution, 3390 is a strategically sound exit point.
🧠 Sentiment Cross-Check & Market Alignment
External sentiment and professional forecasts support the underlying thesis of a bullish breakout, pending confirmation. TradingView’s top technical authors emphasize the breakout of this ascending triangle toward 3440+, while Investing.com’s shorter-term signals reflect bearish pressure that aligns with our buy-the-dip strategy.
This synthesis of internal and external analysis increases our conviction in a long-biased tactical approach from the current support zone.
✅ Summary Table
Buy Zones Sell Zones Golden Setup
3320–3330 (primary) 3380–3390 (primary) Direction: Long
3300–3310 (buffer) 3440–3450 (extension) Entry: 3325
Stop Loss: 3300
Take Profit: 3390
Confidence Level: ★ ★ ★ (High)
🔚 Final Thoughts
Gold’s current price structure presents a rare opportunity—one defined by tight consolidation, structural clarity, and institutional footprints. As the market coils within a classic triangle, the 3320–3330 zone emerges as a high-probability springboard for long positions. With precise risk management and a disciplined approach, this setup offers traders a compelling entry with defined technical boundaries.
The golden rule now: Respect structure. React to confluence. Trade with conviction.

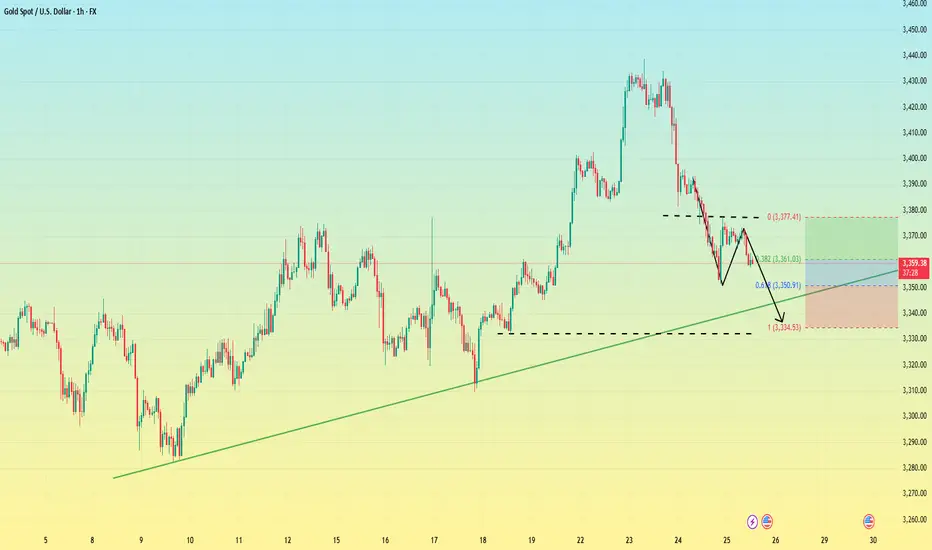
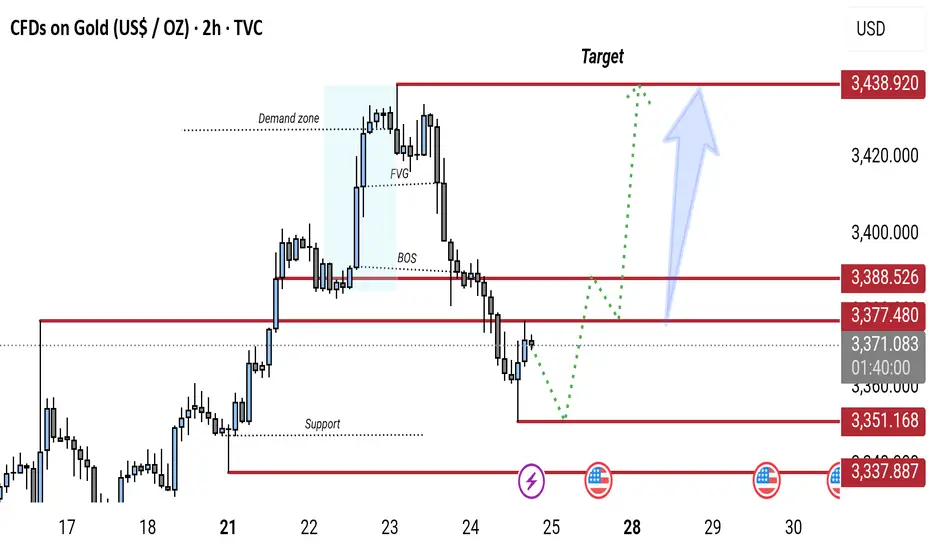
Gold 2H Chart: Bullish Reversal Expected from Key Support ZoneGold (XAU/USD) 2H chart shows a bearish break of structure (BOS) followed by a pullback toward a key support zone (around 3,337–3,351). A potential bullish reversal is expected from this zone, targeting the 3,438 resistance level. The chart highlights a demand zone, FVG (Fair Value Gap), and possible retracement before continuation to the upside.
The callback is coming to an end, don't chase the short easily#XAUUSD
The long positions held last night have already left the market at a loss😔. After the Asian session opened, I continued to watch the trend of gold, but it did not effectively rebound to the ideal target area. After repeatedly testing around 3393, I chose to manually exit the market📀.
Gold is currently somewhat overcorrected, with the hourly line falling into severe oversold territory📉. But the market will eventually return to the bullish trend🐂. Why do I say that? First, there are less than 8 days left before the final deadline for tariffs. Second, the Federal Reserve’s interest rate cut is also approaching. In the medium and long term, there is definitely no problem with being bullish. There will be initial jobless claims data later, which will affect the trend of gold today. We need to pay some attention to it👀.
From the daily line, the current Bollinger Band middle track is near the 3343 line, and the SMA60 moving average is near the 3330 below. In the short term, the downward momentum of gold is released, and it is expected to test the 3343 mid-line support below💪.
📊Therefore, we can consider going long again at 3360-3343 below and look towards 3375-3385. Short-term losses don’t mean anything. With the recent frequent news fluctuations, we still have a good chance to turn losses into profits🚀.
🚀BUY 3360-3350
🚀TP 3375-3385
XAUUSD Traders - Turn Chaos into Pips with This StrategyHello Traders,
Struggling to trade XAUUSD due to its high volatility? Taking small profits but suffering big losses?
We’ve got your back.
Introducing Gold Sniper — a high-probability strategy specially crafted for XAUUSD traders. With a 65%+ win rate and a consistent 1:1.33 risk-reward ratio, it’s designed to help you catch sharp moves with confidence.
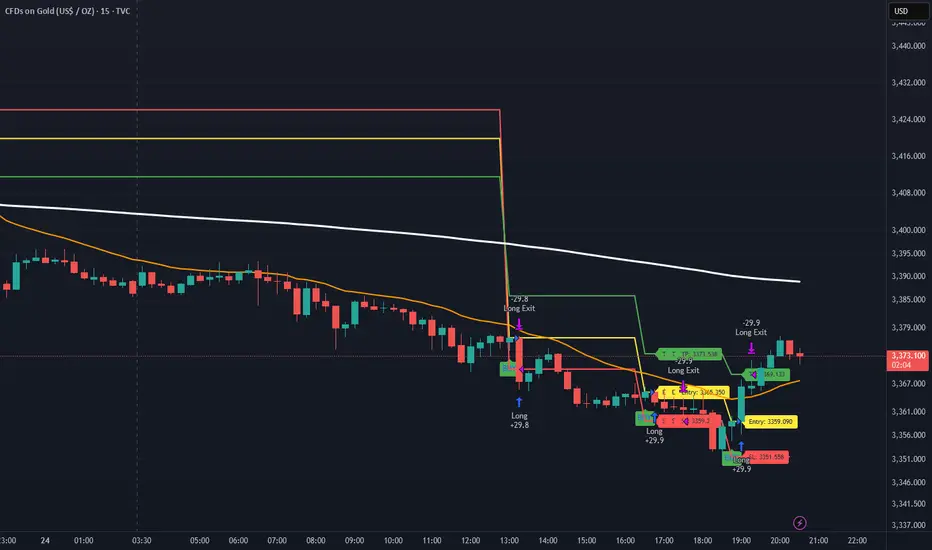
🚨 Live Performance Highlights:
Today’s Trades:
Signal 1
🟢 Buy @ 3365.350
🔴 SL @ 3359.209
🟢 TP @ 3373.538
❌ Result: SL Hit → 61 Pips Loss
Signal 2
🟢 Buy @ 3359.090
🔴 SL @ 3351.558
🟢 TP @ 3369.133
✅ Result: TP Hit → 75 Pips Profit
📊 Net Profit Today: +13 Pips
📅 Yesterday’s Profit: +150 Pips
✅ Gold Sniper helps you:
• Avoid fake breakouts
• Catch real momentum
• Stick to disciplined entries and exits
🎯 Want to boost your trading accuracy?
📩 DM us now to get access and start using Gold Sniper directly on your TradingView chart.
If you find this valuable, like the idea and show your support. Let’s grow together!
Happy Trading,
InvestPro India
Correction in Play, Long-Term BUY Opportunity Ahead XAUUSD 24/07 – Correction in Play, Long-Term BUY Opportunity Ahead
🧭 Market Outlook
Gold has dropped sharply from the 343x region, exactly as outlined in yesterday’s plan. Price has broken below the ascending trendline on the H1 chart and is now tapping into lower liquidity zones (FVG + OBS), signaling continuation of the short-term bearish move.
Key context to watch:
Traders are awaiting final decisions on US global trade policy agreements.
Next week’s FOMC meeting may confirm expectations of an interest rate cut.
Later today, markets will react to US PMI data and Jobless Claims, which could trigger volatility.
📊 Technical View
While the higher timeframe trend (D1/H4) remains bullish, the short-term structure has broken, and the market is now exploring unfilled liquidity pools below. Once these are swept, we anticipate a strong long-term BUY opportunity.
🎯 Trading Plan for Today
📌 Short-Term Strategy:
Look for short-term SELL setups on retracements toward resistance zones. Wait for clear rejection signals before entering.
📌 Mid/Long-Term Strategy:
Prepare to BUY from major Key Levels once price taps into deep liquidity zones. Ensure confluence and good risk/reward before entering.
🔎 Key Levels to Watch
🔺 Upper Resistance Zones:
3393 – 3404 – 3414 – 3420 – 3428
🔻 Lower Support Zones:
3375 – 3366 – 3352 – 3345 – 3330
🔽 Trade Setups
✅ BUY ZONE: 3352 – 3350
SL: 3345
TP: 3356 → 3360 → 3364 → 3370 → 3375 → 3380 → 3390 → 3400
🔻 SELL ZONE: 3414 – 3416
SL: 3420
TP: 3410 → 3406 → 3400 → 3395 → 3390 → 3380
⚠️ Risk Reminder
No major economic news is scheduled for today, but unexpected political statements or geopolitical tensions could cause price spikes.
✔️ Always follow your SL/TP strictly.
✔️ Avoid entering without solid confirmation.
✔️ Watch how price reacts to the levels above.
📣 Follow MMF on TradingView
If this trading roadmap helps your strategy,
📌 Follow the MMF team on TradingView for daily actionable setups, real levels, and no-nonsense analysis based on real market conditions.
🎯 Real trades. Real zones. Real discipline.
