Gold’s Wild Ride: A Trader’s Take on What’s NextHey Fellow Traders! 👋
Gold’s been an absolute beast this week, smashing through both buyers and sellers like it’s playing a high-stakes game of market whack-a-mole! 😅 After Wednesday’s wild moves and today’s follow-up, Gold’s keeping us all guessing.
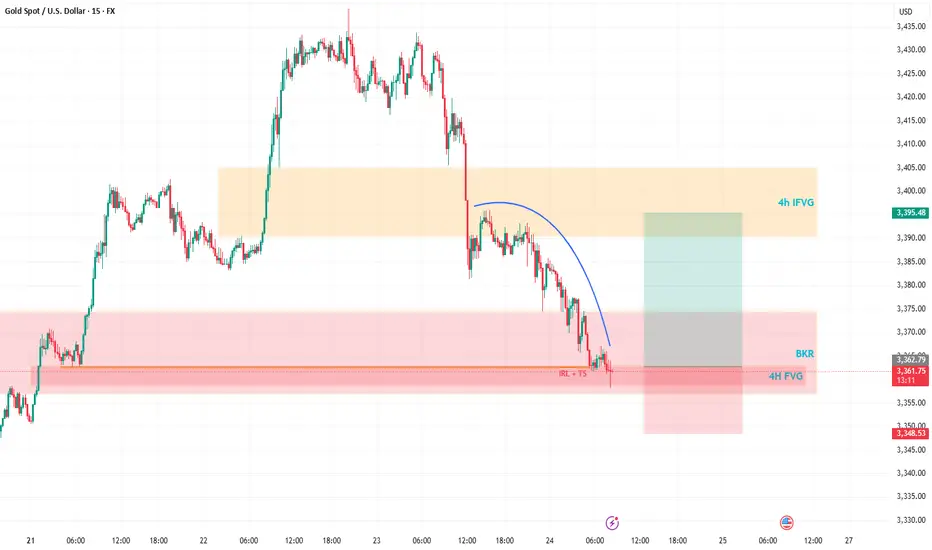
Right now, I’m not locking in a long-term bias—Gold’s too unpredictable for that. But here’s the exciting part: I’m eyeing a short-term long opportunity. Why? The price just dipped into a 4H Fair Value Gap (FVG) and tagged a Breaker, setting up a potential bounce. 📈
My plan? I’m expecting Gold to sweep up the highlighted liquidity and charge toward the 4H Inversion Fair Value Gap (IFVG). Once it hits that zone, I’ll be glued to the charts, watching for its reaction to decide the next move. 🧐
As always, trade smart! Set your stops, size your positions wisely, and don’t let Gold’s volatility catch you off guard. Protect your capital first—always! 💡
What’s your take on Gold right now? Are you jumping on this setup or waiting for more confirmation? Drop your thoughts in the comments below, give this post a like, and follow for more updates! 👇 Let’s keep the trading convo going! 🔥
Xauusdsignal
XAUUSD 24/07 Bullish Reversal Potential from Falling Channel1. Price Overview & Trendline Context
Gold (XAUUSD) is currently trading around 3,369.67 USD after a notable pullback from the recent high near 3,428. A clear descending channel has formed, marking a short-term corrective move within a larger bullish trend. Price action suggests a potential reversal setup as price approaches a strong support zone around 3,340 – 3,350 USD, previously acted as demand in the breakout on July 22.
2. Fibonacci & Structure Analysis
The Fibonacci retracement drawn from the recent swing low to the top at ~3,428 reveals that the pullback has reached the 0.9 level, often seen as an exhaustion point for corrections in strong bullish trends. This area aligns with:
Key horizontal support: 3,340 – 3,350
Previous breakout zone
Volume spike at base (20.6K vs avg.)
This convergence suggests a high-probability bullish reversal setup.
3. EMA & Momentum Indicators
Although the chart primarily uses SMA 9, the structure suggests price is extended from shorter EMAs. A break above the upper boundary of the falling channel may trigger EMA crossovers, further confirming reversal momentum.
4. Trading Strategy Suggestion
Setup
Description
Buy Zone: 3,350 – 3,365 USD
Take Profit 1: 3,385 USD (short-term supply zone)
Take Profit 2: 3,428 USD (recent swing high)
Stop Loss: Below 3,340 USD
This trade follows the "Buy the Dip in Uptrend" strategy, aligning with trendline, fib support, and volume confirmation.
5. Key Resistance & Support Levels
Resistance: 3,385 – 3,428 USD
Support: 3,340 – 3,350 USD
Breakout Confirmation Level: 3,375 (channel breakout)
6. Final Insights
Gold remains in a broader bullish structure. Today’s chart shows strong technical confluence for a short-term reversal. Traders should monitor closely for breakout candles from the falling wedge/channel, preferably with volume confirmation.

#GOLD Will Keep Growing!
HI,Traders !
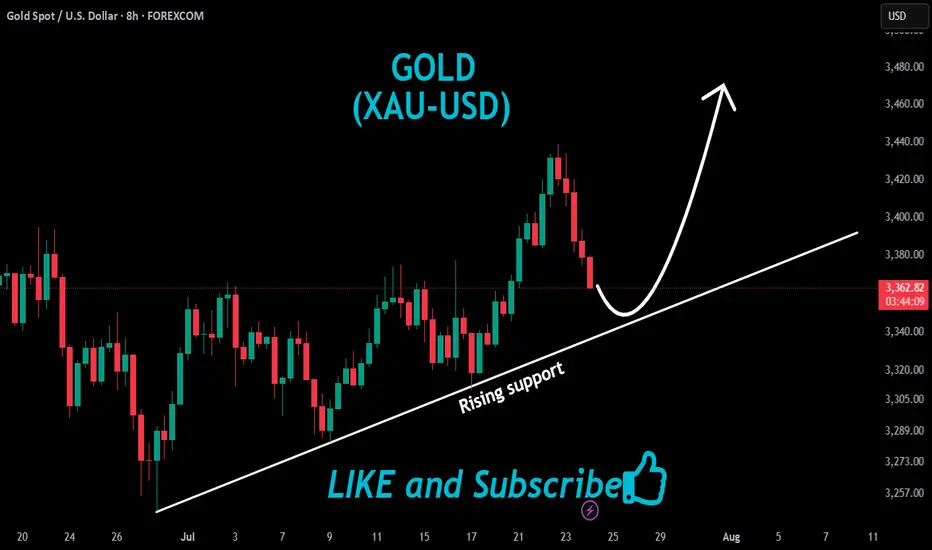
#GOLD keep trading in An uptrend
along the rising support So as the gold
is approaching A the support we will be
Expecting a bullish rebound !
Comment and subscribe to help us grow !
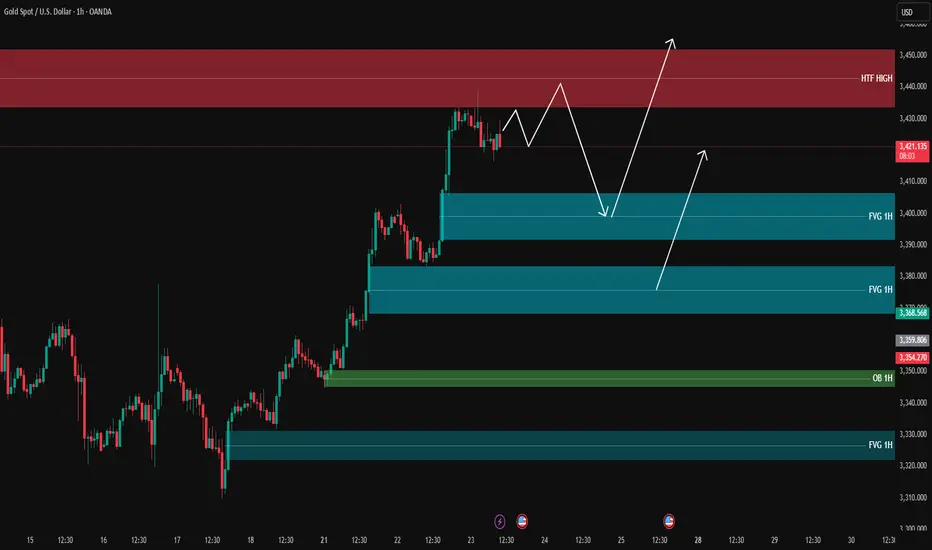
XAUUSD analysis - 1H FVG and OB setupsOn the 1H timeframe, price is reacting as it approaches the HTF high zone (3430-3450) and is currently pulling back.
The 1H FVG zones at:
🔹 3400
🔹 3368
and the 1H OB around 3350 are key areas we are watching for potential long entries.
📌 Plan:
We will wait for price to pull back into one of these 1H FVG/OB zones and look for entry confirmations on the 5M or 3M timeframe to go long.
🎯 Targets: 3430 – 3440 – 3450
❌ No sell setup for now unless a clear structure break happens.
Gold Correction Went Deeper, but the Bullish Structure Intact📌 Quick recap from yesterday:
In my previous analysis, I mentioned that I was looking to buy dips around 3400, expecting a continuation move toward the ATH near 3500.
That was the plan.
But as the day unfolded, I removed my pending buy order — and explained exactly why in an educational post on how context can override entry levels.
If you read that, you already understand:
It’s not where price goes. It’s how it gets there.
________________________________________
📉 So… where are we now?
The big question is:
Was this just a deeper correction, or is Gold preparing to shift direction entirely?
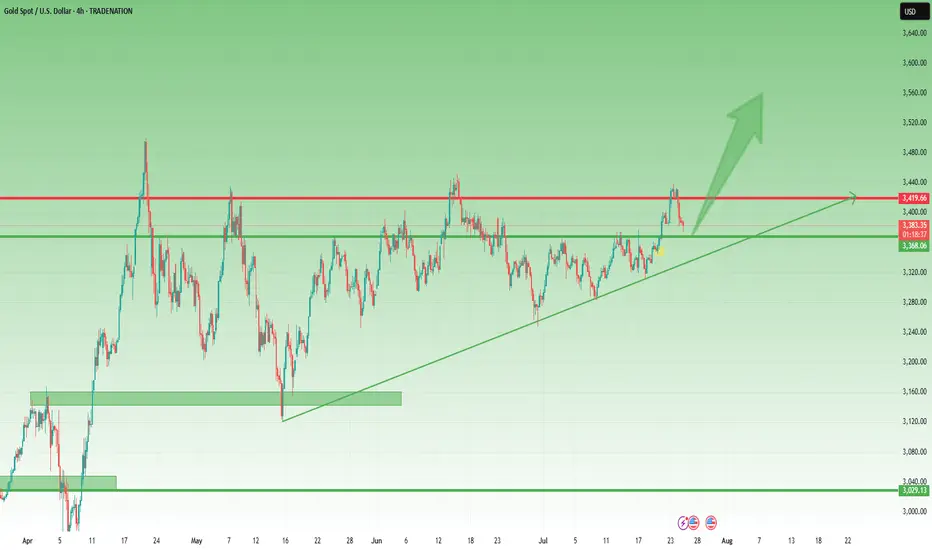
In my opinion, we’re still in a healthy correction, not a reversal.
Why?
• Price remains above the horizontal support — the same level that acted as resistance last week
• The market is still above the trendline from mid-May
• No breakdown, no major structure violation — just deeper retracement after a sharp impulsive move
________________________________________
📈 What’s the plan going forward?
As long as these two supports hold, I believe the buy-the-dip narrative remains valid — even at better prices.
In fact, I already entered a new long position about an hour ago, which is currently up around 90 pips at the time of writing.
My bias stays bullish unless proven otherwise.
________________________________________
📌 Conclusion:
Yes, the correction went deeper than expected.
Yes, I removed a pending order — because the reaction was not what I wanted to see.
But structure still supports continuation, and I remain in the buy-the-dip camp as long as key support holds. 🚀
Disclosure: I am part of TradeNation's Influencer program and receive a monthly fee for using their TradingView charts in my analyses and educational articles.
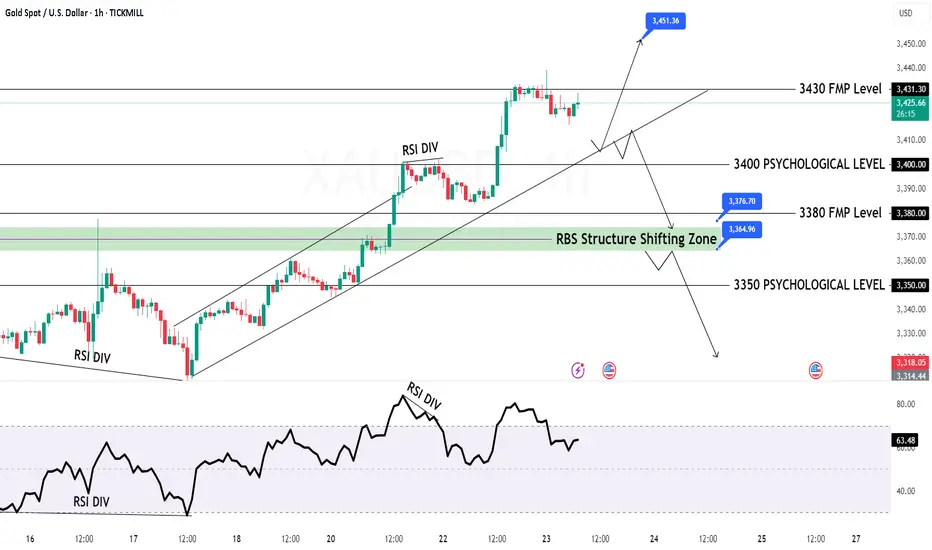
GOLD H1 Chart Update for 24 July 2025Hello Traders,
we got fall yesterday on RSI DIV and right now all eyes on 3350 Psychological level breakout if market successfully breaks that level then it will move towards 3330 or even 3315 level
some retracements remains pending around 3400-3412 zone GOLD will might retrace that zone before going further down
Reminder: PMI's day in the market
Disclaimer: Forex is Risky

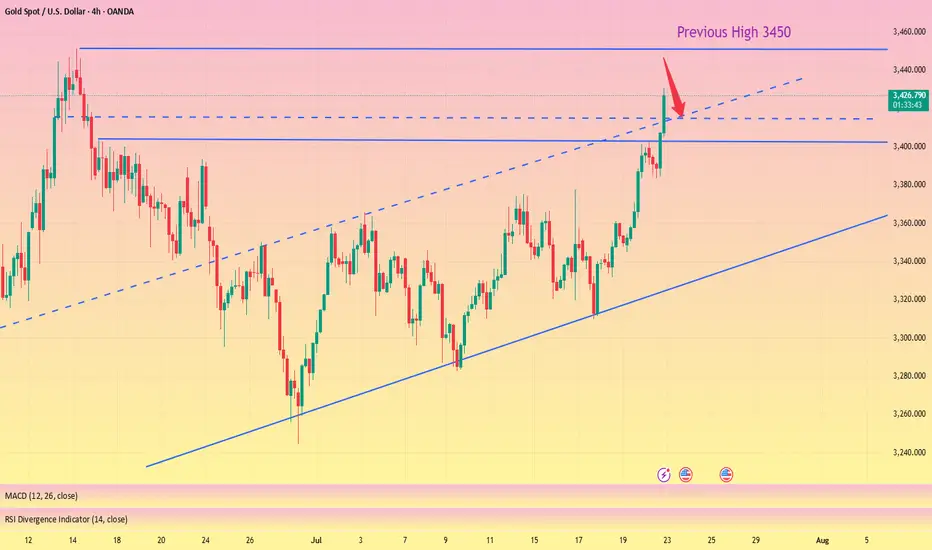
GOLD (XAUUSD) Forming Bullish ContinuationGold (XAUUSD) is currently presenting a strong bullish continuation setup after breaking out of a falling channel on the 4H timeframe. Price action confirmed bullish momentum with impulsive candles following the breakout, and we’re now seeing a textbook retest of the breakout zone around 3,370–3,360, which previously acted as resistance and is now expected to hold as support. The risk-to-reward ratio remains highly favorable, targeting the 3,450–3,460 zone in the upcoming sessions.
From a macro perspective, gold is gaining upside traction as the US dollar weakens amid growing speculation around an upcoming Fed rate cut. Investors are rotating into safe-haven assets as recession concerns resurface, with the market pricing in increased geopolitical tension and slower economic growth forecasts. Real yields are cooling, which typically boosts non-yielding assets like gold. With central bank demand for gold also staying strong, the bullish narrative continues to build.
Technically, momentum remains in the bulls’ favor. RSI is still holding above midline levels, suggesting there’s room for further upside. The current pullback offers a healthy correction within a larger bullish trend. Holding above the 3,360–3,340 support range is key for continuation; a daily close above 3,390 would confirm the next wave toward 3,450 and possibly 3,500 in the medium term.
This is a clear case of momentum following structure. As long as the lower boundary holds firm, I remain bullish on gold with strong conviction. Watch for volume confirmation on the bounce, and trade the trend—momentum is with the buyers.

Deep Pullback on XAUUSD Gold: What I'm Watching Now🚨 Gold Update & Trade Plan 🚨
Taking a look at Gold (XAUUSD) right now — it's been trending strongly in an uptrend 📈, showing impressive momentum over the past sessions. However, we've recently seen a deep pullback 🔻 that has tapped into a key liquidity pool 💧.
From this level, I'm anticipating a bullish reaction 🔁, and I’m eyeing a potential scalping or intraday opportunity. In the video, we break down:
🔹 Market structure
🔹 Price action analysis
🔹 Trend context
🔹 A complete trade plan
🎯 Entry, stop-loss, and targets are all discussed based on technicals — with precision and discipline.
This is my personal trading plan based on how I read the markets — not financial advice. Trade safe and stay sharp! ⚔️💹

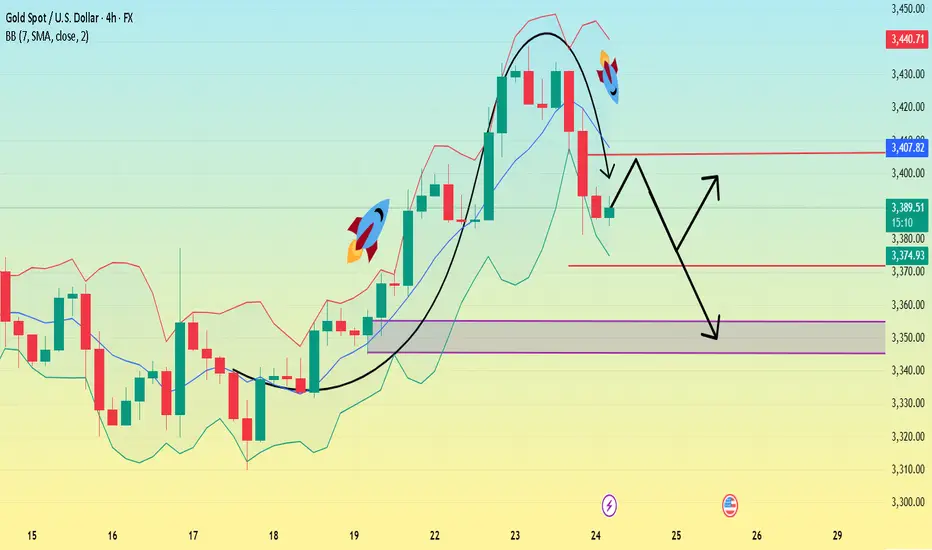
Gold is weak. Will it continue to fall?Yesterday, the price of gold did not continue to rise as strong as in the previous two days. After reaching the previous top position, it began to retreat under pressure.
The market is too bullish, and under this pattern, the market is likely to have an unexpected reversal. Yesterday, it fell below the 3400 integer mark, so it is likely to maintain a volatile downward trend in the future.
The current main support level is around 3370, which is also the primary point for the bears to continue to break down in the future. Once it falls below this position, the target may be around 3345-3355. It cannot be said that it has completely turned to a bearish position at the moment. It is just a bearish oscillation pattern within a large range, and the upper pressure is maintained near 3405, which is also the support point for the first downward step of the bears on Wednesday.
Today, we still need to operate around the short position first. The price rebounds to 3405 and shorts, and the profit range is around 3390-3380, and the stop loss is 3415.
After a new low appears in the European session, wait for the US session to rebound and continue shorting.
XAUUSD (Gold) Buy Setup – VSA & Fibonacci Confluence✅ Entry Zone: 3,411 – 3,404 (Key demand zone + 50%-61.8% Fib retracement)
🎯 Take Profit 1 (TP1): 3,446 (previous swing high)
🎯 Take Profit 2 (TP2): 3,452 (extension target above resistance)
🛑 Stop Loss (SL): Below 3,404 (beneath demand zone to avoid false breaks)
📊 Technical Insight:
Climactic volume seen on the initial rally signals strong professional interest in the move upward.
As price retraces, volume has decreased significantly, indicating lack of aggressive selling pressure (No Supply).
The shaded demand zone aligns perfectly with the 50%–61.8% Fibonacci retracement, suggesting a high-probability area for Smart Money accumulation.
Look for a Test Bar or Spring within this zone on low volume as confirmation of supply exhaustion.
If price confirms with a wide spread up-bar on increased volume from the zone, this will signal the beginning of a markup phase, in line with VSA principles.
📍 Bias: Bullish as long as price respects the demand zone. Aggressive traders can scale in near the demand area; conservative traders should wait for confirmation of demand dominance before entering.

XAUUSD Buy Setup – VSA + Smart Money Reaction at Demand Zone✅ Entry: Current price action (around 3,392)
🎯 Take Profit 1 (TP1): 3,415
🎯 Take Profit 2 (TP2): 3,446–3,452
🛑 Stop Loss (SL): 3,381 (below the confirmed demand zone)
📊 Technical Insight (VSA-Based Analysis):
The sharp markdown into the demand zone occurred with expanding volume and wide spreads, a classic sign of stopping volume—potential smart money absorption of panic selling.
The second wide-range down candle was followed by lower volume and tighter spread bars, indicating supply exhaustion.
The market is forming a cause (accumulation) at the bottom of this drop, confirmed by:
No follow-through selling despite high volume
Narrow spread candles showing hesitation from sellers
Increasing volume on small up-bars, suggesting hidden buying
The zone aligns with previous structure and lies just above the 0.786 Fib retracement, adding further confluence to the bullish case.

LONG Setup - Smart Money Bias (15m)
## 🟢 LONG Setup - Smart Money Bias (15m)
- **Pair**: XAU/USD (Gold)
- **Timeframe**: 15m
- **Entry Zone**: Around **3390.050**
- **Stop Loss (SL)**: **3377.200**
- **Take Profit Targets**:
- **TP1**: 3402.800
- **TP2**: 3410.500
- **TP3**: 3418.800
---
### 📌 Confluences:
- Demand zone respected and tapped.
- Bullish reaction from POI (Point of Interest).
- FVG (Fair Value Gap) filled and reversal initiated.
- BOS + CHoCH in lower timeframe confirmed.
- Forecast projection aligns with upside inefficiency.
---
### 🧠 Strategy:
- Smart Money Concepts (SMC)
- Liquidity Sweep below demand
- Risk-Reward Ratio: ~1:2.3
🚨 **Note**: Trade with caution around US market open hours (volatility expected).
📌 Disclaimer & Reflection
Before we dive into today's mark down, I want to take a moment to address the previous signal that hit stop loss. As traders, we must acknowledge that losses are part of the process—no matter how solid our analysis may be. I take full responsibility for the outcome, and I appreciate the trust and patience of this community.
Every stop is a reminder that perfection doesn't exist in the markets—only probabilities. What matters most is how we adapt, learn, and continue to evolve.
Let's move forward with clarity and discipline.

Perfect profit on short position, long TP 3450#XAUUSD
Gold is in an upward trend from the daily chart. From the technical indicators, the SMA5-SMA10 moving averages are golden crosses, BOLL opens upward, the K line runs on the upper track of the daily Bollinger Band, and the MACD continues to increase, indicating that the bullish trend remains unchanged📈.
The approaching August 1st tariff deadline, coupled with uncertainties such as the Federal Reserve, provide short-term support for gold🔍.
📊The current lower support is at 3410-3400. If it falls back to this level during the day, you can consider going long. Gradually check 3430 and 3440 on the upside, and pay close attention to the breakthrough of the 3450 level🏅. If it effectively breaks through 3450, gold is expected to break through the historical high. If it encounters resistance near 3450 as in the previous trend, you can consider shorting📉.
🚀BUY 3410-3400
🚀TP 3430-3440
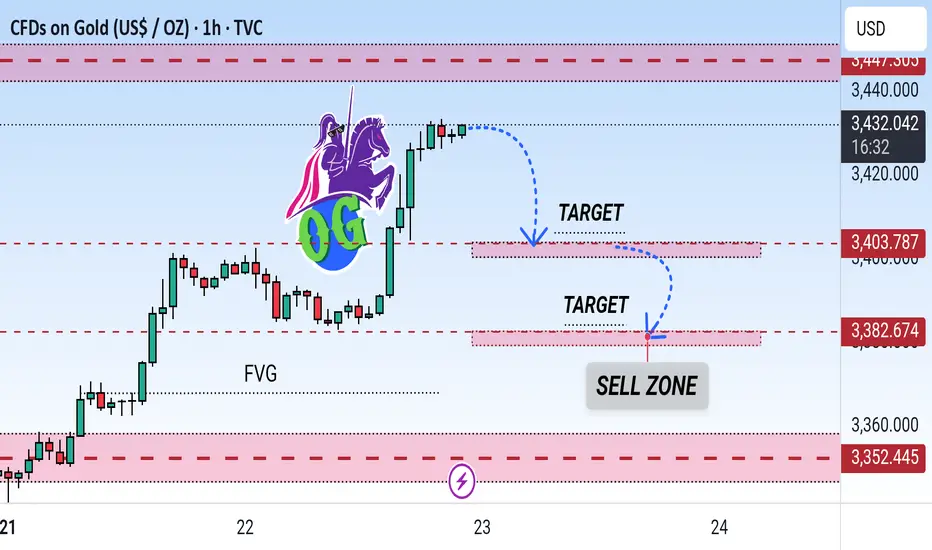
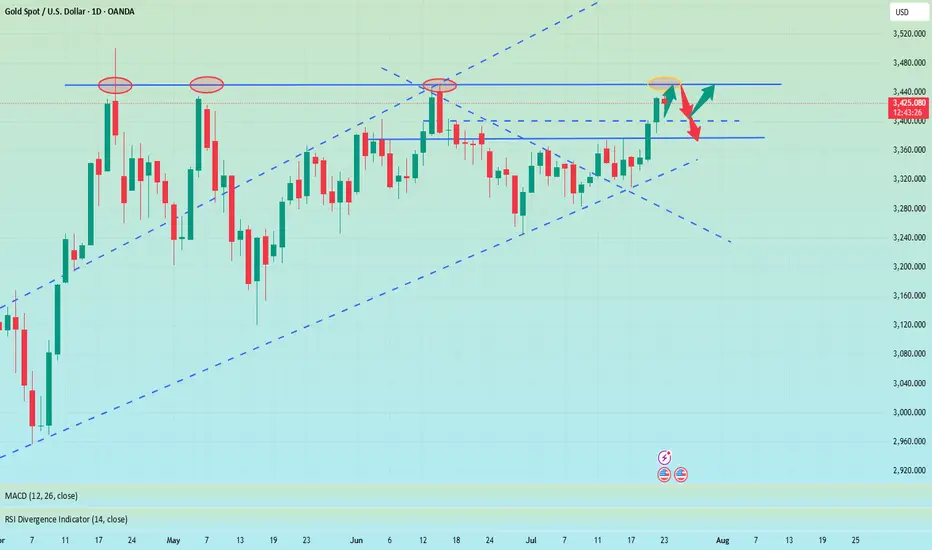
Gold (XAU/USD) 1H Analysis: Sell Zone Identified with Downside This chart shows a technical analysis of Gold (XAU/USD) on the 1-hour timeframe. Price is approaching a Sell Zone near resistance around $3,431, with two downward target levels marked at $3,403.787 and $3,382.674. The chart also highlights a Fair Value Gap (FVG) suggesting potential bearish retracement.
The callback continuity is poor, and the bulls are still strong📰 News information:
1. Geopolitical situation
2. Tariff retaliation
📈 Technical Analysis:
Trump continued to lash out at the Fed, but seemed to have backed off on whether to remove Fed Chairman Powell. The continuous rise of the gold index, once close to 3440, also ushered in a new high in more than a month. Next, we need to pay attention to whether gold can reach the 3450 mark.
Judging from the daily chart, there were three times when it touched around 3450 and then fell back. If it breaks through and stabilizes above 3450 this time, the historical high of 3500 may be refreshed. If it cannot effectively break through 3450, the probability of subsequent retracement is still very high.
From the hourly chart, the bottom support is almost at 3405-3400. However, the recent rhythm belongs to the consolidation of the Asian and European sessions, the US session has begun to rise, and the risk of serious overbought data indicators is still there. This is why I told everyone in the morning that we need to be vigilant about the current rise. Waiting for a pullback to go long is relatively more stable. I also explained in the morning that if it falls below 3405-3400, the decline may continue to around 3385. After all, the fundamental purpose of our trading is to make a profit, so we must minimize the foreseeable risks to the greatest extent possible.
On the whole, if there is an obvious stop-loss signal at 3405-3400, you can consider going long and looking at 3450. Once it falls below 3400, don't chase it easily, and pay attention to the possibility of a retracement below 3385.
🎯 Trading Points:
BUY 3405-3400
TP 3440-3450
In addition to investment, life also includes poetry, distant places, and Allen. Facing the market is actually facing yourself, correcting your shortcomings, facing your mistakes, and exercising strict self-discipline. I share free trading strategies and analysis ideas every day for reference by brothers. I hope my analysis can help you.
FXOPEN:XAUUSD OANDA:XAUUSD FX:XAUUSD FOREXCOM:XAUUSD PEPPERSTONE:XAUUSD TVC:GOLD
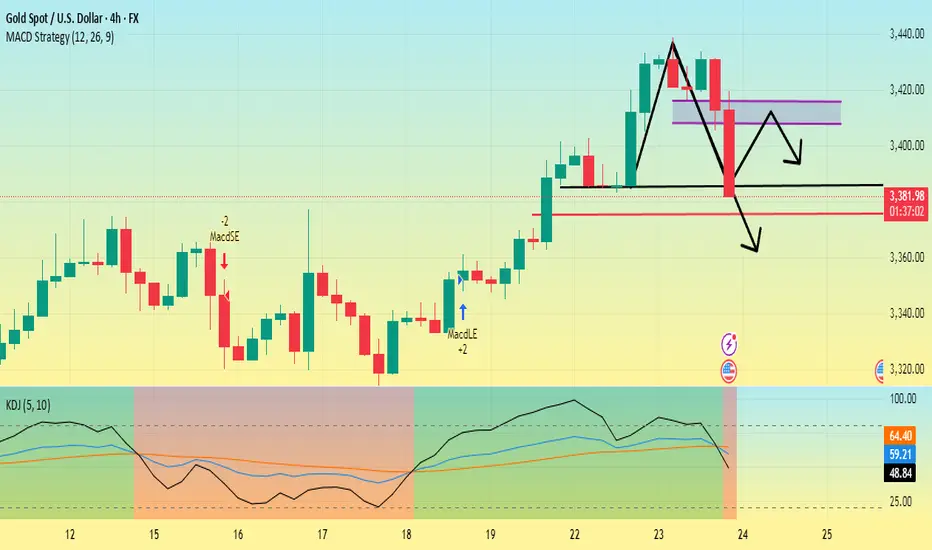
Gold is going down. Can it break through?First, we can look at the daily chart,Currently, the support below the gold daily chart is around 3385, which is also the low point on Tuesday. The current price drop has already touched the support near 3385.
Secondly, from the 4-hour chart, the low point of yesterday's US market retracement was around 3405, and the high point on Monday was 3400. So the first pressure point of this price correction is 3400-3410, followed by the suppression position near 3420.
The 4-hour chart shows that the gold price fluctuated in the 3410-3440 range in the early stage, the MACD red column shortened, and the KDJ dead cross began to appear, facing the pressure of correction in the short term.
At present, the main focus is on whether the 3385 support line can be broken. If it falls below this support level, it will most likely touch around 3375. Then gold will most likely start a downward trend and the rebound will be weak.
Gold is bullish and bearish. Will it continue?From the daily chart:
The moving average is bullish, and the MA5-day, 10-day, and 30-day moving average supports move up. The 3380 dollar has turned from resistance to strong support. If this position is maintained, the upward channel will continue. The support position is 3380-3375, which is the top and bottom conversion position, and is also near the middle track of the Bollinger Band.
From the four-hour chart, the MACD red column shrinks and the RSI is near 60, and the bulls are still dominant. If the price falls back to the 3375-3380 area and stabilizes, it is expected to attack the 3400 mark again.
Operation strategy:
Long operation:
Steady type: When the gold price falls back to the 3375-3380 area, long orders are arranged in batches, with a stop loss of 3365 and a profit range of 3400-3410.
Aggressive: If the price breaks through 3400 quickly and falls back to around 3395, you can chase long with a light position, stop loss at 3388, and the profit range is 3420 strong resistance area.
Short operation:
Resistance area test short: 3408-3415 area, light position short order, stop loss at 3422, profit range 3390-3380.
Break short: If it falls below the 3375 support and the rebound is weak, follow up with short short, profit range 3360, stop loss 3385.

Gold breaks new high, expect a pullback in the evening#XAUUSD
After the rapid rise of the previous day, the gold market has fallen into an overbought state, but yesterday's increase of nearly $60 still provided solid support for the bulls. It is expected that the market will show repeated fluctuations in the future⚖️.
In terms of operation, it is recommended to pay close attention to the gains and losses of the 3,400 mark. If it is successfully broken through, it is expected to further test the 3,420-3,425 and 3,450 lines; on the downside, pay attention to the top and bottom conversion support of 3,403📈.
📊At present, you can consider shorting near 3430, defending 3440, and aiming at 3410💡
🚀SELL 3430-3440
🚀TP 3415-3405
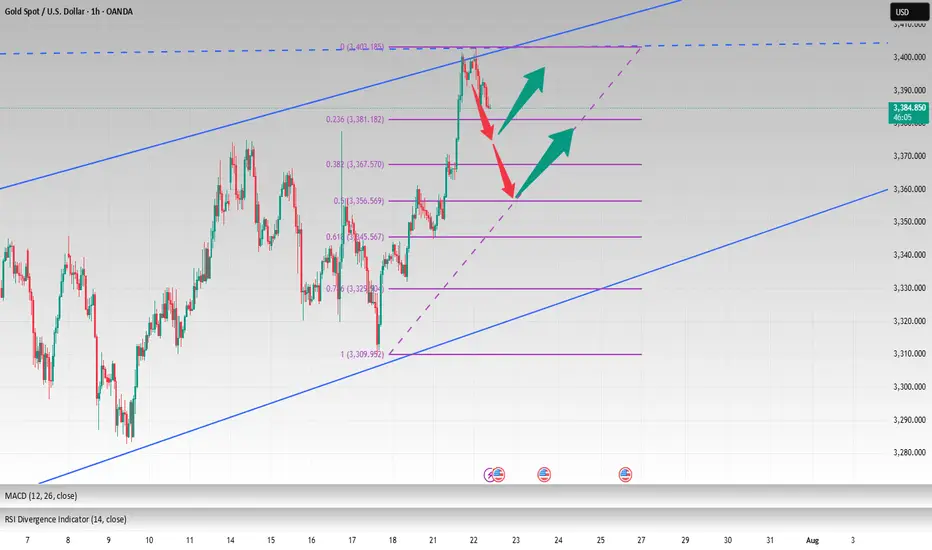
3400 has been reached, wait patiently for a pullback to go longGold opened on Monday with a volatile rise. After breaking through the 3360-65 area, the bulls turned strong. After breaking through the 3375~80 area in the evening, the bulls accelerated their rise, reaching the highest point of 3402. It fluctuated sideways in the late trading, and the daily line closed at around 3397 with a big positive line! Gold temporarily broke the small range oscillation pattern, but the bulls were not strong, and it still fluctuated upward.
From the perspective of the intraday cycle, after yesterday's rapid rise, the market fell into a serious overbought state; however, yesterday's $60 big positive line supported the bulls, and it is expected that the market will fluctuate; the next focus is still the 3400 mark area. The pressure in the 3400~05 area was dense last night, and adjustments may be made at any time before the breakthrough; and since the rise of 3282, it has just touched the upper edge of the parallel channel. The big sweep will continue, but the range is constantly changing!
So although gold broke the recent volatility yesterday and hit the 3400 mark with a big positive line; however, if it cannot stand above it, then it will continue to fall; recently we have repeatedly and many times emphasized the importance of the 3400 mark. If it stands here, the market will gradually rise to 3420~25 and break through to the 3450 area before looking for a decline.
Today we will continue to focus on the 3400 mark area. First, we will rush to the high altitude, with the goal of retracement to the 3375 and 3356 regional support platforms, and then pay attention to long opportunities; if the bulls stand above the 3400 mark, they will further bullishly impact 3420~25 and break through the 3450 area before falling back.
OANDA:XAUUSD
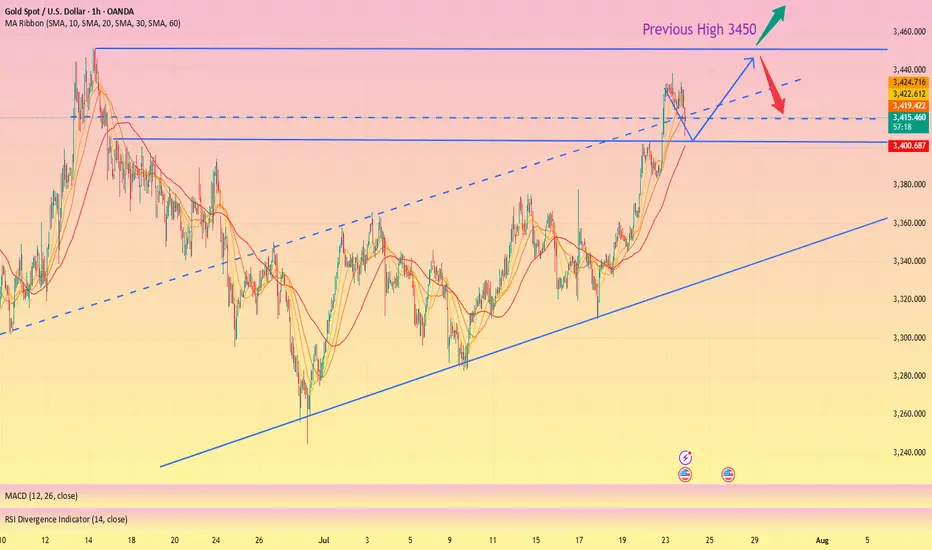
Gold bulls are on the offensive. Can they continue to chase?On Tuesday, as trade tensions and the conflict between the White House and the Federal Reserve continued, the US dollar index continued to fall, and continued to fall in the early US trading, once hitting a low of 97.28. Gold also continued to rise, once standing above the $3,430 mark, setting a new high in more than a month. From the current point of view of gold, this week has stood firm at two levels, 3,350 and 3,400. Next, it depends on whether it can continue to stand firm at the 3,450 level.
From the current hourly chart, Monday's high is around 3,400, and yesterday's low of the US market retracement on Tuesday was around 3,405. So theoretically, 3,400-3,405 has become a support position. And from the hourly chart range, the bottom trend line support is also about 3,400-3,405. Therefore, it is not ruled out that it will oscillate and retrace like yesterday, and then rise and stretch again.
Secondly, from the daily chart:
After gold stabilized at 3400, the current daily range has become 3400-3450. As we can see above, there have been three times of falling back after touching 3450. If it breaks and stabilizes above 3450 this time, the historical high of 3500 will most likely be refreshed. On the contrary, if it still cannot break through 3500 this time, the possibility of further pullback cannot be ruled out. For the next operation, I suggest paying attention to 3400-3405.
If it can retreat and stabilize at 3400-3405 during the European session, you can continue to enter the market and go long to around 3450. On the contrary, if it falls below 3400 today, then don't go long, as there may be a possibility of further retreat in the future.

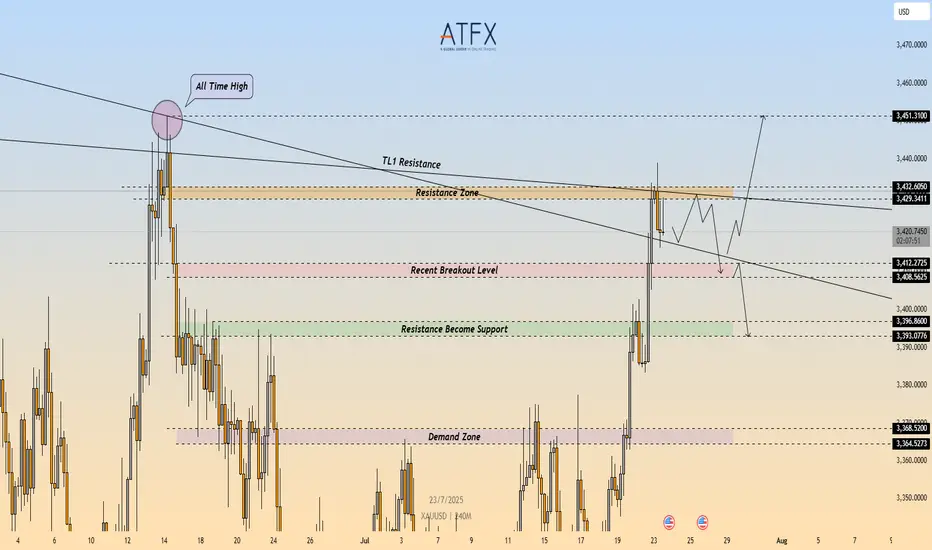
XAU/USD: Bearish Rejection at $3,432 – Short Setup in Play🔴 XAU/USD – Bearish Rejection at Key Resistance Zone ($3,432)
🔍 Technical Outlook
Gold (XAU/USD) failed to break through the $3,429–$3,432 resistance zone, which aligns with a descending trendline (TL1) and prior swing high. The rejection from this confluence zone is reinforcing bearish pressure, with price now carving out lower highs on the 4H timeframe.
A clean break below $3,412 would confirm bearish continuation and open the door toward the $3,400 area, followed by the demand zone at $3,368–$3,365.
🔻 Short Setup
Entry: 3,432
Stop Loss: 3,436
Take Profit 1: 3,412
Take Profit 2: 3,396
R\:R Ratio: ≈ 1 : 6.95
Invalidation: Close above 3,436
📌 Key Levels
Resistance: 3,429 – 3,432
Support 1: 3,412
Support 2: 3,368 – 3,365
Trendline: Long-term descending resistance acting as ceiling
📘 Summary
Gold remains capped beneath a critical resistance cluster. The rejection around $3,432 could trigger a deeper pullback toward $3,396, especially if sellers push price below $3,412. Bearish bias remains valid while price holds under the trendline.
📉 Bias: Bearish
📈 Confirmation Trigger: Break below $3,412
⚠️ Invalidation Level: Above $3,436
GOLD Intraday Chart Update for 23 July 25Hello Traders
First of all i hope you were enjoying yesterday move with 400 Pips Reward
For today we have 3400 Psychological remains in focus if market breaks below 3400 then it will move towards 3364-76 zone otherwise we are remain buyers above 3400 Level
Strong Resistance zone for intraday is at 3445-3465 if market cross 3465 the it will move towards ATH test which is around 3500
Disclaimer: Forex is Risky
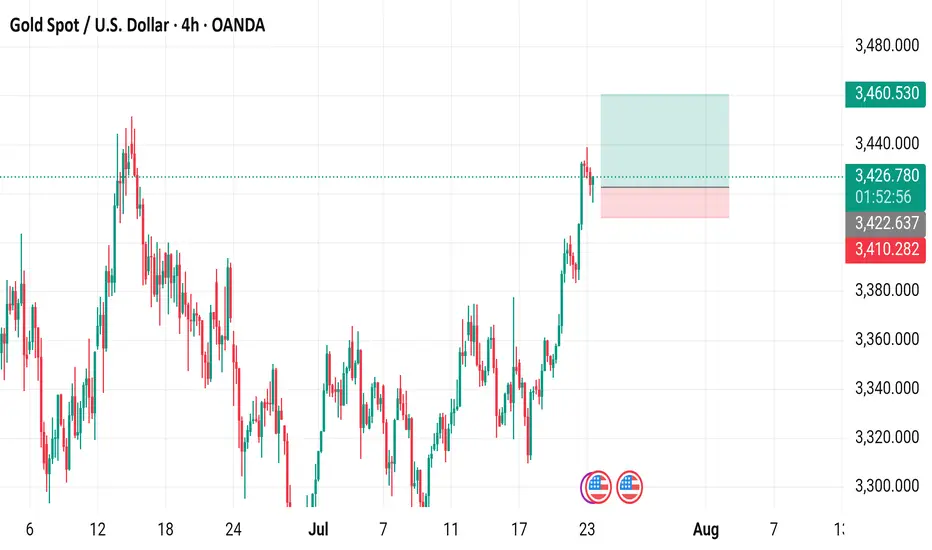
Gold Spot / U.S. Dollar (XAUUSD) - 4 Hour Chart (OANDA)4-hour chart from OANDA displays the price movement of Gold Spot (XAUUSD) from late July to early August 2025. The current price is 3,426.260, with a recent decrease of 5.185 (-0.15%). The chart shows a buy price of 3,426.580 and a sell price of 3,425.950, with a resistance level around 3,460.530 and support near 3,410.282. The data reflects trading activity as of 01:54:22 on July 23, 2025.