7/ 22: Focus on Selling at Highs, Key Support at 3378–3372Good morning, everyone!
I’ve unfortunately injured my lower back and will need to rest in bed for a while, so I’ll keep today’s market commentary brief.
Yesterday, gold rallied to test the 3400 level, a key psychological and technical resistance area that naturally triggered notable selling pressure. Given this, chasing long positions at current levels is not recommended.
On the downside, support is seen near 3378. If this level holds, the price may attempt another rebound. On the upside, key resistance levels to watch are:
3407 as the initial resistance
3416–3423 as the stronger resistance zone
For today’s trading strategy, consider focusing on selling into strength near resistance levels. Once the selling pressure is absorbed, there may be an opportunity to re-enter on the long side at lower levels, allowing for better risk management and entry conditions.
Xauusdsignal

Accurate prediction, continue to buy after retracement to 3353📰 News information:
1. The Trump administration puts pressure on the Federal Reserve to cut interest rates
2. The continued impact of tariffs and the responses of various countries
📈 Technical Analysis:
Gold is currently rising rapidly, reaching a high near 3368, and the overall bullish trend has not changed yet. It is not recommended to continue chasing the highs at present. Those who are long at 3345 can consider exiting the market with profits. The technical indicators are close to the overbought area and there is a certain risk of a correction. Be patient and wait for the pullback to provide an opportunity. At the same time, 3353 has become the position with relatively large trading volume at present, and the top and bottom conversion in the short term provides certain support for gold longs. If it retreats to 3355-3345, you can consider going long again, with the target at 3375-3385. If it falls below 3345, look to 3333, a second trading opportunity within the day. If it falls below again, it means that the market has changed, and you can no longer easily chase long positions.
🎯 Trading Points:
BUY 3355-3345
TP 3375-3385
In addition to investment, life also includes poetry, distant places, and Allen. Facing the market is actually facing yourself, correcting your shortcomings, facing your mistakes, and exercising strict self-discipline. I share free trading strategies and analysis ideas every day for reference by brothers. I hope my analysis can help you.
FXOPEN:XAUUSD OANDA:XAUUSD FX:XAUUSD FOREXCOM:XAUUSD PEPPERSTONE:XAUUSD TVC:GOLD

"Gold Price Bearish Reversal: Key Sell Targets Identified"This 4-hour chart of Gold (XAU/USD) shows a potential bearish reversal pattern forming after a rising wedge breakout. The chart indicates a SELL signal near the $3,392 resistance zone, with three downside targets at:
1. $3,323.773
2. $3,262.540
3. $3,195.497
Highlighted support zones suggest possible price retracements to these levels.

XAUUSD Bullish Signal | Technical + Custom AlgoSmart Trend Signal | Technical Analysis + Custom Algorithm
This signal is the result of a combination of classic technical trend analysis and a proprietary software I personally developed.
XAUUSD:The next target is 3430.The market is developing completely in accordance with the expectations of the band trading center. Today is a day of sharp rise. As Monday, this increase is quite considerable.
The three reminders to buy are all at a lower position. The post clearly points out that the market has reached 3400. 3400 is a controversial position. It needs to fluctuate in the New York market, and then there will be some breakthroughs. If it is stronger, it will directly break through the New York market. In the short term, you can pay a little attention to the retracement position of 3390-3395. Then continue to buy. The next target is 3430.
Gold (XAUUSD) Bullish SetupGold is maintaining its bullish momentum, with price action respecting key support levels. The chart highlights three target levels (TP1, TP2, TP3) marked with green lines, indicating potential zones for profit-taking as the uptrend progresses. A stop-loss is defined below the recent swing low, marked with a red line, to manage downside risk. This setup aligns with the prevailing trend and favors continuation traders.
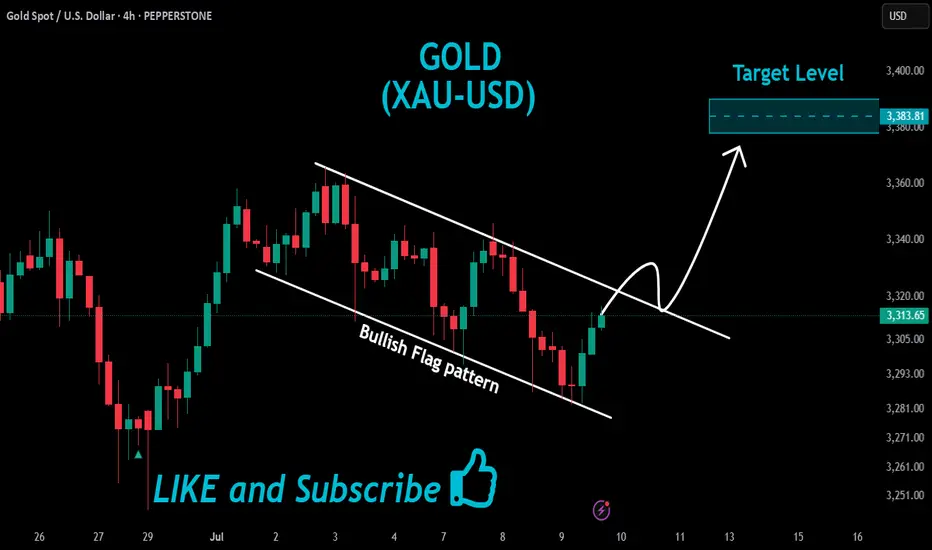
GOLD Wait For Breakout!
HI,Traders !
#GOLD has formed a Bullish Flag pattern
While trading in an uptrend As
we mentioned in a previous analysis
So we are bullish biased and
IF we see a bullish breakout
We will be expecting a
Further bullish move up !
Comment and subscribe to help us grow !
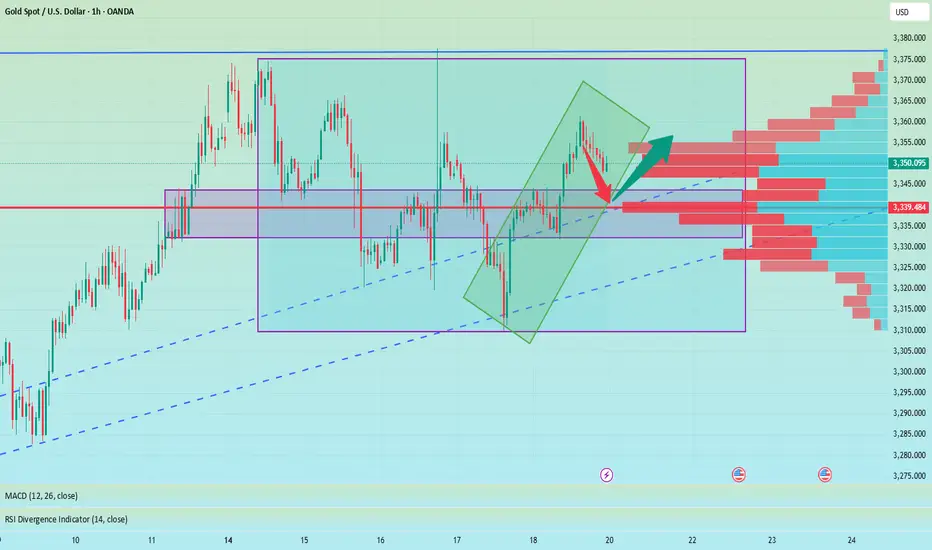
XAUUSD Trade Idea - 30m Structure with 4H ConfluenceCurrently, price is trading below the 4H descending trendline, respecting bearish structure on lower timeframe (30m).
✅ 1H Order Block (OB) marked between 3335-3340 remains a strong demand zone where price can bounce break the trendline to sweep liquidity above around 3377 to form bullish continuation.
📌 Scenarios I'm Watching:
Short-term rejection from the 4H trendline.
Potential reversal towards 1H OB.
Bullish reaction from OB could trigger a breakout above the 4H trendline.
Final upside target remains at the liquidity pool around 3377 zone ($$$).
🟣 Overall Bias: Bullish after liquidity sweep. Watching for bullish confirmation at OB before executing buys.

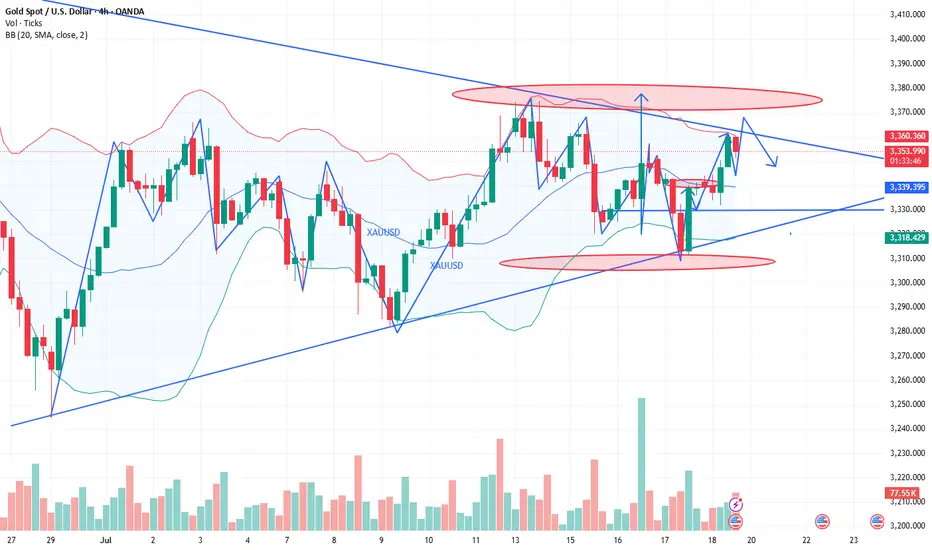
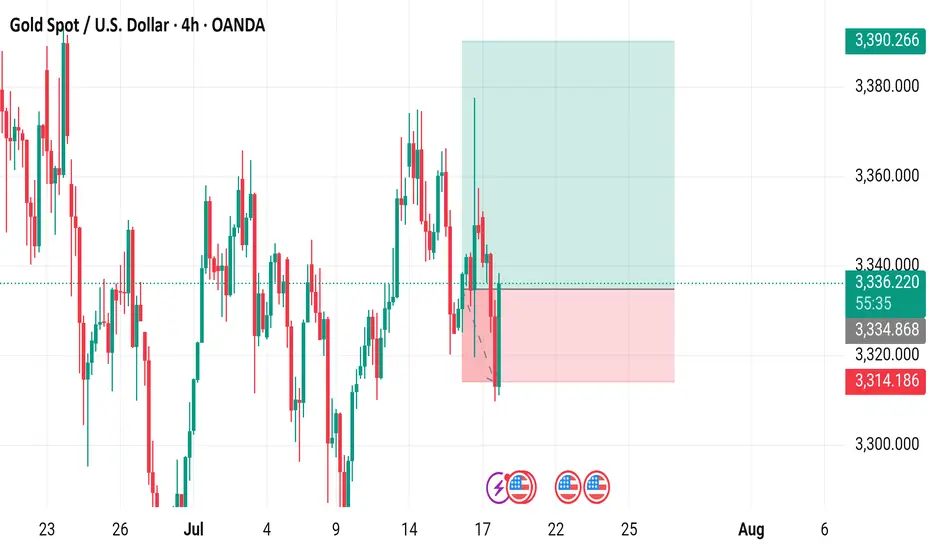
Gold Spot / U.S. Dollar (XAU/USD) 4-Hour Chart - OANDA4-hour chart displays the price movement of Gold Spot (XAU) against the U.S. Dollar (USD) from late July to early August 2025. The current price is 3,390.266, with a recent decrease of 10.870 (-0.32%). Key levels include a sell price of 3,336.420 and a buy price of 3,337.020, with a resistance zone highlighted between 3,340.720 and 3,380.000, and a support zone around 3,314.186. The chart includes candlestick patterns and trading indicators.
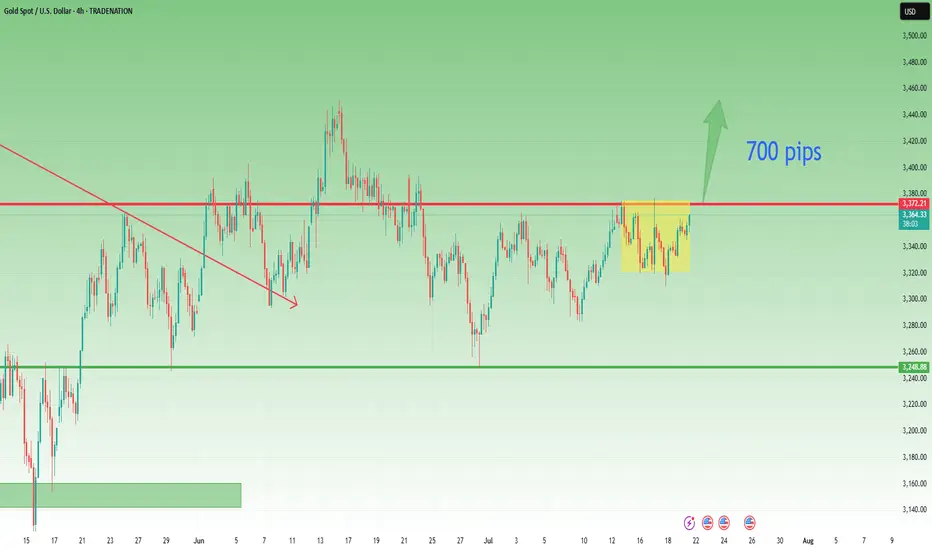
Gold Outlook – The Range Holds, Direction Still Pending📆 What happened recently?
Since the middle of last week, I’ve been repeating the same core idea like a broken record:
👉 “Gold needs to break out of the range to define its next real move.”
And once again, on Friday, TRADENATION:XAUUSD respected the structure, fluctuating quietly and closing the week right in the middle of the range — no breakout, no confirmation.
📈 Current status:
The new week opened with some bullish interest, and at the time of writing, Gold trades around 3363. Still inside the box.
So far, no technical change, and certainly no resolution.
❓ What am I watching for?
A clear break above 3375 → confirms bullish continuation
A decisive break below 3320 → confirms reversal potential
Until then, everything in between is noise and chop.
🧭 Trading plan:
My stance remains unchanged:
⏳ No position. No bias. Just waiting.
Once we get confirmation in either direction, I’ll take action.
📌 Conclusion:
Gold is still locked inside the range. The market is coiling, but no side is winning yet.
Patience here is a weapon — and I’m keeping it loaded. 🚀
Disclosure: I am part of TradeNation's Influencer program and receive a monthly fee for using their TradingView charts in my analyses and educational articles.
Gold is waiting for a pullback to break through 3400In the short term, gold is stuck in a sideways trend near 3365. It is not recommended to enter this point regardless of long or short positions. It is expected that there will be certain variables in the NY period. If gold retreats and falls in the short term as we expect, it may first touch around 3361. If it falls below 3361, it is expected to touch around 3353, which is also the point I gave this morning to see support.
Judging from the market, our focus on the upper side is still the 3375-3385 resistance area. If it can be effectively broken through, it is expected to hit the 3400-3420 mark. Although the daily MACD is oscillating near the zero axis, the 4H market shows that the oscillation is strong. Our trading strategy remains unchanged in the short term. The pullback in the NY period provides an opportunity, and we can consider going long. If there is new news during the day that requires adjustment, I will notify you immediately. Bros, please be patient and wait for trading opportunities.
OANDA:XAUUSD
gold on sell#XAUUSD sell at 3362, the candle is rejecting on bullish which will make retracment on the price.
Entry below 3362 on H1 or M15 closure. Target 3344, stop loss 3372.
Bullish can break following longer candle closure on H1.

Gold returns to its original nature. Price increase towards 3400✏️ OANDA:XAUUSD is back to its inherent uptrend. Currently trading in a wide range. Shaped by CPI news last week. Trendline is still supporting Gold price towards 3400 next week. Pay attention to the important zone 3373 to DCA BUY and do not SELL when breaking this important zone 3373. Effective trading strategy is to wait for Gold to correct and buy.
📉 Key Levels
Support: 3343 - 3322
Resistance: 3373-3400
Buy Trigger: Rejects the support zone 3343 and reacts to the upside
Buy Trigger: Rebound from 3322
Target 3400
Leave your comments on the idea. I am happy to read your views.

XAUUSD Forming descending ChannelXAUUSD Gold has just broken out of a descending wedge formation and is now building bullish momentum. The daily chart shows a clear breakout above the upper channel line, confirming that buyers have taken control. Across the 4‑hour and daily charts, price is holding above key moving averages (20/50/100) and recently formed a bullish hammer—classic signals of fresh upside potential. A fib retracement off the wedge low would likely find support around $3,300–3,320, which already held strong. With immediate resistance in the $3,342–3,350 range, I'm expecting a firm push toward the $3,400 zone next, positioning for a possible continuation to $3,450+.
Fundamentals continue to steer price in our favor. In Q3 2025, gold remains elevated as the U.S. dollar loses steam and rate‑cut expectations rise. The market is pricing in a possible Fed move as early as next month, while tariff and trade uncertainty continues to dominate headlines. Central bank gold purchases remain strong, and investors are seeking safe‑haven shelter amid economic jitters—supporting gold’s role as a defensive asset. With YTD gains nearing 26%, momentum remains firmly bullish.
Looking ahead over the next couple of weeks, the risk/reward remains favorable. If gold holds above the $3,330–3,340 zone, we can remain bullish toward targets $3,400–$3,450. A dip toward that zone would present an attractive long entry, reinforcing our position. However, a breakdown below $3,300 would warrant caution and could introduce a deeper correction.
Given current technicals, fundamentals, and macro backdrop, this setup offers a strong opportunity. With proper risk management and support confirmation, another significant bullish leg toward $3,450–$3,500 is well within reach. Have a profitable trade.

Gold (XAU/USD) Technical Outlook — 21 July 20251. Market Overview & Live Price Confirmation
Gold is currently trading around $3,354, with a daily range of approximately $3,345–$3,359. This places it firmly within its broader uptrend, showing resilience amid recent macro uncertainties and consolidating its position above key support zones.
2. Four-Hour Technical Breakdown
Trend & Structure
The 4-hour chart reveals a strong bullish structure, marked by consistent higher highs and lows. A recent Break of Structure occurred near $3,324, reinforcing the upward bias. A minor Change of Character around $3,360–$3,358 reflects a healthy retracement, but the bigger picture remains strong.
Key SMC & ICT Zones
Supply Zone: $3,360–$3,362 — recent peak area likely to attract sellers and sweep above liquidity.
Demand Zone: $3,340–$3,344 — aligns perfectly with the 38.2% Fib from the $3,308–$3,362 swing, forming a prime area to buy from.
Order Block / FVG Zone: $3,336–$3,342 — open imbalance suggesting price may revisit for efficient entry.
Liquidity Context: Order flow patterns indicate stop hunts around established zones — part of classic Smart Money Concepts.
Fibonacci Levels
38.2% retrace at $3,340, offering medium-term confluence support.
Upside projections via Fibonacci:
1.272 extension: $3,378
1.618 extension: $3,389
3. One-Hour Intraday Trading Setups
Aligned with the 4-hour bullish bias, these setups offer scalable, structured entry opportunities.
Strategy Entry Zone Stop-Loss Take-Profit Risk:Reward
Aggressive Long $3,344 $3,338 $3,358 → $3,362 ~2:1
Conservative Long $3,340 $3,330 $3,362 → $3,378 ~2.5:1
Short Opportunity Rejection @ $3,362 $3,368 $3,344 ~2:1
🌟 The Golden Setup
Buy within $3,340–$3,344 (4H demand + Fib zone + FVG)
Stop-Loss: $3,330
Take-Profit 1: $3,362 (range high)
Take-Profit 2: $3,378 (Fib 1.272)
Why It Works: A confluence of structural support, liquidity zones, and retracement levels gives this setup high predictive quality.
4. Analyst Consensus Snapshot
Market commentary from professional analysts shows alignment with dip-buy strategies. Most recognize the $3,340 region as key support and express caution entering $3,360–$3,375 resistance. Weekly forecasts describe tight trading with potential for breakouts or retracements depending on economic data and Fed commentary, but the medium-term trend remains bullish.
5. Summary & Trading Blueprint
Price Range: $3,345–$3,359 (daily); $3,338–$3,378 (targets)
4-Hour Bias: Bullish, with defined demand and supply zones
Golden Trade: Buy $3,340–3,344 → SL $3,330 → TP1 $3,362 / TP2 $3,378
Catalysts to Watch: Federal Reserve speech, tariff developments, USD movements.
6. Final Thoughts
Gold continues to demonstrate bullish resilience, supported by both technical structure and macro tailwinds. The $3,340–3,344 zone offers a clear, high-probability entry confluence, while stop placement and profit targets are well-defined. Profit management around $3,360 ensures disciplined scaling or early exits if risk factors emerge.
By blending price action, Smart Money frameworks, ICT concepts, and Fibonacci confluence—all structured into actionable trade setups—you have a professional-grade playbook ready for deployment.

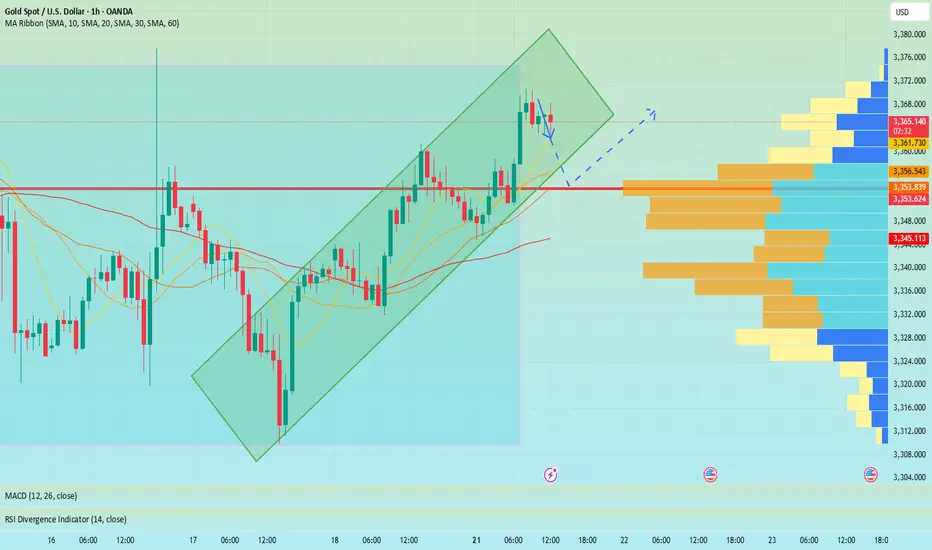
7/18: Watch 3343 Resistance, Guard Against Break Below 3323Good morning, everyone!
Yesterday, gold broke below the 3337 support after consolidating there, driven lower by bearish data, and eventually reached the 3323–3312 support zone. A rebound followed, and price has now returned above 3323, which also aligns with the daily MA60.
📌 Key Levels to Watch Today:
Resistance: 3343 / 3352–3358
→ A sustained break above 3343 opens the door for a potential move toward 3366 / 3372–3378;
Support: 3323 / 3312
→ If price remains capped below resistance and weekly close is under 3323, it will signal bearish structural pressure for the medium term.
📌 Trading Strategy:
Trade flexibly within the range of 3358–3343–3332–3323–3312
📌 Important Reminder:
If today’s closing price is below 3323, and you're planning to hold positions over the weekend, it’s safer to lean short. While we can’t predict weekend news, technically, bears have the upper hand, so risk control is essential.
Monday market forecast, pay attention to the 3339 retracement📰 News information:
1. The Trump administration puts pressure on the Federal Reserve to cut interest rates
2. The continued impact of tariffs and the responses of various countries
📈 Technical Analysis:
This week's basic judgment and forecast on the gold market trend were consistent, but on Friday, the overall gold fluctuations were not large. The overall trend of the daily line fluctuated around 3345, and the 3345 line also became a short-term long-short watershed. Although prices are likely to rise more easily than fall in the short term, it should be noted that the three-month adjustment cycle is coming to an end while the fundamentals of the bull market have not changed. It is recommended that you focus on preventing risks from short position operations next week. At the same time, the overall strong shock pattern, the anti-pulling momentum has not reached the top suppression position, and the area around 3339 below is the previous intensive trading area, which constitutes a certain support in the short term. If the market fails to effectively break below next week, it will greatly boost the bullish momentum, and it is not ruled out that there will be a possibility of refreshing the high point near 3380 next week.
On the whole, the short-term focus next week is the 3345-3335 area below. If it falls back to this point, you can consider arranging long orders. The short-term target is 3355-3365, and the strong trend is expected to continue to touch 3375-3385.
🎯 Trading Points:
BUY 3345-3335
TP 3355-3365-3375-3385
In addition to investment, life also includes poetry, distant places, and Allen. Facing the market is actually facing yourself, correcting your shortcomings, confronting your mistakes, and strictly disciplining yourself. I hope my analysis can help you🌐.
TVC:GOLD PEPPERSTONE:XAUUSD FOREXCOM:XAUUSD FX:XAUUSD OANDA:XAUUSD FXOPEN:XAUUSD
Gold market directional biasGold currently in a balance sentiment. Now it continues buy rally. In cot report there is still chance of buy rally. but in the upper side there should be a strong sell zone. we have to prepare for this also.
Gold Strategy: Long in 3320-3330 & TargetsDuring Friday’s (July 18th) US trading session, spot gold traded in a narrow range with a downward bias 😔, currently hovering around 3350.05. Thursday saw spot gold stage a heart-stopping "deep V" move 😲! Driven by the dual catalysts of the US June retail sales surging 0.6% (beating expectations) and initial jobless claims dropping to 221,000, the US Dollar Index once spiked to a monthly high of 98.95, instantly slamming spot gold to an intraday low of 3309.82. Surprisingly, however, gold prices then staged a strong rebound, closing at 3338.86 with a mere 0.25% decline.
This "fake dip" pattern reveals a deep-seated contradiction in the current market – while economic data temporarily supports dollar strength, investors’ inflation concerns triggered by tariffs are forming an "invisible buying force" for gold 💪. The concurrent rise in the dollar and US Treasury yields has indeed weighed on gold prices, yet robust buying interest emerges at every dip window. Behind this phenomenon lies shrewd capital quietly positioning itself. When the 10-year US Treasury yield climbed to a monthly high of 4.495%, gold refused to fall further – this divergence signals significant market 分歧 over the Federal Reserve’s policy trajectory 😕.
Gold Trend Analysis:
Gold remains in a bullish trend 👍. From the daily chart perspective, gold continued its strong upward momentum today, closing with a positive candle. Technically, the MACD bullish energy bars have started to expand, and the KDJ is in a golden cross heading upward, indicating that the overall price is in a strong phase. As long as gold doesn’t break below 3320, the market is expected to continue its upward trajectory, potentially targeting 3375-3400. If it fails to break through, gold may see a minor short-term pullback. If the pullback doesn’t break 3330, gold is likely to gather momentum again to attack 3375; a break below would shift focus to the 3310 support level. As long as 3310 holds, gold remains in a bullish rebound structure. Next week’s broad range is expected to be 3375-3310.
On the 4-hour chart, the KDJ indicator, after being oversold, has started to turn upward and is now in a golden cross. Notably, this upward move has been accompanied by clear medium bullish candles, making KDJ a more reliable indicator here – the potential for continued bullish candles remains high 😃. The MACD fast line is turning upward at a high level, on the verge of another golden cross, with green energy bars continuing to contract and poised to turn red by inertia. Overall, gold’s current trend is either consolidating or rising. Given the clear bullish bias, we can consider firmly going long first, and only observe the possibility of shorting when KDJ approaches the upper 100 level and the MACD fast/slow lines are about to cross.
Focus on buying on pullbacks. The short-term support levels lie at 3330-3320 – as long as these levels hold, they present buying opportunities. If gold rises during the US session, watch whether 3365 and 3375 are broken; a failure to break through could bring pullback space, offering opportunities for short-term short positions.
Gold Trading Strategy 😎: Go long decisively once on the first pullback to the 3320-3330 range 😏, with targets looking at the 3350-3360 range – just wait for profits to roll in 💰!
🚀 Buy @3320 - 3330
🚀 TP 3340 - 3350
Accurate signals are updated every day 📈 If you encounter any problems during trading, these signals can serve as your reliable guide 🧭 Feel free to refer to them! I sincerely hope they'll be of great help to you 🌟 👇

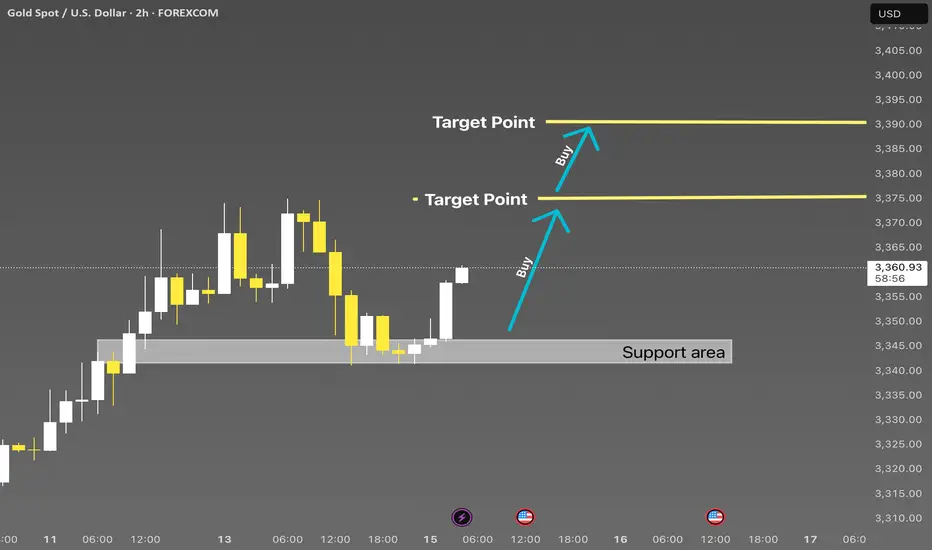
XAUUSD 2H | Smart Money Buy from Strong DemandXAUUSD 2H | Support Rejection with Upside Targets 🎯
Price respected the key support zone and is now showing bullish momentum. Two clear target levels are marked above. Ideal buy opportunity after rejection confirmation from demand zone. Watch for clean continuation toward 3370 and 3390.
#XAUUSD #GoldAnalysis #SmartMoneyConcepts #SMC #Forex #PriceAction #BuySetup
Gold Elliott Wave Bearish SetupGold 8H Analysis:
The chart shows a potential Elliott Wave pattern completing its 5th wave. After hitting resistance near 3383, price reversed at point (4) and is projected to drop toward the support zone near 3281. Bearish momentum expected.

Double Top + Zigzag Complete: Are Bears About to Take Over Gold?Yesterday, the financial markets in general, including Gold ( OANDA:XAUUSD ) , acted like a roller coaster after the news of Powell's dismissal . After this news was denied , Gold returned to its main trend, which I published in my previous idea .
Gold is currently re-attacking the Support line , Support zone($3,326-$3,325) and 50_SMA(Daily) .
In terms of classic technical analysis , it seems that gold has formed a Double Top Pattern for support breakdowns, where a Support line breakdown can also be accompanied by a neckline breakdown .
From the perspective of Elliott Wave theory , it seems that Gold has managed to complete the Zigzag Correction(ABC/5-3-5) , and we should wait for the next bearish waves .
I expect Gold to break its supports and move towards $3,290 ; support breaks are best done with high momentum . An important price that can change the direction of Gold's downside is $3,350 .
Note: If Gold breaks the Resistance lines and forms an hourly candle above $3,351(Stop Loss (SL)), we can expect further Gold gains.
Gold Analyze (XAUUSD), 2-hour time frame.
Be sure to follow the updated ideas.
Do not forget to put a Stop loss for your positions (For every position you want to open).
Please follow your strategy; this is just my idea, and I will gladly see your ideas in this post.
Please do not forget the ✅ ' like ' ✅ button 🙏😊 & Share it with your friends; thanks, and Trade safe.

How to operate the gold market opening next MondayAnalysis of gold market trends next week:
Analysis of gold news: Spot gold fluctuated and rose in a narrow range during the U.S. market on Friday (July 18), and is currently trading around $3,354.05 per ounce. On Thursday, spot gold staged a thrilling "deep V" market. Under the dual stimulation of the U.S. retail sales data in June exceeding expectations by 0.6% and the number of initial jobless claims falling to 221,000, the U.S. dollar index once soared to a monthly high of 98.95, instantly suppressing spot gold to an intraday low of $3,309.82 per ounce. But surprisingly, the gold price then rebounded strongly and finally closed at $3,338.86, down only 0.25%. This "fake fall" market reveals the deep contradictions in the current market-although economic data temporarily supports the strengthening of the U.S. dollar, investors' concerns about inflation caused by tariffs are forming a "hidden buying" of gold. The joint rise of the U.S. dollar and U.S. bond yields did suppress gold prices, but strong takeover orders emerged in each falling window. Behind this phenomenon, smart money is quietly making plans. When the 10-year U.S. Treasury yield climbed to a monthly high of 4.495%, gold refused to fall further. This divergence suggests that the market has serious differences on the direction of the Fed's policy.
Technical analysis of gold: After the opening yesterday, gold continued to fall slowly, and the negative impact of the unemployment data in the U.S. market further suppressed the bullish momentum. The lowest price in the U.S. market reached 3310, and the cumulative decline for the whole day exceeded 30 US dollars. But the key is that gold rebounded again at midnight, forming a wide range of fluctuations on Thursday, which was completely in line with expectations. The 3310 bottom-picking and long-term strategy given during the session successfully captured large profits in the band. This trend once again verified the core judgment of this week: gold is in a high-level fluctuation dominated by a bullish trend, and the practical value of this view continues to highlight. After clarifying the current dual attributes of "bullish trend + volatile trend", Friday's trading needs to focus on the effective profit space within the range. It is expected that the 3375-3310 large range will be difficult to break this week, and the small range can be locked at 3355-3320. Before the range is broken, high-selling and low-buying operations can be performed.
.
The technical side shows that the daily line and the 4-hour Bollinger Bands are closed synchronously. At this time, there is no need to worry about the direction, and effective trading can be achieved by keeping a close eye on the range boundary. It is worth noting that the 4-hour moving average system has obvious upward divergence characteristics. Continuing the rebound momentum at midnight on Thursday, gold still has room to rise today, and the upper target is 3360-3365. The small cycle support is clear: 3330 and 3320 are not broken, both are good opportunities for long positions. During the US trading session, it is necessary to pay attention to the breaking of the 3365 and 3375 resistance levels: if the pressure is not broken, there will be room for a decline, and short-term short positions can be tried. On the whole, Charlie suggests that the short-term operation strategy for gold next week should focus on buying on pullbacks and buying on dips, supplemented by rebounds and selling on highs. The short-term focus on the upper side is the 3375-3385 line of resistance, and the short-term focus on the lower side is the 3340-3330 line of support. FX:XAUUSD ACTIVTRADES:GOLD VANTAGE:XAUUSD TVC:GOLD ICMARKETS:XAUUSD CMCMARKETS:GOLD SAXO:XAUUSD