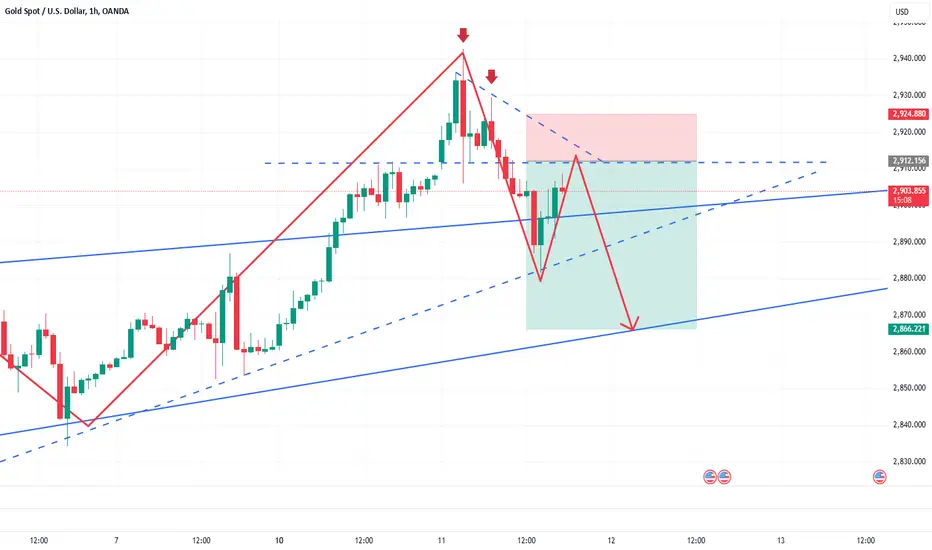
Short gold after reboundDear Traders,
After retracing to the 2881 level, gold has rebounded and is currently extending its recovery above 2907. It is evident that as prices push higher, bearish forces are actively countering the move, and some profit-taking is taking place. The candlestick chart shows clear rejection signals near the 2942 and 2929 levels, indicating notable selling pressure and fear-induced resistance at higher levels.
For short-term trading, short positions can be considered within the 2910-2920 range. I believe that before resuming its uptrend, gold may still need to retest the validity of the 2900 support level. Furthermore, if downside momentum persists, there remains a possibility of further testing the 2870-2860 region.
Bros, do you have the courage to short gold with me? If you want to learn more detailed trading ideas and get more trading signals, you can choose to join the channel at the bottom of the article to make trading no longer difficult and make making money a pleasure!
Xauusdsignals
Continue to buy goldDear traders,
From the gold candlestick chart, it is evident that the bulls are still in control. However, after reaching 2943 today, gold experienced a sharp pullback, indicating either a bearish counterattack or profit-taking by long positions. As gold prices rise and external factors come into play, market volatility has intensified, leading to an increasingly fierce battle between bulls and bears, making short-term trading more challenging.
Currently, gold has retraced from the 2943 high but has not yet disrupted its overall bullish structure. Based on the current price action, as long as gold holds above the 2905-2895 support zone, there are no clear technical signals indicating a trend reversal. At least until the release of CPI data, gold is unlikely to shift its trend decisively. With no confirmed topping signals, gold still holds the potential for further upside.
For short-term trading, if gold retraces to the 2905-2895 region and holds above this level, long positions can be considered. However, traders should remain cautious—if gold breaks below this support zone, a deeper correction toward the 2870-2860 area could be expected.
Bros, would you choose to be long gold like me? If you want to learn more detailed trading ideas and get more trading signals, you can choose to join the channel at the bottom of the article to make trading no longer difficult and make making money a pleasure!

GOLD Bullish Breakout!
HI,Traders !
GOLD made a bullish
Breakout while trading
In a strong uptrend so
We are bullish biased
And we will be expecting
A further bullish move up!
Comment and subscribe to help us grow !
Advocate continuing to short goldIf you have been following my trading strategy, you should be aware that I have already initiated short positions around the 2900 level. Currently, gold is trading near 2910.
After reaching the 2905 level, gold unexpectedly failed to produce a meaningful pullback and instead extended its rally beyond 2910. However, the bullish momentum is gradually losing steam, and gold is approaching short-term trendline resistance. I anticipate that once gold tests this resistance level, a retracement toward the 2880 region, or even as low as 2860, remains a strong possibility.
On the other hand, despite gold’s strong uptrend, we must remain cautious about macroeconomic factors. If the Trump administration continues to advocate for a strong U.S. dollar policy, potential intervention in the gold market cannot be ruled out, which could pressure gold prices.
From a short-term trading perspective, I do not recommend chasing longs at this level. I am still holding my short positions initiated around 2900 and have just added to my short exposure above 2910, anticipating a corrective pullback as projected.
Bros, have you followed me to short gold? If you want to learn more detailed trading ideas and get more trading signals, you can choose to join the channel at the bottom of the article to make trading no longer difficult and make making money a pleasure!

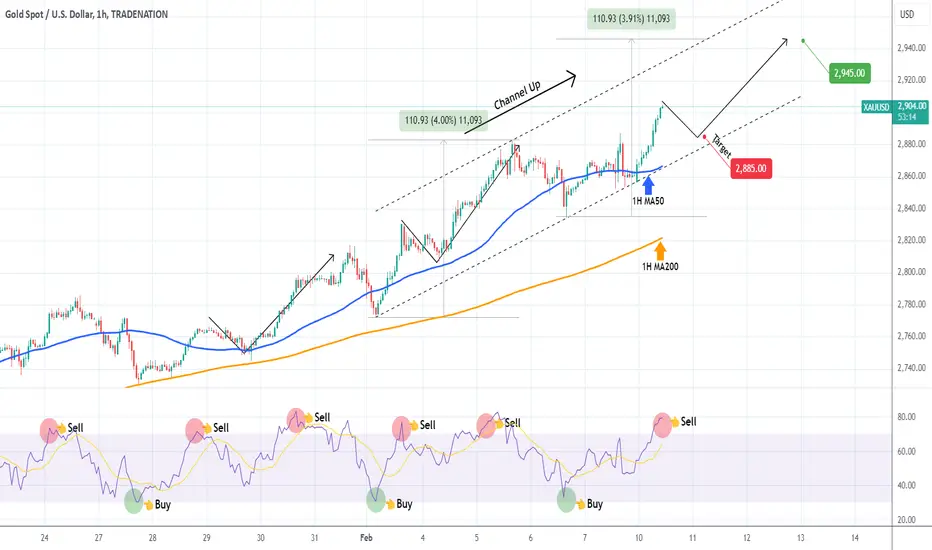
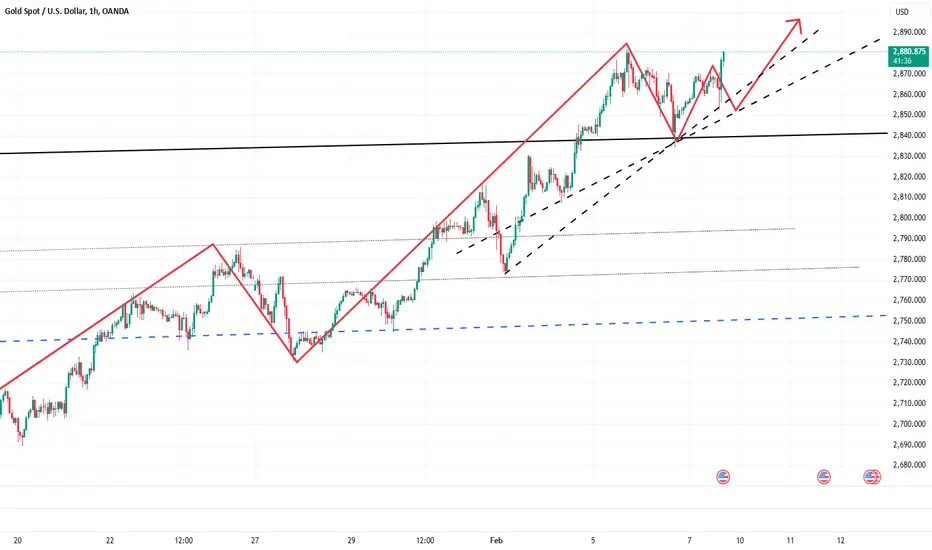
XAUUSD correction to the 1H MA50 technically needed.Gold (XAUUSD) stayed unaffected by the Tariff War, as we mentioned on last week's analysis (Feb 03, see chart below) and easily hit our 2845 Channel Up Higher High Target:
This time a new, more aggressive Channel Up, on the 1H time-frame has emerged and is already on its 2nd Bullish Leg. Technically, the 1H RSI being overbought at 80.00, calls for a short-term correction.
We expect a technical pull-back to the 1H MA50 (blue trend-line), which will be the next buy entry fir the final +3.90% run and a Channel Up Higher High at 2945.
-------------------------------------------------------------------------------
** Please LIKE 👍, FOLLOW ✅, SHARE 🙌 and COMMENT ✍ if you enjoy this idea! Also share your ideas and charts in the comments section below! This is best way to keep it relevant, support us, keep the content here free and allow the idea to reach as many people as possible. **
-------------------------------------------------------------------------------
Disclosure: I am part of Trade Nation's Influencer program and receive a monthly fee for using their TradingView charts in my analysis.
💸💸💸💸💸💸
👇 👇 👇 👇 👇 👇
Start shorting gold before the marketGood morning, dear traders! A new trading week has begun!
Last week, I consistently emphasized in my trading strategy that gold still had the potential to rally towards 2900. Since the market opened today, gold has accelerated its upward move, approaching 2900, which suggests a short squeeze from a technical perspective. Additionally, in my trading outlook shared on Friday, I specifically pointed out that as gold approaches or tests the 2900 level, we must remain cautious of a potential pullback. If gold fails to decisively break through the 2895-2905 resistance zone, a short-term retracement to the 2880 zone, or even the 2860 level is possible.
In the short term, I will continue to look for short opportunities within the 2895-2905 range, anticipating that gold will pull back as expected, setting us up for a strong start to the trading week!
Bros, do you have the courage to try shorting gold with me? If you want to learn more detailed trading ideas and get more trading signals, you can choose to join the channel at the bottom of the article to make trading no longer difficult and make making money a pleasure!

GOLD (XAUUSD): Your Trading Plan For Next Week Explained
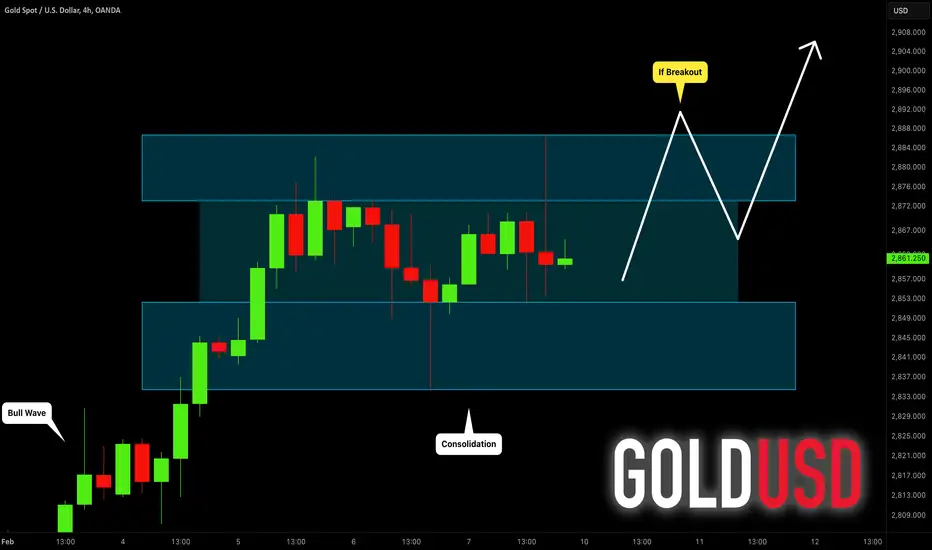
Here is my price action analysis for Gold on a 4H.
The market is currently trading in a sideways after
an extended up movement that was completed 5th of February.
We see a horizontal parallel channel formation.
To confirm the next bullish wave, I suggest waiting for a breakout
of its resistance.
4H candle close above 2887 will confirm the violation.
A bullish continuation will be expected at least to 2900 then.
Alternatively, a bearish breakout of the support of the channel
may trigger a correctional movement.
❤️Please, support my work with like, thank you!❤️
Profit of 130pips, retracement is an opportunity to buy goldDear traders, did you follow my trading strategy and go long on gold in the 2860-2850 zone? As I emphasized in my previous analysis, if gold holds above the 2850-2840 support level during its pullback, it retains the potential to rally toward 2900. Based on this logic, we executed a highly successful trade in the NFP session, going long on gold within the 2860-2850 range as per my outlined strategy.
Following the NFP data release, gold briefly dipped to around 2852 during the retracement. I strictly adhered to my trading plan and entered a long position at 2853. As expected, gold extended its rally above 2880, precisely hitting my projected take-profit (TP) target. This outcome reaffirms the accuracy of my trading strategy, and the gold market has indeed moved in line with my expectations. Cheers to our victory, everyone!
At this point, there are still no clear signs of a market top, and gold may attempt to test the 2900 level. However, as it approaches or touches 2900, we must remain cautious about the risk of a potential retracement.
Bros, have you followed me to do long gold? If you want to learn more detailed trading ideas and get more trading signals, you can choose to join the channel at the bottom of the article to make trading no longer difficult and make making money a pleasure!
Gold's Uptrend Nearing Key Reversal Zone—Time to Sell?Gold ( OANDA:XAUUSD ) is creating a new All-Time High(ATH) during these few days; finally, how far can gold continue this upward trend? What do you think?
Educational Note : From the point of view of Technical Analysis , when the asset is forming an All-Time High(ATH) and the previous history of the price is not around the price, the analysis becomes a little difficult, but we must be able to make the best use of the technical analysis tool.
----------------------------------------------------
Gold is entering the Potential Reversal Zone(PRZ) . Also, Gold is facing a Series of Resistance lines that can stop its increase .
From the point of view of Classical Technical Analysis , it seems that Gold is in the Ascending Broadening Wedge Pattern formation. Do you agree!?
Educational Note : An Ascending Broadening Wedge is a bearish technical pattern characterized by higher highs and higher lows that expand over time. It signals increasing volatility and weakening bullish momentum, often leading to a breakdown below support. Traders watch for a confirmed breakdown as a short-selling opportunity.
According to the theory of Elliott waves , Gold seems to be completing microwave 5 of the main wave 5 .
Also, we can see the Regular Divergence(RD-) between Consecutive Peaks.
I expect Gold to start falling after entering the PRZ and at least to the lower line of the wedge pattern and Support zone($2,800-$2,787) .
Note: If Gold breaks the Resistance lines and goes above $2,873, we should expect Gold to increase further.
Be sure to follow the updated ideas.
Gold Analyze ( XAUUSD ), 1-hour time frame.
Do not forget to put Stop loss for your positions (For every position you want to open).
Please follow your strategy; this is just my idea, and I will gladly see your ideas in this post.
Please do not forget the ✅' like '✅ button 🙏😊 & Share it with your friends; thanks, and Trade safe.

NFP, continue to buy goldDear traders,
Gold is currently trading around the 2865 level. To be honest, there are no clear signs of a market top at this stage, which indicates that gold still has upside potential. From a technical perspective, as long as gold holds above the 2850-2840 support zone (yesterday’s low), it retains the potential to continue its rally toward the 2900 level.
However, with the upcoming NFP release, market uncertainty will increase. Even if the data supports further gold appreciation, the sustainability of the move remains uncertain. Additionally, after a prolonged rally, gold may require a corrective pullback for price consolidation. Therefore, it is crucial to lock in profits in a timely manner and avoid excessive greed or unnecessary risk-taking.
From a trading perspective, long positions can be considered around the 2860-2850 support zone.Bros, do you have the courage to join me in continuing to be long gold? If you want to learn more detailed trading ideas and get more trading signals, you can choose to join the channel at the bottom of the article to make trading no longer difficult and make making money a pleasure!
GOLD Resistance Ahead!
HI,Traders !
GOLD is making a local
Rebound but a horizontal
Resistance is ahead at 2860.97
So after the retest we will be
Expecting a local bearish pullback
And a move down !
Comment and subscribe to help us grow !

XAUUSD Buy Limit OrderHey guys
I think we have a CHoCH in 1H TF but still we're bullish in 4H TF. So this area is good to set a buy limit order.
Let's see how the price reacts to this area.
Dear traders, please support my ideas with your likes and comments to motivate me to publish more signals and analysis for you.
Best Regards
Navid Nazarian

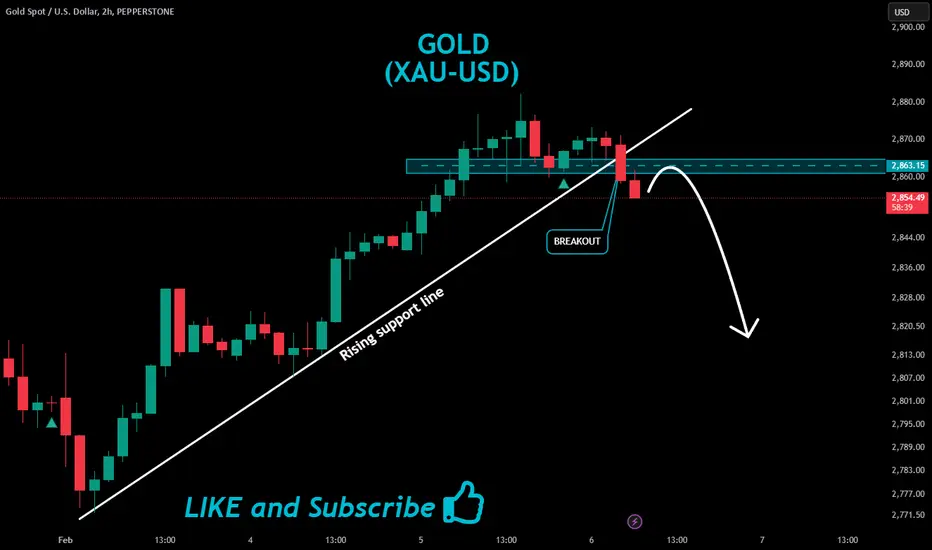
GOLD Will Go Down!
HI,Traders !
GOLD made a bearish
Breakout of the rising support
And is now consolidating
Below the line so we are
Bearish biased and we will
Be expecting a further
Bearish continuation !
Comment and subscribe to help us grow !
Is XAUUSD Gold Overextended? Key Levels to Watch PLUS Trade Idea👀 👉 In this video, we take a detailed look at XAUUSD (Gold). Although the higher timeframe shows a bullish trend, the price is currently trading into resistance and appears overextended. On the four-hour chart, there’s a bearish break in structure. My overall bias remains bullish, but I’m waiting for a break above the current high, followed by a retest and rejection, before considering an entry. This is not financial advice.

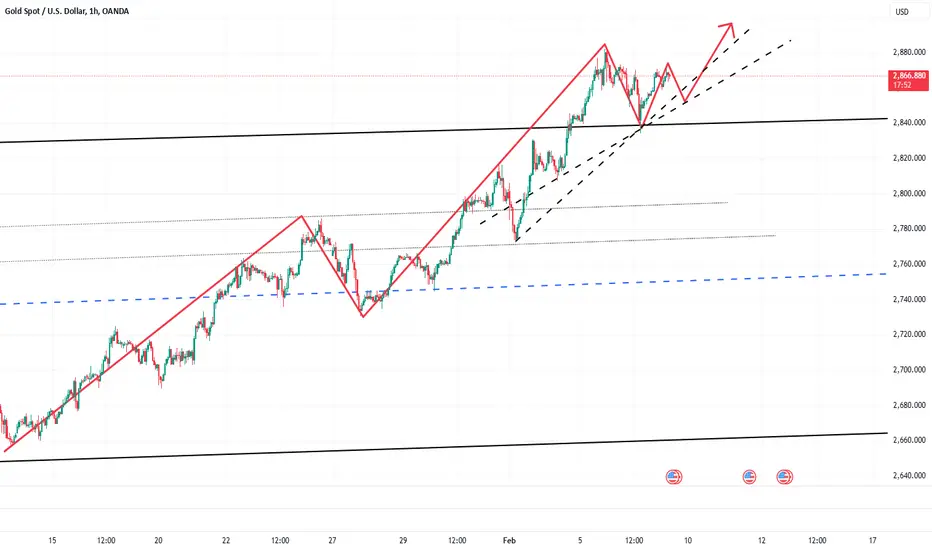
XAUUSD Channel Up unfazed by Tariff War.Gold (XAUUSD) is rising today following the Tariff announcements between the U.S. and their strongest trade partners. This rise is taking place just before the price touched the 4H MA50 (blue trend-line) which has been the absolute Support (hence buy entry) of January's Channel Up for the past month.
With the 4H RSI also making (so far) a V-shaped reversal, similar to all 4 previous Higher Lows of the Channel Up, we believe that this is once more a buy opportunity. All previous bottoms (Higher Lows) rebounded to the 1.618 Fibonacci extension (from High to Low). This gives us a 2845 Target for the next technical Higher High.
-------------------------------------------------------------------------------
** Please LIKE 👍, FOLLOW ✅, SHARE 🙌 and COMMENT ✍ if you enjoy this idea! Also share your ideas and charts in the comments section below! This is best way to keep it relevant, support us, keep the content here free and allow the idea to reach as many people as possible. **
-------------------------------------------------------------------------------
Disclosure: I am part of Trade Nation's Influencer program and receive a monthly fee for using their TradingView charts in my analysis.
💸💸💸💸💸💸
👇 👇 👇 👇 👇 👇

Gold Market Forecast: Next Week’s Trading Setup & Key Price ZoneGold continues to dominate the headlines, trading near all-time highs above $2,800 as market participants grow risk-averse. The White House’s confirmation of 25% tariffs on Canada and Mexico set to take effect on February 1 has sent ripples through the market, adding to the uncertainty.
On the macroeconomic front, December’s Core PCE Price Index—the Fed’s preferred inflation gauge—came in as expected, surpassing November’s numbers. This follows soft Q4 GDP figures and the Federal Reserve’s latest monetary policy meeting, where officials signalled that inflation risks remain tilted to the upside—strengthening the US Dollar and keeping traders on edge.
📉 So, where is Gold headed next? Will we see a breakout to fresh highs, or is a pullback on the horizon?
In this video, I break down my thought process on Gold’s next potential move and how I’m positioning myself for the upcoming trading week. 🚀
📌 Let me know your thoughts in the comments! Do you see Gold continuing its rally, or is a correction due?
#GoldPrice #XAUUSD #GoldAnalysis #GoldForecast #TradingGold #ForexTrading #Commodities #MarketAnalysis #GoldBreakout
Disclaimer Notice:
Trading in the foreign exchange market and other instruments carries a high risk and may not be suitable for all investors. The content provided here is for educational purposes only. Evaluate your financial situation and consult with a financial advisor before making any investment decisions. Past performance is not indicative of future results.

GOLD (XAUUSD): To The New Highs
As I predicted yesterday, Gold updated the ATH
closing above a key resistance cluster.
The market will most likely continue going up.
Next resistance - 2820
❤️Please, support my work with like, thank you!❤️
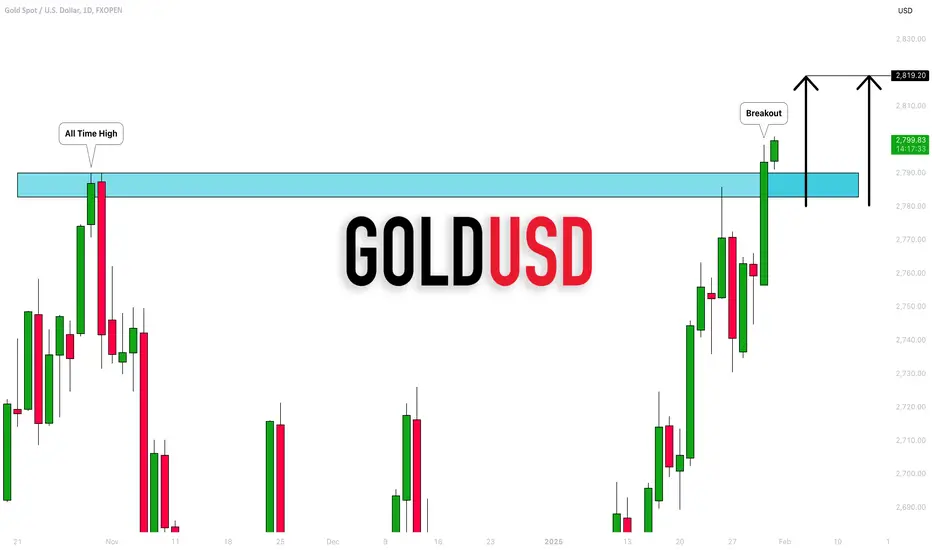
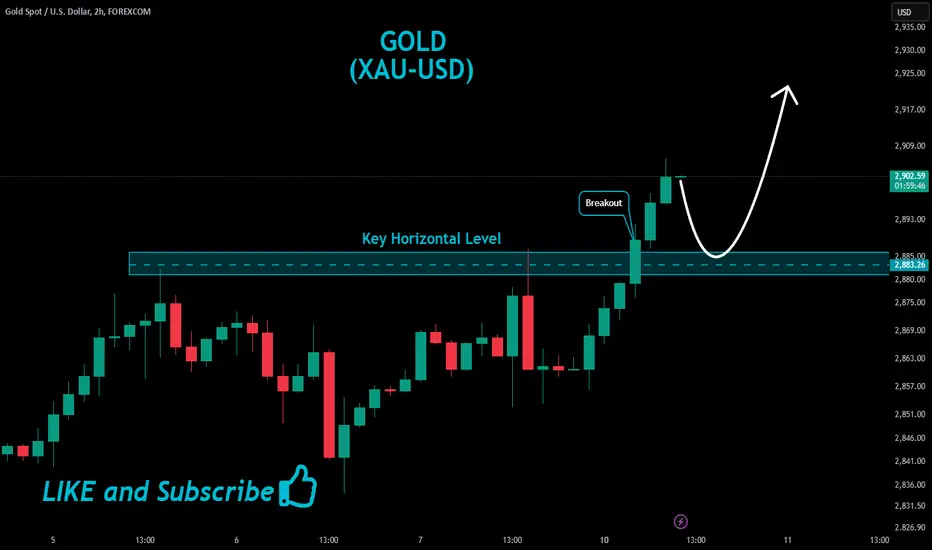
GOLD Strong Breakout!
HI,Traders !
GOLD is trading in an
Uptrend and has Made a bullish breakout of
The key horizontal level
Of 2763.93 and the breakout
Is confirmed so After retesting the level is broken we are
Bullish biased and we
Will be expecting a further
Bullish move up !
Comment and subscribe to help us grow !
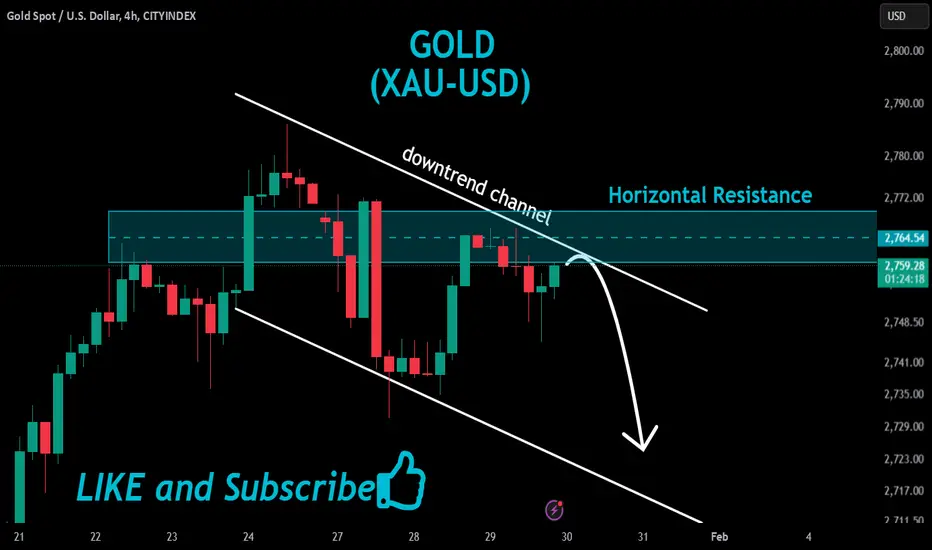
GOLD Resistance Ahead!
HI,Traders !
GOLD is trading in an uptrend but
over the medium term it has formed
a downtrend channel But hit a horizontal
Supply level of 2764.54
From where a local bearish
Correction is to be expected !
Comment and subscribe to help us grow !
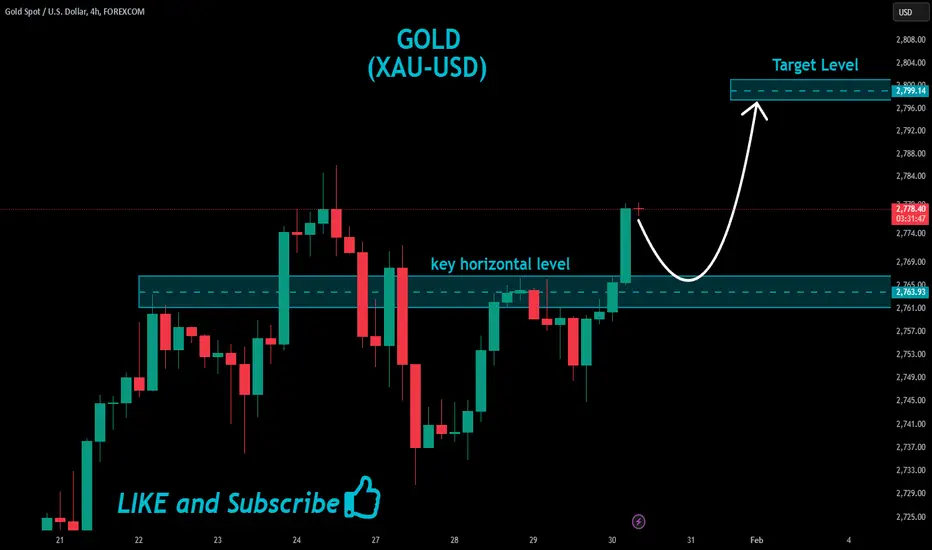
GOLD (XAUUSD): Get Ready For Breakout
It feels like Gold is going to update the All-Time High soon.
I see clear signs of a bullish accumulation on a horizontal
resistance based on a current highest high.
A breakout of the underlined orange area and a candle close above
will indicate the continuation o a global bullish trend.
The market will most likely continue rising at least to 2820.
Alternatively, if you are looking for a bearish confirmation,
a breakout of the support of the channel will give you a strong bearish signal.
❤️Please, support my work with like, thank you!❤️

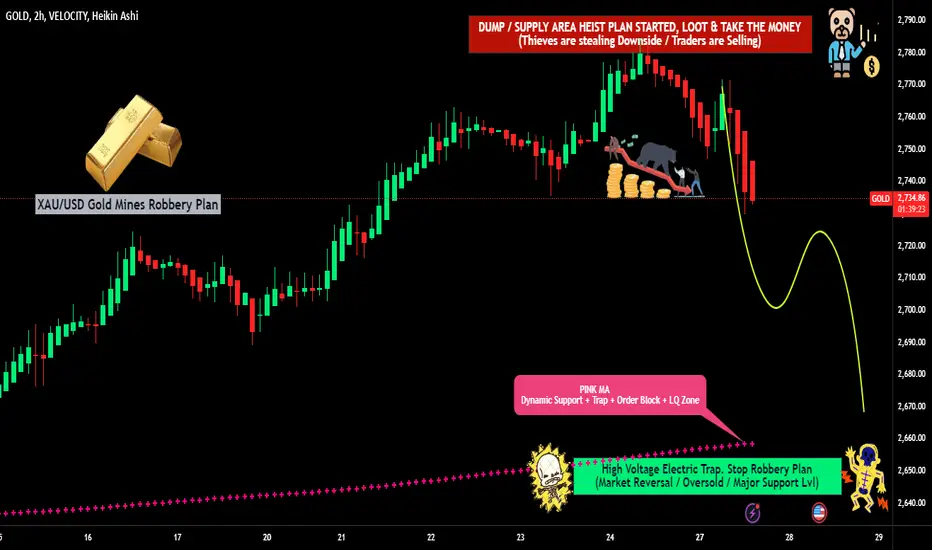
XAU/USD "GOLD vs US Dollar" Metal Market Heist Plan🌟Hi! Hola! Ola! Bonjour! Hallo!🌟
Dear Money Makers & Robbers, 🤑 💰
Based on 🔥Thief Trading style technical and fundamental analysis🔥, here is our master plan to heist the XAU/USD "GOLD vs US Dollar" Metal market. Please adhere to the strategy I've outlined in the chart, which emphasizes short entry. Our aim is the high-risk Green Zone. Risky level, oversold market, consolidation, trend reversal, trap at the level where traders and bullish robbers are stronger. 👀 Be wealthy and safe trade.💪🏆🎉
Entry 📉 : Traders & Thieves with New Entry A Bear trade can be initiated at any price level.
however I advise placing sell limit orders within a 15 or 30 minute timeframe. Entry from the most recent or closest high level should be in retest.
Stop Loss 🛑: Using the 2h period, the recent / nearest high level
Goal 🎯: 2660.00(OR) Before escape in the market
Scalpers, take note : only scalp on the Short side. If you have a lot of money, you can go straight away; if not, you can join swing traders and carry out the robbery plan. Use trailing SL to safeguard your money 💰.
Fundamental Outlook 📰🗞️
The current market sentiment has shifted to bearish, driven by a combination of factors. We update our analysis to reflect the changed market conditions.
🟫Fundamental Analysis:
1. Stronger US Dollar: The US Dollar Index (DXY) has strengthened, making gold more expensive for holders of other currencies.
2. Rising Interest Rates: The Federal Reserve's hawkish tone and rising interest rates have increased the opportunity cost of holding gold.
3. Improved Economic Data: Stronger-than-expected economic data from the US has reduced demand for safe-haven assets like gold.
🟪Macro Analysis:
1. Risk-On Sentiment: The improved economic outlook and reduced geopolitical tensions have led to a risk-on sentiment, reducing demand for gold.
2. Decreasing Inflation Expectations: Falling inflation expectations have reduced the appeal of gold as a hedge against inflation.
🟩Sentiment Analysis
1. Bullish Sentiment: 28% of traders and investors expect XAU/USD to rise.
2. Bearish Sentiment: 58% of traders and investors expect XAU/USD to fall.
3. Neutral Sentiment: 14% of traders and investors expect XAU/USD to trade sideways.
🟨Market Positioning
1. Long Positions: 32% of traders and investors are holding long positions in XAU/USD.
2. Short Positions: 55% of traders and investors are holding short positions in XAU/USD.
3. Neutral Positions: 13% of traders and investors are holding neutral positions in XAU/USD.
🟦Open Interest
1. Increasing: 22% of traders and investors expect open interest to increase.
2. Decreasing: 60% of traders and investors expect open interest to decrease.
3. Stable: 18% of traders and investors expect open interest to remain stable.
🟥Commitment of Traders (COT) Report
1. Hedge Funds Long: 25% of hedge funds are holding long positions in XAU/USD.
2. Hedge Funds Short: 62% of hedge funds are holding short positions in XAU/USD.
3. Hedge Funds Neutral: 13% of hedge funds are holding neutral positions in XAU/USD.
Trading Alert⚠️ : News Releases and Position Management 📰 🗞️ 🚫🚏
As a reminder, news releases can have a significant impact on market prices and volatility. To minimize potential losses and protect your running positions,
we recommend the following:
Avoid taking new trades during news releases
Use trailing stop-loss orders to protect your running positions and lock in profits
🚨Please note that this is a general analysis and not personalized investment advice. It's essential to consider your own risk tolerance and market analysis before making any investment decisions.
🚨Keep in mind that these factors can change rapidly, and it's essential to stay up-to-date with market developments and adjust your analysis accordingly.
💖Supporting our robbery plan will enable us to effortlessly make and steal money 💰💵 Tell your friends, Colleagues and family to follow, like, and share. Boost the strength of our robbery team. Every day in this market make money with ease by using the Thief Trading Style.🏆💪🤝❤️🎉🚀
I'll see you soon with another heist plan, so stay tuned 🫂
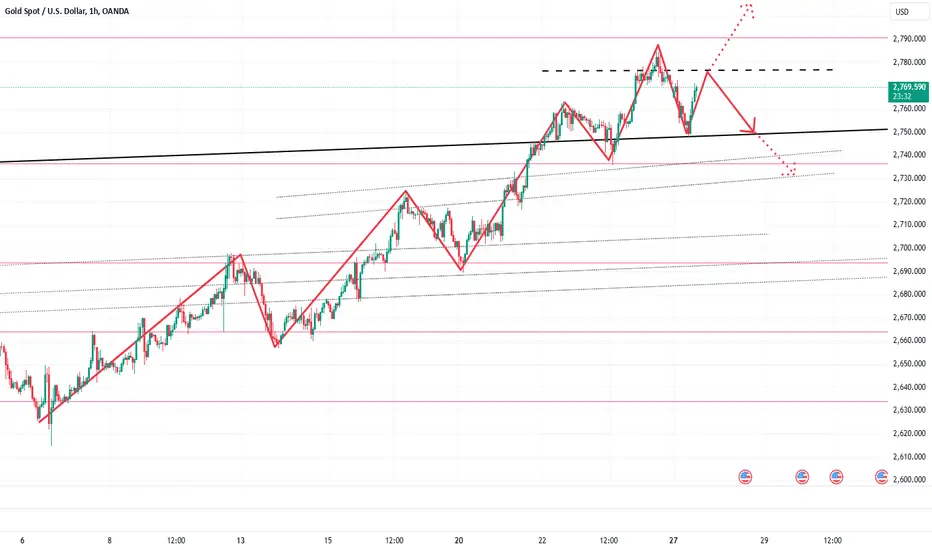
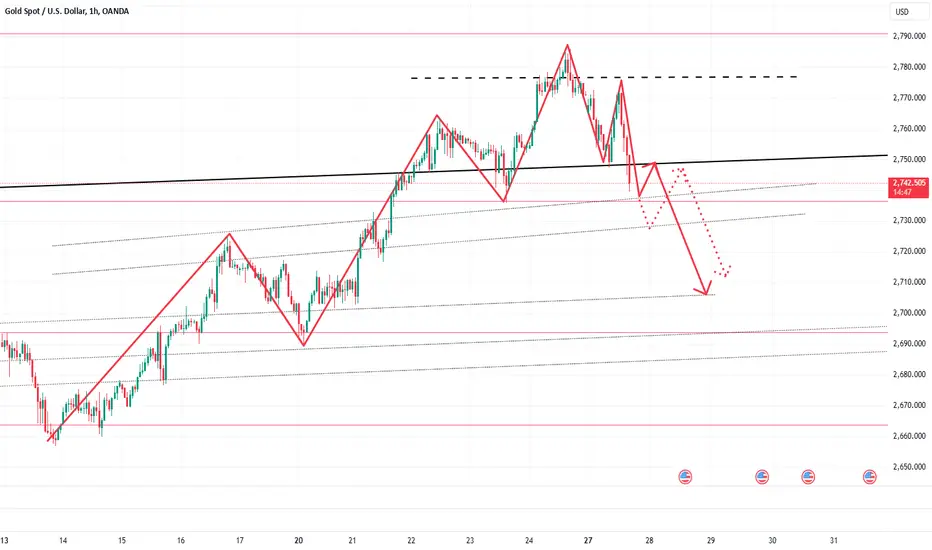
Short gold again after rebounding to 2750-2760 zoneGold has currently retraced to the 2741 level, triggering significant profit realization for our positions. Since gold rallied above 2770 last week, I have consistently maintained a bearish stance, anticipating profit-taking and sell-offs driven by market sentiment. Our short positions have once again delivered substantial returns.
This morning, we initiated long positions near the 2756 level and closed them at 2770, securing an easy profit of 140 pips. As gold approached 2770, I explicitly shared in my previous analysis that if gold failed to decisively break through the 2770-2775 range, I would switch to shorting. Thus, after closing the long positions, I reversed my position and shorted gold near 2770. Gold has since declined as expected to around 2741. Although we closed our short positions near 2753, capturing a profit of 170 pips, I am still satisfied with this result. It's been a strong start to the week's trading!
Currently, gold has bottomed out around 2740. I do not recommend chasing shorts at this level, as the 2740-2730 zone provides notable technical support, which could potentially drive a rebound to the 2750-2760 range. For those looking to short gold further, it’s advisable to wait for a rebound to the 2750-2760 region before executing short trades. Alternatively, a moderate long position could be considered, with a short-term target set between 2750 and 2760.
Bros, have you followed me to do short gold? If you want to learn more detailed trading ideas and get more trading signals, you can choose to join the channel at the bottom of the article to make trading no longer difficult and make making money a pleasure!
Execute the trading direction of goldDear Traders,
As I mentioned in yesterday’s market analysis, if gold does not break below the 2760-2750 support zone during its retracement, it is highly likely to breach the 2800 threshold later this week. Taking advantage of today’s pullback, we initiated long positions near 2756. Although gold briefly dipped to 2747, it quickly rebounded above 2750, indicating the potential for continued upside momentum.
Currently, gold is trading around 2769, and our long positions are already yielding a solid profit. If gold follows the anticipated trajectory and rises further, I will closely monitor its performance in the 2770-2775 zone. Should it struggle to decisively break through this resistance, I may consider a short-term short position to capitalize on a potential pullback.
Bros, do you think gold will break through 2800? If you want to learn more detailed trading ideas and get more trading signals, you can choose to join the channel at the bottom of the article to make trading no longer difficult and make making money a pleasure!