Gold Spot / U.S. Dollar (XAUUSD) 2-Hour Chart - OANDA2-hour candlestick chart displays the price movement of Gold Spot against the U.S. Dollar (XAUUSD) from OANDA, covering the period up to July 22, 2025. The current price is 3,395.285, reflecting a 1.775 (-0.05%) decrease. The chart includes buy/sell indicators (3,395.780 buy, 3,394.890 sell), a highlighted resistance zone around 3,400-3,425, and a support zone around 3,370-3,386. The chart also features technical analysis tools and annotations indicating potential price trends.
Xauusdsignals

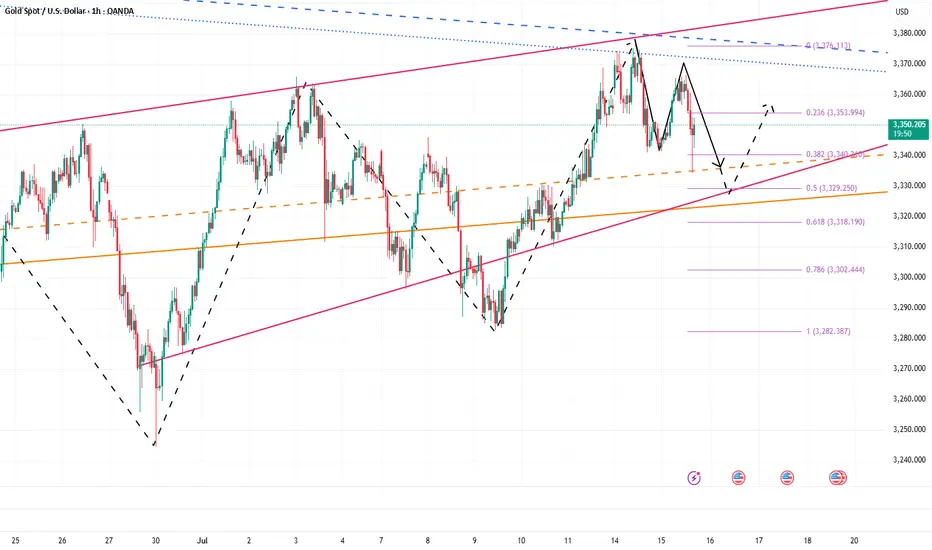
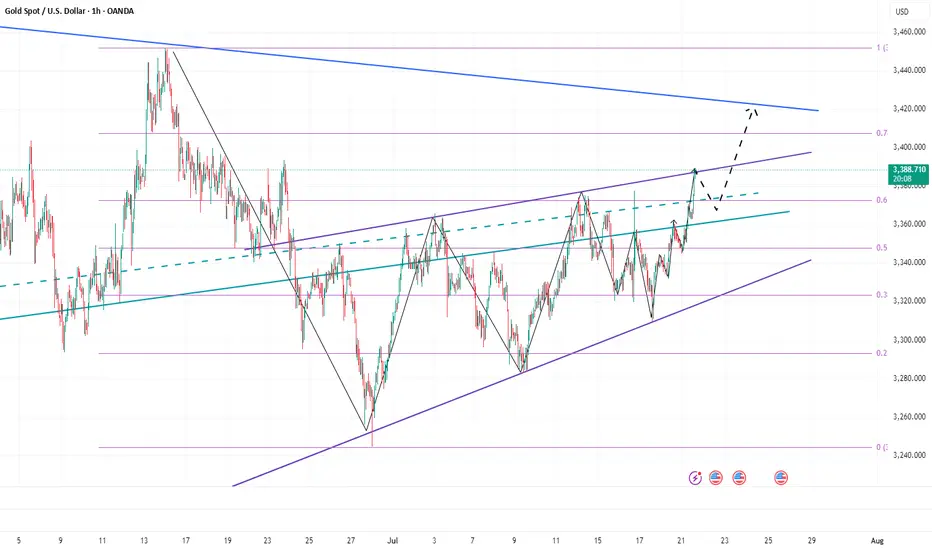
More Pain for Gold? The Charts Say It’s PossibleSince the start of the London market, gold has almost maintained a narrow range of fluctuations in the 3390-3385 area. Compared with yesterday, the market is much weaker today, and gold has failed to stabilize at 3400 several times, indicating that the sentiment of cashing out near this area is also very high. From the current gold structure, gold is obviously biased towards a long structure. Since gold broke through 3400, 3375-3365 has become the key support area after the top and bottom conversion in the short term.
However, gold rose strongly yesterday but did not stabilize at 3400. The bullish sentiment may no longer be strong. Moreover, after the accelerated rise in gold, the sustainability was not strong, so gold still needs to retreat in the short term. This is why I insisted on shorting gold again near 3400 yesterday. Therefore, I think gold has not yet retreated to the right level. I will pay attention to the opportunity to go long on gold after it pulls back to the 3375-3365 area.
Gold fell after touching 3400 twice. Whether a short-term effective "M" double top structure has been formed, I think more signals are needed to verify. However, in the short term, it is still under pressure in the 3405-3410 range, so if there is no major positive news, I think gold may maintain a wide range of fluctuations in the 3410-3360 range. Therefore, if gold rises to the 3400-3410 range again, I will continue to try to short gold!

GOLD Intraday H1 Chart Update For 22 July 2025Hello Traders,
Today we have FED Chair Powell Speech ahead
all eyes on 3400 Psychological Level Break for now, if market successfully breaks 3400 then it will move towards 3435
below 3400 it will move back towards 3350 level
Disclaimer: Forex is Risky

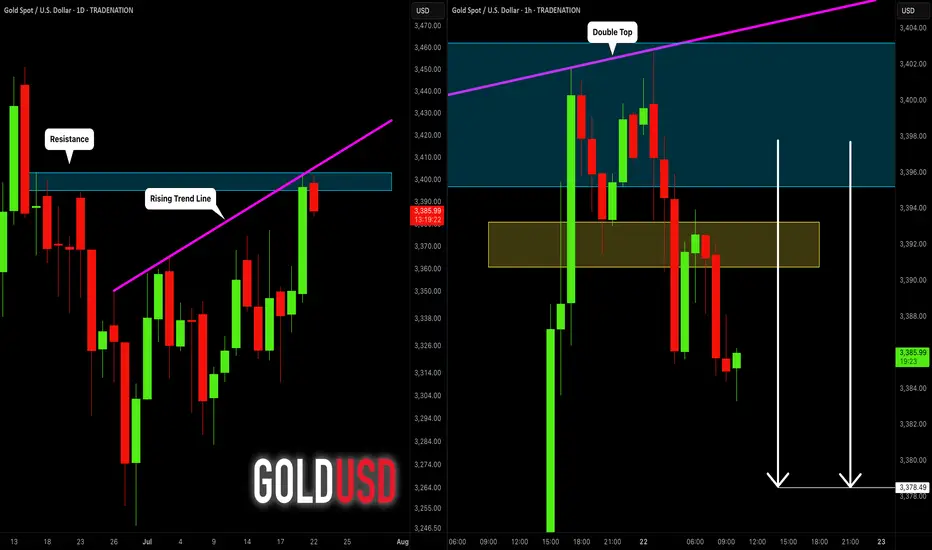
GOLD (XAUUSD): Bearish Move From Resistance Confirmed
Gold tested a significant confluence cluster on a daily time frame
that is based on a rising trend line and a horizontal resistance.
A double top formation on that on an hourly time frame indicates
a highly probable retracement from that.
Goal - 3378.5
❤️Please, support my work with like, thank you!❤️
I am part of Trade Nation's Influencer program and receive a monthly fee for using their TradingView charts in my analysis.
Gold’s Rapid Surge: A Trap Before the Drop?Gold finally showed signs of retreat. We are still holding a short position near 3400. So far, we have made a profit of 50 pips. However, I will still hold it to see if gold can fall back to the 3385-3375 area as expected. We have completed 2 transactions today, and there is still 1 transaction left to hold.
1. First, we bought gold near 3345 and ended the transaction by hitting TP: 3370, making a profit of 250 pips, with a profit of more than $12K;
2. We shorted gold near 3385 and ended the transaction by hitting SL: 3395, with a loss of 100 pips, a loss of nearly $5K;
3. We are still holding a short gold transaction order near 3400, with a current floating profit of 60 pips and a floating profit of nearly $4K;
The above is the detailed transaction situation today. To be honest, today's rebound strength far exceeded my expectations, and after our first long position hit TP, the market never gave any chance to go long on gold after a pullback, but accelerated to around 3401. But obviously, the accelerated rise of gold is suspected of catching up with the top, and in the short term it faces resistance in the 3405-3410 area, and secondly pressure in the 3420-3425 area. So I don't advocate chasing gold at the moment. On the contrary, I am still actively trying to short gold around 3400, first expecting gold to pull back to the 3385-3375-3365 area.
And I think if gold wants to continue to test the 3405-3415 area, or even sprint to the area around 3425, gold must go through a pullback to increase liquidity to accumulate upward momentum. I think it will at least pull back to the 3385-3375 area.
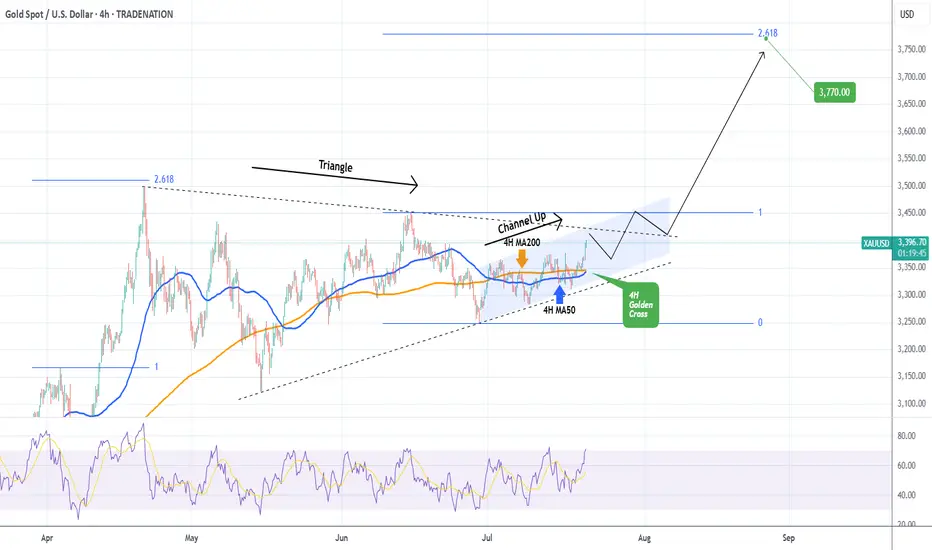
XAUUSD 4H Golden Cross preparing a massive break-out.Gold (XAUUSD) has been trading on a 3-week Channel Up, which is approaching its top but at the same time, it's been trading within a 3-month Triangle, which is also approaching its top.
The key here is the formation today of a Golden Cross on the 4H time-frame, the first since May 28. Being at the end of the long-term Triangle pattern is technically translated to the structure's tendency to look for a decisive break-out above its top that attracts volume (buyers).
It is possible to see an initial rejection followed by a break-out that will re-test the top of the Triangle as Support and then follow the long-term trend dynamics. Those are technically bullish and previous break-out in April targeted the 2.618 Fibonacci extension. Our Target remains a little below it at $3770.
-------------------------------------------------------------------------------
** Please LIKE 👍, FOLLOW ✅, SHARE 🙌 and COMMENT ✍ if you enjoy this idea! Also share your ideas and charts in the comments section below! This is best way to keep it relevant, support us, keep the content here free and allow the idea to reach as many people as possible. **
-------------------------------------------------------------------------------
Disclosure: I am part of Trade Nation's Influencer program and receive a monthly fee for using their TradingView charts in my analysis.
💸💸💸💸💸💸
👇 👇 👇 👇 👇 👇
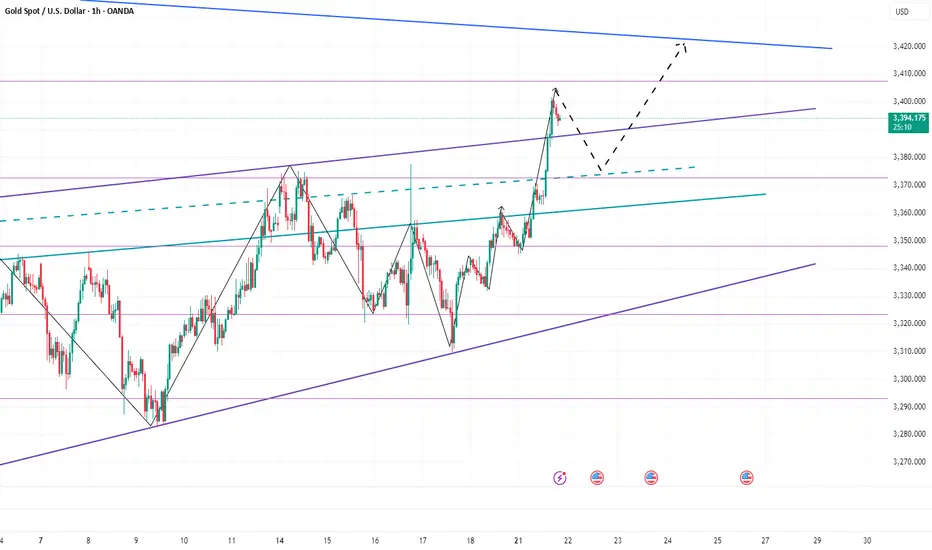
Warning Signs After Gold’s Sharp Rise — Is a Pullback Coming?Today, gold rebounded from around 3345, and has now rebounded to around 3389, which is only one step away from the 3400 mark. Gold has hardly retreated during the rise, and the rise is strong. However, we can see from the small-level candle chart that gold suddenly accelerated its rise after consolidating around 3365, and continued to around 3390, and is now oscillating near the recent high trend line.
After gold accelerated its rise and oscillated near the recent high trend line, this made me have to be more cautious, because we must be careful that the acceleration of gold's rise in the short term is a trap for buyers, so even if we are bullish on gold in the short term, we should not directly chase gold at a high level; according to the current structure of gold, I think it is necessary for gold to retest the 3370-3360 area support before continuing to rise and hitting 3400. Only after verifying that the support in this area is effective can it be conducive to a better rise in gold!
So for short-term trading, I think we can still try to short gold now, and then wait patiently for gold to retest the 3370-3360 area.
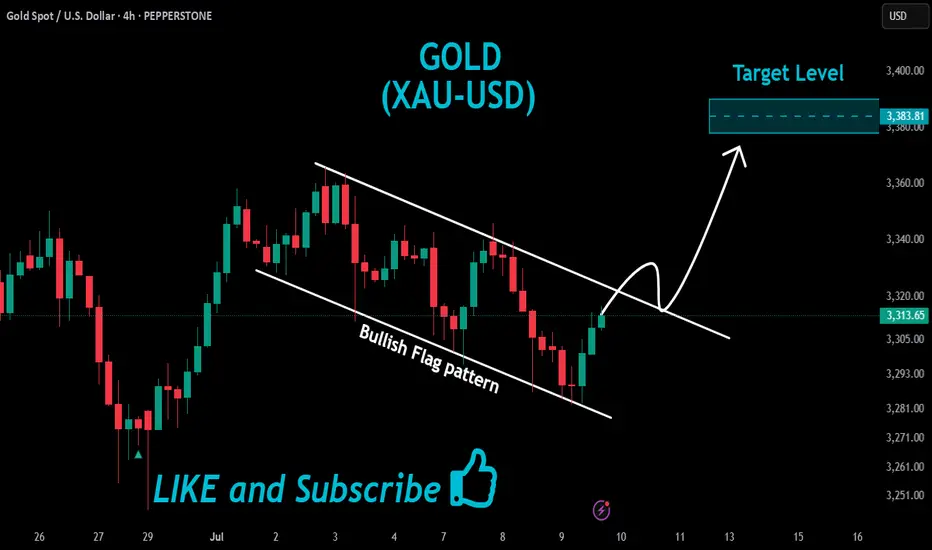
GOLD Wait For Breakout!
HI,Traders !
#GOLD has formed a Bullish Flag pattern
While trading in an uptrend As
we mentioned in a previous analysis
So we are bullish biased and
IF we see a bullish breakout
We will be expecting a
Further bullish move up !
Comment and subscribe to help us grow !
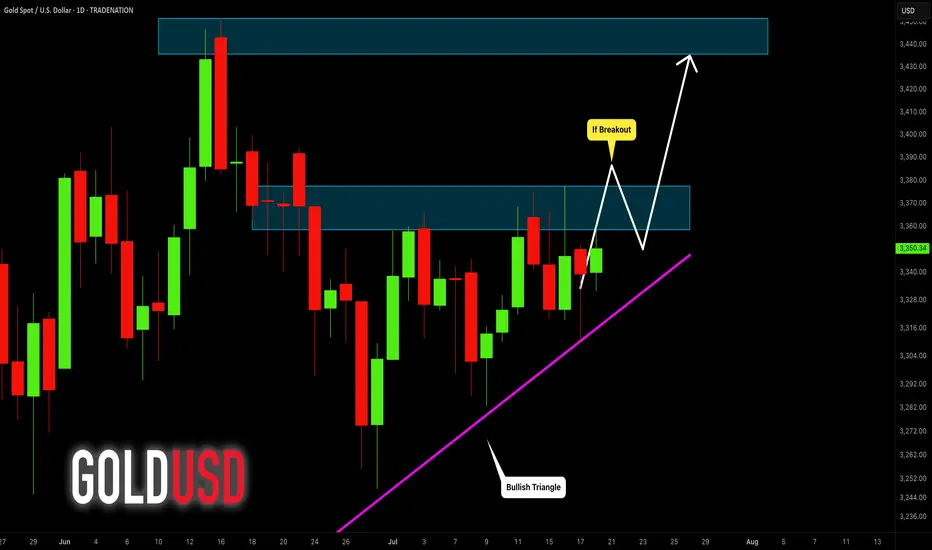
Is This the Start of a New Gold Bull Run?News that must be paid attention to:
1. The Middle East region is in constant conflict and the situation is unstable, which may re-stimulate the market's risk aversion sentiment;
2. Trump strongly called for a rate cut, and many Fed directors agreed to the rate cut. Under the situation of internal and external troubles, can Powell withstand the pressure of rate cuts? In addition, the tense relationship between Trump and Powell, as well as the development of Powell's dismissal storm, have increased the market's risk aversion demand and enhanced the market's bullish sentiment;
3. The uncertainty brought about by the tariff issue may disrupt the market.
Technical aspects:
This week, the gold market is roughly a bottoming out and rebounding trend. We can clearly see from the recent candle chart that the recent trend line suppression is located near 3380, and this week gold has repeatedly encountered resistance and fallen in the 3375-3380 area, which has strengthened the suppression effect of resistance in this area to a certain extent; and gold has repeatedly tested the 3320-3310 area support during the retracement process. Gold has not fallen below the support of this area during multiple retracements, giving the market bulls great confidence.
On Friday, gold hit 3360 during the rebound and closed above 3350, which is strong in the short term. As gold continues to rebound, the current bull-bear dividing line is in the 3345-3335 area. If gold cannot even fall below the 3345-3335 area during the retracement next week, it will greatly boost buying power and is expected to hit the 3380 area again. Once gold breaks through the 3380 area during the rise, there will be a chance to further continue the rise and test 3400, or even the 3420 area.
Therefore, at the beginning of next week, if gold retreats to the 3345-3335 area for the first time, I think we must make an attempt to buy gold, first focusing on the target 3370-3380 area, and then bullish to the 3400-3420 area after a strong breakthrough.

7/18: Watch 3343 Resistance, Guard Against Break Below 3323Good morning, everyone!
Yesterday, gold broke below the 3337 support after consolidating there, driven lower by bearish data, and eventually reached the 3323–3312 support zone. A rebound followed, and price has now returned above 3323, which also aligns with the daily MA60.
📌 Key Levels to Watch Today:
Resistance: 3343 / 3352–3358
→ A sustained break above 3343 opens the door for a potential move toward 3366 / 3372–3378;
Support: 3323 / 3312
→ If price remains capped below resistance and weekly close is under 3323, it will signal bearish structural pressure for the medium term.
📌 Trading Strategy:
Trade flexibly within the range of 3358–3343–3332–3323–3312
📌 Important Reminder:
If today’s closing price is below 3323, and you're planning to hold positions over the weekend, it’s safer to lean short. While we can’t predict weekend news, technically, bears have the upper hand, so risk control is essential.
GOLD (XAUUSD): Sticking to the Plan
Update for my last Sunday's post for Gold.
Previously, we spotted a cup & handle pattern on a daily time frame.
It turned into an ascending triangle pattern - another bullish formation this week.
I am sticking to the same plan - our strong bullish signal is a breakout
of a neckline of the pattern and a daily candle close above 3378.
It will confirm a strong up movement.
❤️Please, support my work with like, thank you!❤️
I am part of Trade Nation's Influencer program and receive a monthly fee for using their TradingView charts in my analysis.
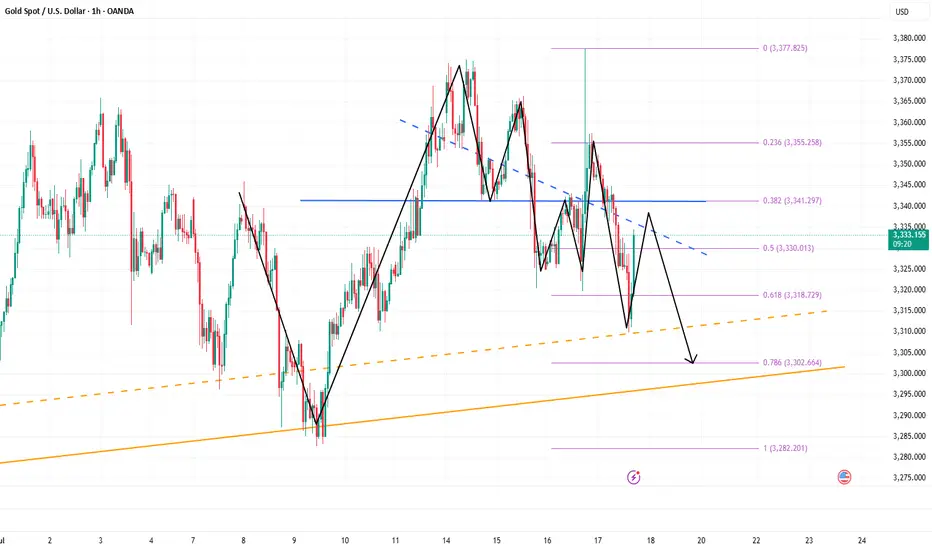
Gold (XAU/USD) Premium Technical Outlook - 18 July 2024As gold continues to trade near record highs, the market’s current price action around $3,336–3,340 demands a sharp, disciplined technical view. This premium analysis combines price action, Fibonacci techniques, institutional concepts (ICT and Smart Money Concepts), and advanced supply–demand dynamics to identify actionable trade opportunities.
We anchor on the 4-hour timeframe for directional bias and zoom into the 1-hour chart for precision intraday setups.
📊 4‑Hour Timeframe: Structure and Directional Bias
Gold remains in a clear bullish structure on the 4-hour chart, as evidenced by sustained higher highs and higher lows. The most recent bullish Break of Structure (BOS) occurred above the $3,320–3,325 level, confirming buyers’ control for now.
Currently, price hovers near equilibrium at the 61.8% Fibonacci retracement, testing prior resistance as potential support. This zone aligns with a small fair value gap (FVG), reinforcing it as an area of interest for smart money participants.
Key 4H Levels to Watch
Level Significance
$3,360–3,365 Major supply zone & bearish OB
$3,350–3,355 Minor resistance
$3,337–3,340 61.8% Fib / equilibrium
$3,330–3,333 BOS retest & key support
$3,300–3,310 Strong demand zone & bullish OB
$3,285–3,295 Secondary demand zone below BOS
The directional bias on 4H remains neutral-to-bullish, contingent on price holding above $3,300. A clean break and close above $3,360 could open a path to $3,400–3,420, while a sustained drop below $3,300 would mark a change of character (CHOCH) and shift bias to bearish.
🪙 Institutional Concepts in Play
Order Blocks (OB): Strong bullish OB sits at $3,300–3,310, while a bearish OB dominates at $3,355–3,365.
Fair Value Gaps (FVG): On the bullish side, $3,300–3,315 remains unfilled; on the bearish side, $3,330–3,345 caps rallies.
Liquidity Grabs: Dips toward $3,295–3,300 appear to sweep sell-side liquidity, while spikes above $3,360 tap into resting buy stops.
The area around $3,330 remains a key battleground where smart money likely accumulates positions before the next impulsive move.
⏳ 1‑Hour Timeframe: Intraday Trade Setups
On the 1-hour chart, the market is compressing between a bullish order block and bearish supply. Price action shows evidence of short-term liquidity sweeps and reactions to imbalances, offering two clear scenarios for intraday traders.
📈 Setup A – Bullish Zone Bounce
Entry: Buy limit at $3,332–3,333
Stop-loss: Below $3,328
Take-Profit 1: $3,345
Take-Profit 2: $3,355
Rationale: Confluence of 4H demand, Fib retracement, BOS retest, and 1H bullish order block.
📉 Setup B – Supply Rejection Short
Entry: Sell limit at $3,355–3,360
Stop-loss: Above $3,365
Take-Profit 1: $3,337
Take-Profit 2: $3,330
Rationale: Price into 4H bearish OB, aligning with supply and stop runs above recent highs.
🌟 The Golden Setup
Among these, the Bullish Zone Bounce at $3,332–3,333 stands out as the highest-probability trade. This level represents maximum confluence:
Retest of 4H BOS.
Bullish OB on 1H.
61.8% Fibonacci support.
Unmitigated fair value gap.
This setup offers a favorable risk–reward profile with clear invalidation and multiple upside targets.
🔎 Summary Table
Bias Key Support Zones Key Resistance Zones
Neutral-to-bullish $3,300–3,310, $3,330–3,333 $3,350–3,355, $3,360–3,365
Intraday Setups Entry Zone Stop-Loss Take-Profit Targets
Bullish Zone Bounce 🌟 $3,332–3,333 < $3,328 $3,345 / $3,355
Supply Rejection Short $3,355–3,360 > $3,365 $3,337 / $3,330
📣 Final Word
Gold maintains a structurally bullish outlook above $3,300, with strong institutional footprints evident in the $3,300–3,333 demand zones. Traders should remain vigilant around $3,360, where sell-side liquidity and supply are concentrated.
The Golden Setup — a bullish bounce from $3,332 — offers the best confluence and statistical edge intraday.

3340-3300: Lock in the buy high and sell low in this area!Under the influence of unemployment benefits and zero monthly sales data, gold fell sharply in the short term, but it did not effectively fall below 3310 during multiple tests, effectively curbing the further downward space of the shorts. Multiple structural supports are also concentrated in the 3310-3300 area, so as long as gold does not fall below this area, gold bulls still have the potential to rebound.
However, for the current gold market, it may be difficult to see a unilateral trend in the short term. After experiencing discontinuous surges and plunges, gold may focus on consolidation and repair, and the consolidation range may be limited to the 3340-3300 area.
So for short-term trading, first of all, I advocate going long on gold in the 3320-3310 area, and expect gold to rebound and reach the 3330-3340 area;
If gold reaches the 3335-3345 area as expected, we can start to consider shorting gold, and expect gold to step back to the 3320-3310 area during the shock and rectification process.
Expectations On GoldPEPPERSTONE:XAUUSD Looking at the daily Range, The market has reached the equilibrium level, is that a sign to go short? no, we could still see a drive to the upper side, but ultimately, the relative equal lows which are close to 3,245.00 big figure should likely be the draw.
I would love to see a drive below the 3,282.00 mark for perfect show to prove the obvious move below the 3,245.00, or seeing a consecutive break below each previous days low would also confirm the directive.
Seeing higher prices would of course negate this analysis, seeing a run into the 3,375.00 big figure yesterday makes me skeptical as this has also left some area of relatively equal highs, so I would give in to the idea of higher prices at least to that level to see what would like occur, but I strongly doubt that this would be the scenerio.
Generally, I am bearish on Gold till I see a run below that 3,245.00 big figure or prices closer to that level.

False breakout? Gold reverses sharply after news surgeBecause of the news that Trump hinted at firing Powell, gold surged strongly in the short term and passed to 3377, recovering the recent decline in one fell swoop. We went long on gold near 3323 in advance, and went long on gold near 3340 again after gold retreated, hitting TP: 3345 and 3355 respectively. The two long trades successfully made a profit of 370pips, with a profit of more than $18K.
Although gold has risen sharply in the short term and effectively destroyed the downward structure, it is mainly news that drives the market. After Trump denied firing Powell, gold rose fast and fell fast. So we can't chase long gold too much. First, the sustainability of the news-driven market needs to be examined, and second, the certainty of Trump's news is still unreliable. He always denies himself the next day.
After the gold price retreated quickly, a long upper shadow appeared in the candlestick chart, indicating that the upper resistance should not be underestimated. Therefore, we should not rush to buy gold. We can still consider shorting gold in the 3355-3365 area. We should first focus on the area around 3340. If gold falls below this area during the retreat, gold will return to the short trend and test the area around 3320 again, or even fall below this area after multiple tests and continue to the 3310-3300 area.

Gold fluctuated downward. Stuck in a stalemate.Information summary:
Global investors have experienced the longest night this year. There are reports that Trump has drafted a letter to fire Federal Reserve Chairman Powell. The incident triggered a strong reaction in the financial market. An hour later, Trump came out to clarify that "there is no plan to take any action" and denied drafting a letter to fire Powell.
Due to the impact of the incident, gold experienced a roller coaster market, soaring more than $50 at one time, hitting a three-week high of $3,377.17, and then narrowed its gains to 0.68%, and finally closed at $3,347.38. In today's Asian market, gold fell slightly and is currently hovering around $3,325.
Market analysis:
The current volatility pattern has not changed. In the short term, the market shows signs of weakness, which is also affected by CPI data, and expectations for interest rate cuts have weakened. In the current state where there is no break in the pattern, waiting and watching is still the best strategy.
The first support level is around 3,310, which is the starting point of last week's high. The second is around 3280, which is the historical low since July and also the starting point of the rise in the first week of July.
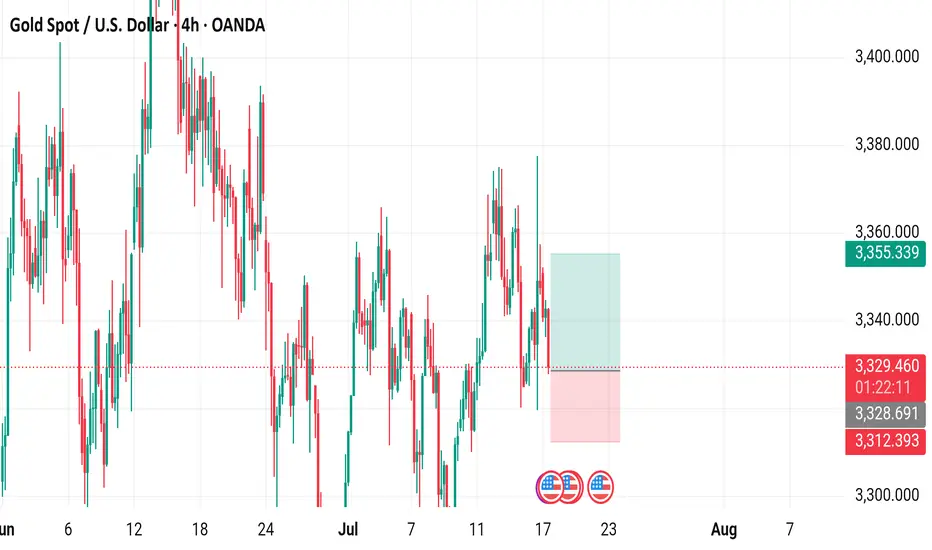
Gold Spot / U.S. Dollar (XAU/USD) 4-Hour Chart4-hour chart from OANDA displays the price movement of Gold Spot (XAU/USD) against the U.S. Dollar, showing a current price of $3,329.145 with a decrease of $18.455 (-0.55%). The chart highlights key levels including a sell price of $3,328.920 and a buy price of $3,329.370, with a recent trading range between $3,355.339 and $3,312.393. The data spans from late June to mid-July 2025, with notable price fluctuations and a shaded area indicating a potential trading zone.
7/17: Key Support for Gold Bulls at 3343–3337During the Asian session today, gold rose as expected into the 3337–3343 resistance zone. After failing to break through, the price retraced during the European and U.S. sessions, reaching the 3323–3313 support area. A sharp rally followed due to unexpected news, pushing the price into the 3372–3378 resistance zone. Overall, the intraday bullish strategy performed well, yielding solid profits.
After this sharp volatility, price movement has stabilized somewhat. The MA60 support on the daily chart remains intact.
For tomorrow’s trading, key levels to watch are:
🔽 Support: 3343–3337, with secondary support at 3328–3323
🔼 Resistance: 3372–3378
On the 2-hour chart, bullish momentum appears likely to continue as long as price holds above the support zone.
Additionally, upcoming economic data releases and any further developments on the report regarding Trump potentially firing Powell could have a significant impact on market sentiment—these factors should be closely monitored.
In summary, tomorrow’s initial trading focus can remain within the 3337–3358 range, with strategies adjusted as market conditions evolve.
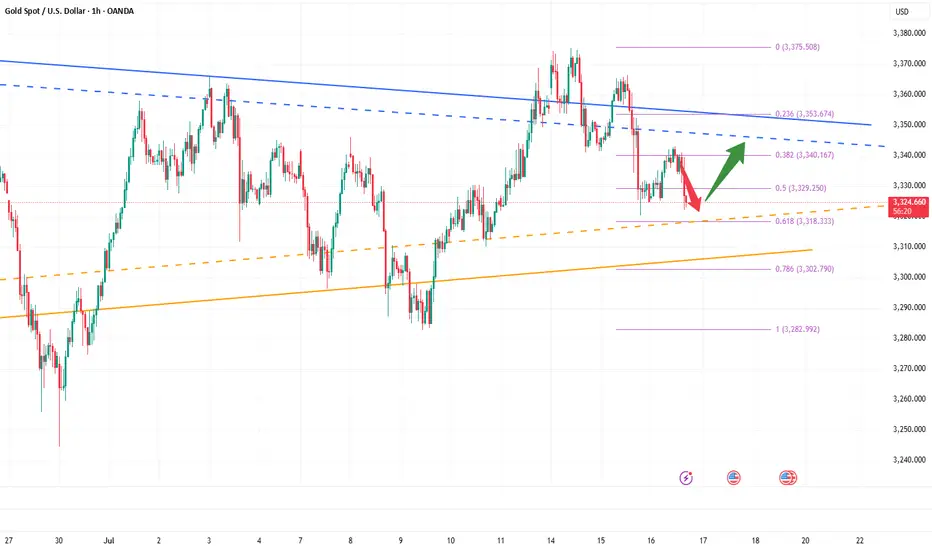
3325–3315: Potential Bullish Reversal ZoneGold maintained a volatile trend today, but the highest intraday price only touched 3343. Overall, gold is still weak, but the bulls have not completely given up, and there is still a certain amount of energy, which limits the retracement space of gold. The current short-term support is in the 3325-3315 area. If gold cannot fall below this area in such a weak situation, the market may reach a consensus that 3325-3315 is the support area, thereby attracting a large amount of buying funds to flow into the gold market, thereby boosting gold to regain the bullish trend again and is expected to hit the 3350-3360 area.
So for short-term trading, I currently prefer to start long gold with the 3325-3315 area as support, first expecting gold to recover some of its lost ground and return to the 3350-3360 area!
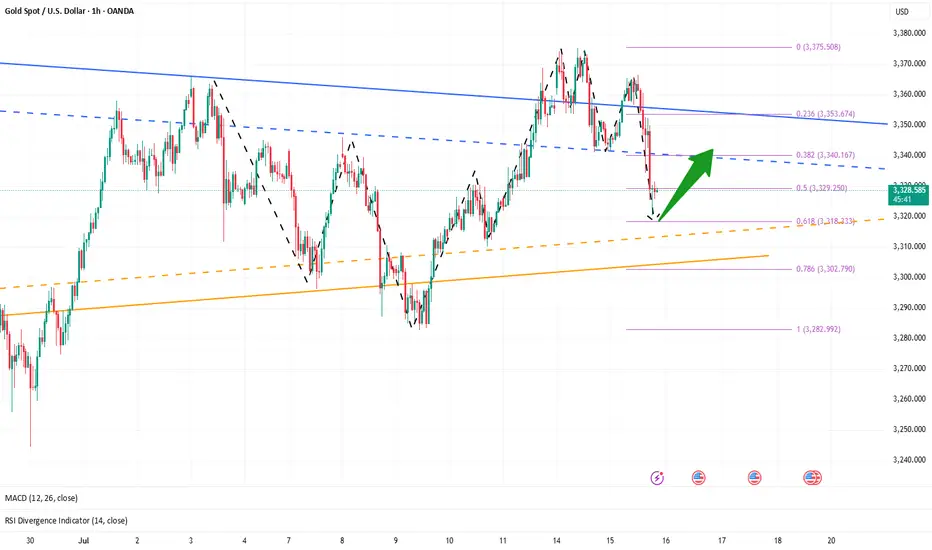
Golden Support Holds — Bulls Poised for Another Leg Higher"If gold cannot break through the 3365-3375 area, gold will fall under pressure again, or refresh the recent low of 3341, and continue to the 3335-3325 area." Gold's performance today is completely in line with my expectations. Gold just retreated to a low of around 3320, but soon recovered above 3325, proving that there is strong buying support below.
From the current gold structure, the short-term support below is mainly concentrated in the 3320-3310 area. If gold slows down its downward momentum and its volatility converges when it approaches this area, then after the gold bearish sentiment is vented, a large amount of off-site wait-and-see funds will flow into the gold market to form strong buying support, thereby helping gold regain its bullish trend again, thereby starting a retaliatory rebound, or a technical repair rebound.
Therefore, for short-term trading, I still insist on trying to go long on gold in the 3330-3320 area, first expecting gold to recover some of its lost ground and return to the 3340-3350 area.
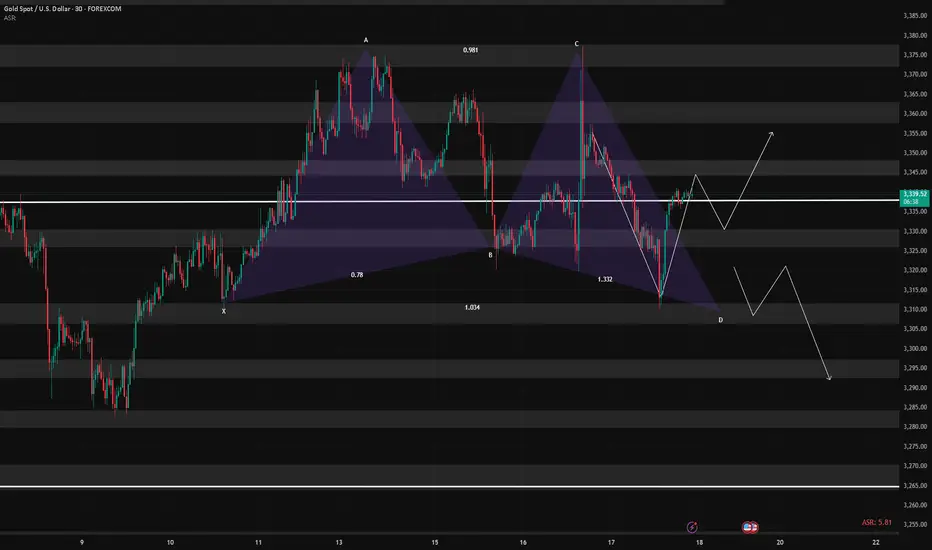
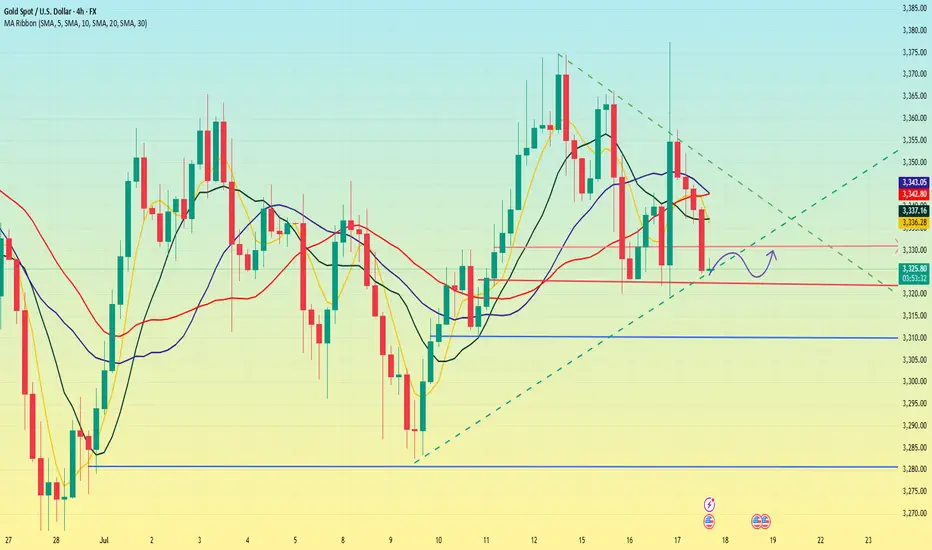
XAUUSD Structural Analysis & Confluence - 16 July 2025 4-Hour Bias & Structural Context
Gold has recently broken above a key structure level at $3,320, confirming a bullish market environment on the 4‑hour timeframe. This follows a Change of Character (CHOCH) around $3,300, signifying a shift from consolidation to an upward trend. The swing from the late-June low ($3,244) to mid-July’s high ($3,374) sets our Fibonacci context:
38.2% retrace ≈ $3,318
50% retrace ≈ $3,309
61.8% retrace ≈ $3,300
These fib levels also align with prior structure and key ICT/SMC zones, signaling strong areas of interest.
🧭 Key 4-Hour Confluence Zones
Demand / Order Block → $3,300 – 3,305
Multi-method support: BOS, CHOCH, 50–61.8% fib convergence.
Fair Value Gap (FVG) → $3,320 – 3,325
Volume deficient zone post-BOS, primed for a retest.
Supply / Resistance Area → $3,360 – 3,370
High-timeframe supply, likely to cap further upside.
🧠 Smart Money Concepts
BOS above $3,320 confirms bullish structure.
CHOCH at ~$3,300 marks structure flip.
Liquidity grab zones found between $3,335–3,340, validating the presence of institutional activity.
Order Block at $3,300–3,305 supports buy-side interest.
📊 1-Hour Intraday Trade Setups
🔸 Setup #1 – FVG Re-Test
Entry: At ~$3,325 on pullback into $3,320–3,325 zone
SL: Below $3,320
TP1: $3,345, TP2: $3,360
🔸 Setup #2 – Demand OB Bounce (“Golden Setup”)
Entry: In the $3,300–3,305 range
SL: Below $3,298
TP1: $3,325, TP2: $3,345, TP3: $3,360
Edge: Tight risk, high confluence (SMC + fib + structure)
🌟 The Golden Setup
Zone to Watch: $3,300–3,305
Why It Rates Highest:
BOS, CHOCH, fib, and OB all align
Offers tight stop placement and strong upside
Risk-to-reward ~1:3
📌 Daily Watchlist Summary
Directional Bias: Bullish (BOS above $3,320 intact)
Primary Entry Zones:
$3,300–3,305 (Demand OB + structure)
$3,320–3,325 (FVG retest for continuation)
Key Target Zones:
$3,345–3,350 – realistic intraday exit
$3,360–3,370 – major supply cap
Invalidation Level: 4‑hour candle close below $3,298 negates bullish outlook
Final Commentary
Stay disciplined—only trade reactive signals at these levels: clean bounces, pinbars, or bullish engulfing patterns. The $3,300–3,305 zone stands out as the prime ‘Golden Setup’ entry.

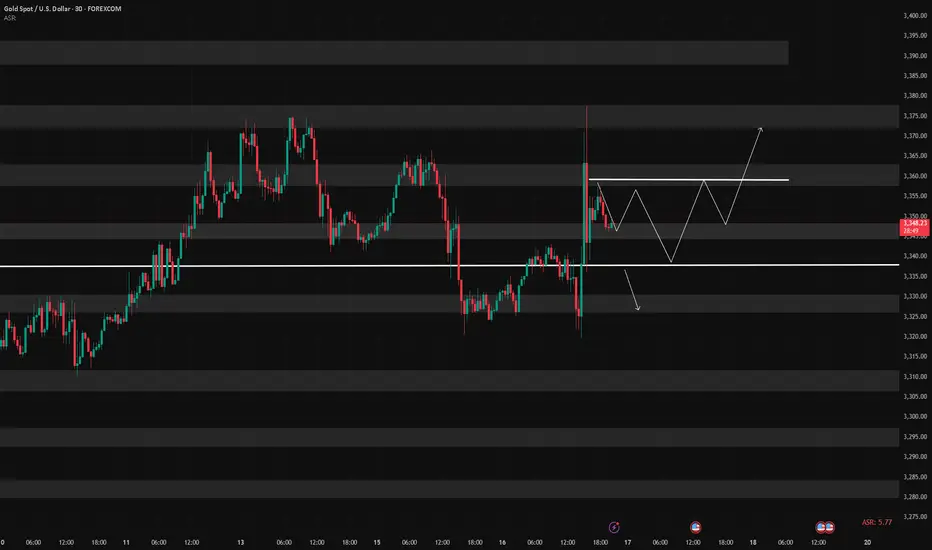
7/15: Watch for Long Opportunities Around 3343 / 3332–3326Good morning, everyone!
Yesterday, gold rose into the resistance zone before pulling back, testing support around 3343. After today’s open, the price continues to consolidate near this support level.
On the 30-minute chart, there is a visible need for a technical rebound, while the 2-hour chart suggests that the broader downward movement may not be fully completed. The MA60 support area remains a key level to watch.
If support holds firm, the price may form a double bottom or a multi-bottom structure, potentially leading to a stronger rebound.
As such, the primary trading strategy for today is to look for long opportunities on pullbacks, with key levels as follows:
🔽 Support: 3343, and 3332–3326 zone
🔼 Resistance: 3352–3358, followed by the 3372–3378 upper resistance band
Don’t hesitate, a massive gold move Is brewingRefer to my previous trading idea. Gold retreated as expected. We almost caught the highest point of the day and shorted gold near 3365, and successfully hit TP: 3346, which enabled us to successfully profit 190pips in short-term trading, with a profit of nearly $10K, which is a good result in short-term trading.
Currently, the lowest point of gold in the retracement process has reached around 3335, which has fully released the short energy and vented the bearish sentiment in the market. All the bad news is out, which means good news! Although gold fell from 3375 to 3335, the retracement was as high as $40, but the rising structure has not been completely destroyed. The previous W-shaped double bottom support structure and the resonance effect of the inverted head and shoulder support structure still exist. As long as gold stays above 3325, gold bulls still have the potential to attack.
Moreover, after this round of retracement, the bearish sentiment of gold was vented, and the liquidity was greatly increased, attracting more buyers to actively enter the market. Gold may start a retaliatory rebound, and even touch 3375 again or even break through and continue to the 3380-3390 area.
So for short-term trading, I think we can try to go long on gold in the 3335-3325 area appropriately, first looking forward to gold regaining lost ground: 3350-3360 area, followed by 3380-3390 area.