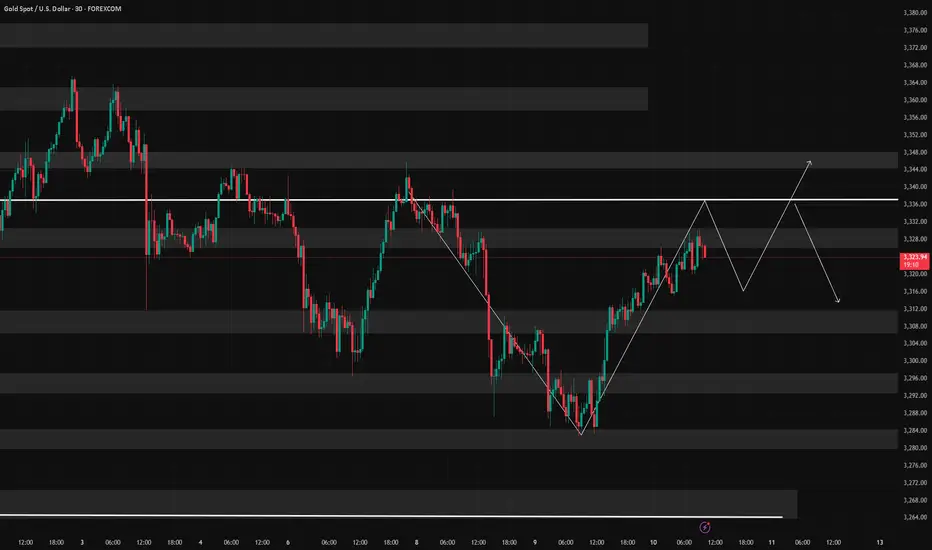
GOLD Intraday Chart Update For 15 July 2025Hello Traders,
Welcome to the US CPI Day, as you can see that market is in tight range for now and all eyes on the breakout for now
Only clear breakout of 3380 we will consider market will be bullish towards 3400 & 3425
If markets sustains below 3335 it will move towards 3305 or even 3285
All eyes on US CPI
Disclaimer: Forex is Risky
Xauusdsignals

Eyes on 3335–3325: Next Bullish Launchpad!!!Today, gold hit 3375 several times and then fell back after encountering resistance. The lowest has reached 3341. Although the rising structure has not been completely destroyed, and the technical double bottom structure and the inverted head and shoulder structure support resonance effect still exist below, since gold fell below 3350, it has not even been able to stand above 3350 in the current rebound. The gold bull pattern has been weakened to a certain extent, and the market has begun to diverge in the long and short consciousness.
Gold encountered resistance and fell back near 3375 three times, proving that the upper resistance is relatively strong. Gold must increase liquidity by retracement to store more energy for breakthrough, so the short-term correction of gold is actually within my expectations, which is why I advocate brave shorting of gold today! However, according to the current retracement range and the fact that gold has been unable to stabilize above 3350, I believe that gold has not fallen to the right level and there is still room for retracement below. So I think gold will continue to pull back to test the 3335-3325 area. If gold retests this area and does not fall below, we can boldly go long on gold in this area.
Once gold rebounds after testing the 3335-3325 area, as liquidity increases, the market may form a strong bullish force to support gold to continue its rebound and continue to the 3380-3390 area, or even the 3400-3410 area.
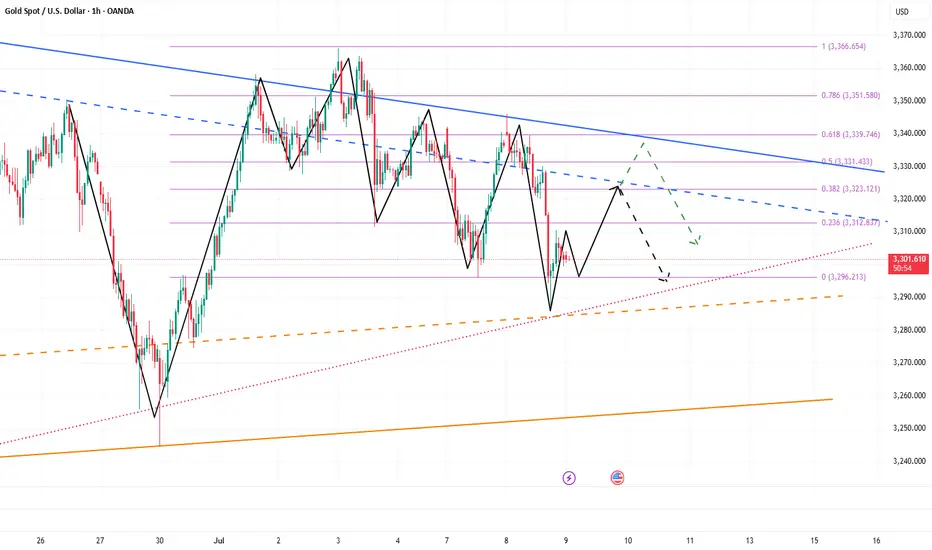
Gold (XAU/USD) 4H: Bullish Continuation Play- 15 July 20244‑Hour Technical Outlook — Bullish Bias Above Key BOS Zone
Gold remains in a strong structural uptrend on the 4‑hour chart, carving out a sequence of higher highs and higher lows. Price is consolidating just below recent swing highs around $3,360, suggesting accumulation after last week’s impulsive rally.
We saw a Break of Structure (BOS) above $3,340, confirming bullish control and establishing that area as a critical flip zone. Unless price closes decisively below that BOS, the directional bias remains bullish.
📐 Key Confluences & Zones on 4‑Hour
🔹 Fibonacci Retracement (Swing: $3,280 → $3,360):
38.2%: ~$3,331 — aligns perfectly with BOS & prior resistance turned support.
61.8%: ~$3,313 — deeper, but still within bullish context.
🔹 Supply & Demand Zones:
Supply (Resistance): $3,355–$3,360 — recent highs, likely containing resting sell‑side liquidity.
Demand (Support): $3,331–$3,335 — a bullish order block and fair value gap (imbalance) reside here.
Deeper Demand: $3,313–$3,315 — secondary buy zone if the market hunts liquidity deeper.
🔹 Liquidity Profile:
Buy‑side stops likely rest above $3,360 — breakout target.
Sell‑side liquidity below $3,331 could trigger a shakeout before higher.
🧠 ICT/SMC Concepts Observed:
✅ BOS confirmed at $3,340, favoring longs.
✅ FVG/imbalance between $3,338–$3,342 suggests price may “fill” before next impulse.
✅ Recent wick above $3,355 hints at minor buy‑side liquidity grab — but no confirmed CHoCH (change of character) yet.
✅ Bullish order block formed at $3,331–$3,333, acting as strong support.
📈 1‑Hour Intraday Playbook — Aligned With Bullish Bias
On the 1‑hour chart, momentum remains constructive above $3,331. Intraday traders can look for these setups:
1️⃣ Buy the Retest
Entry: $3,335 (within 4H OB & FVG)
Stop‑loss: $3,327 (below demand)
Targets:
🔸 T1: $3,355
🔸 T2: $3,380 (next resistance)
2️⃣ Breakout Long
Entry: Break and close above $3,360
Stop‑loss: $3,350
Targets:
🔸 T1: $3,380
🔸 T2: $3,406 (1.272 Fib ext.)
3️⃣ Deeper Pullback Buy
Entry: $3,313–$3,315 (61.8% Fib + deeper demand)
Stop‑loss: $3,305
Targets: back toward $3,355–$3,380
🎯 The Golden Setup:
✅ Long from $3,335, stop‑loss $3,327, targeting $3,355–$3,380.
Why? This setup aligns BOS, bullish OB, FVG, 38.2% Fib, and current trend structure — highest confluence and best risk/reward ratio (~1:3).
🔎 Summary Table — Key Levels for Today
📈 Bullish Continuation Above $3,331
🟢 Strong Buy Zone $3,331–$3,335
🟢 Deeper Demand $3,313–$3,315
🔴 Resistance / Supply $3,355–$3,360
🚨 Bullish Invalidation Below $3,331
Bias remains bullish as long as $3,331 holds. Look for reaction in the $3,331–$3,335 zone to join institutional flows.

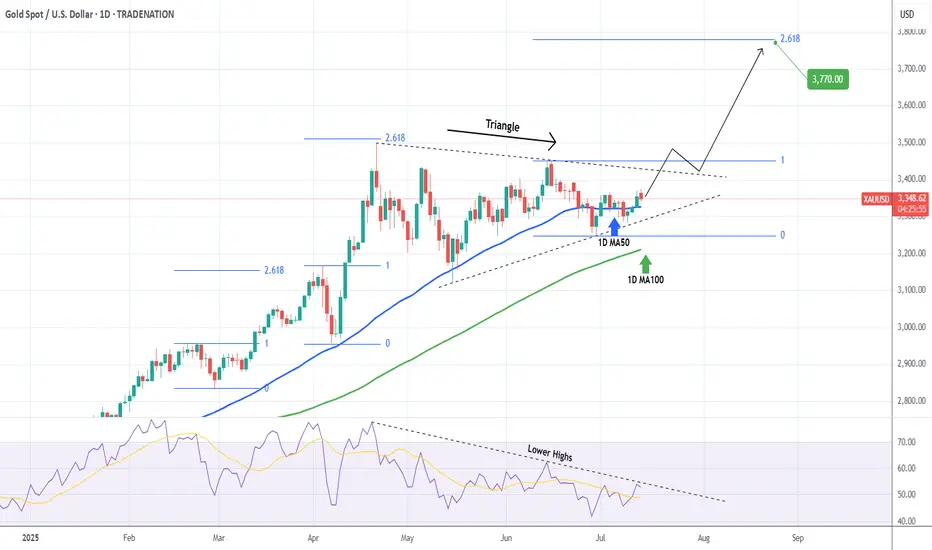
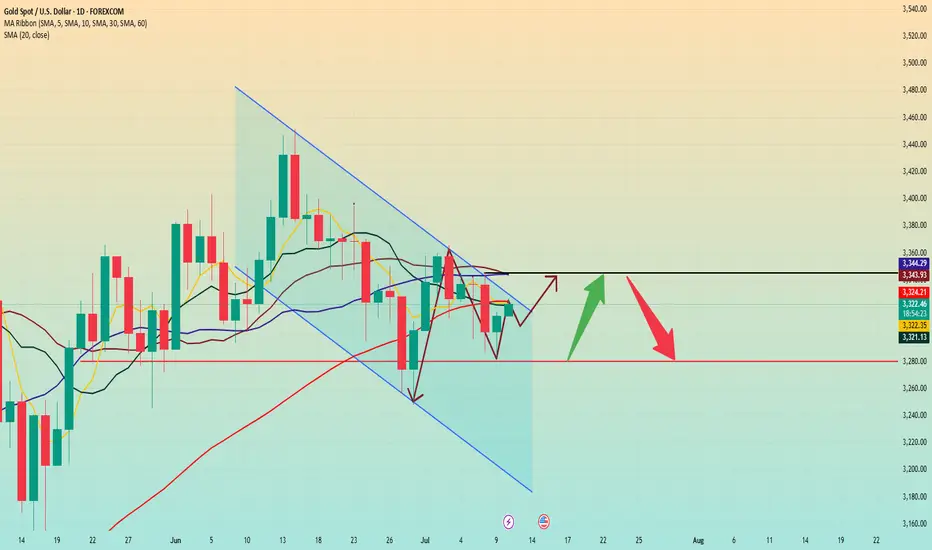
XAUUSD Triangle about to break upwards aggressively.Gold (XAUUSD) has been trading within a Triangle pattern since the April 22 High. It is now above its 1D MA50 (blue trend-line), which has been turned into its Pivot and technically it is about to break upwards as it is running out of space.
As long as the 1D MA100 (green trend-line) holds, the market technically targets the 2.618 Fibonacci extension, which is what the last two Bullish Legs hit, which currently sits at 3770. A 1D RSI break above its own Lower Highs trend-line, could be an early buy signal.
-------------------------------------------------------------------------------
** Please LIKE 👍, FOLLOW ✅, SHARE 🙌 and COMMENT ✍ if you enjoy this idea! Also share your ideas and charts in the comments section below! This is best way to keep it relevant, support us, keep the content here free and allow the idea to reach as many people as possible. **
-------------------------------------------------------------------------------
Disclosure: I am part of Trade Nation's Influencer program and receive a monthly fee for using their TradingView charts in my analysis.
💸💸💸💸💸💸
👇 👇 👇 👇 👇 👇
Gold still has room to pull back, be brave and short gold!Gold continued to rebound today, and we also successfully gained 150pips profit in long gold trading. However, although gold is currently maintaining its upward trend, the rebound strength of gold is not strong during the European session, and it has repeatedly touched 3375 and then fell back, proving that there is still some resistance above. In my previous trading point of view, I also emphasized that gold is under pressure near 3380 in the short term. In addition, from a technical perspective, today's intraday high is limited to 3395.
So in order to dump the bullish momentum so that it can break through 3380 more smoothly, or even continue to above 3340, gold will inevitably have a retracement in the short term. So when most people in the market are still waiting for a retracement to go long on gold, I will definitely not waste the opportunity of gold retracement in vain.
So for short-term trading, I will consider shorting gold appropriately in the 3375-3395 area, with the target looking at 3360-3350. After gold falls back as expected, we might as well consider going long on gold at a low level.

7/14: Sell High, Buy Low Within the 3400–3343 Range for GoldGood morning, everyone!
At the end of last week, renewed trade tariff concerns reignited risk-off sentiment, prompting a strong rally in gold after multiple tests of the 3321 support level. The breakout was largely driven by fundamental news momentum.
On the daily (1D) chart, the price has fully reclaimed the MA60 and broken above the MA20, signaling an emerging bullish trend. The key focus for this week includes:
Monitoring whether MA20 holds as support on any pullbacks
Watching the 3400 resistance zone for signs of exhaustion or continuation
From a 30-minute technical perspective, gold is currently trading within a short-term resistance band of 3372–3378, with a stronger resistance zone between 3387–3392. Key support levels are:
Primary support: around 3358
Secondary support: 3343–3332 zone
Given the recent increase in volatility due to geopolitical and macroeconomic headlines, flexible intraday trading is recommended within the 3378–3343 range, while broader trades can be framed around the 3400–3325 zone, still favoring a sell-high, buy-low approach.
Lastly, as we move into the mid-year period, I may have more personal commitments, and strategy updates could be less frequent. I appreciate your understanding, and as always, feel free to leave a message if you have any questions or need trading guidance—I’ll respond as soon as I can.

GOLD H2 Intraday Chart Update for 14 July 2025Hello Traders,
we have no major news today, But Tariff News remains agendas for now
All eyes on 3380-3400 zone breakout for further upside, only below 3350 GOLD will move towards 3330 level with continuation of 3310 level
Disclaimer: Forex is Risky

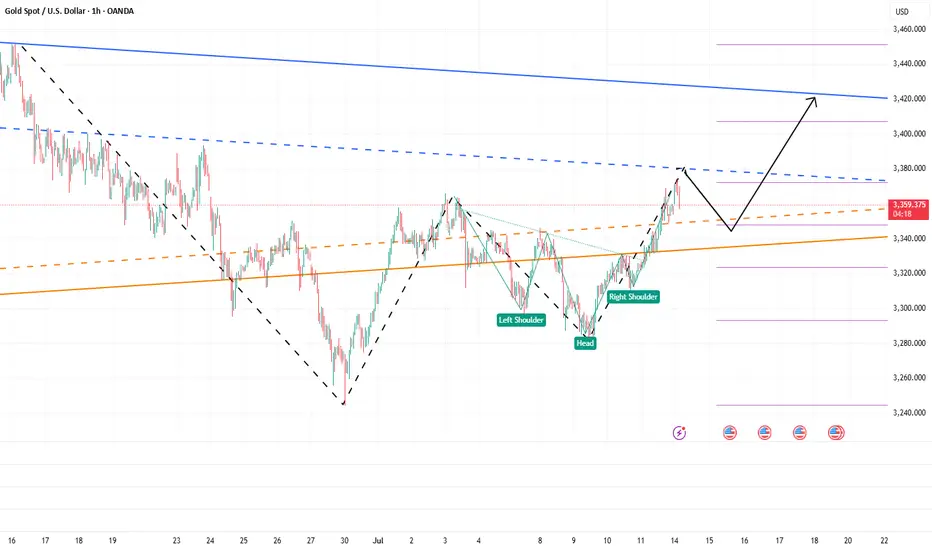
The bulls have started, aiming at 3400!Gold rose as soon as the market opened, and the highest has now reached above 3374. The upward momentum of gold is strong. It can be seen that after breaking through the recent high of 3365, its morphological structure has obviously tended to a bullish structure, and the technical form shows a "W" double bottom structure and an inverted head and shoulder resonance. The resonance of this technical structure will continue to support the continued rise of gold.
At present, gold is under pressure near the 3380 area in the short term, followed by the area near 3405. At present, gold has a technical retracement near 3380, but it is difficult to destroy the already formed rising structure based on the current retracement strength. Once gold rises again, 3380 will definitely be conquered! It will even continue to the 3400-3410 area; and the area with obvious short-term support is concentrated in the 3350-3340-3330 area, so gold may still rebound again with the support of this area after the decline, and continue to rise.
So for short-term trading, I would consider buying gold in batches based on the support of the 3350-3330 area, with the first target looking at 3380, followed by the 3400-3410 area.
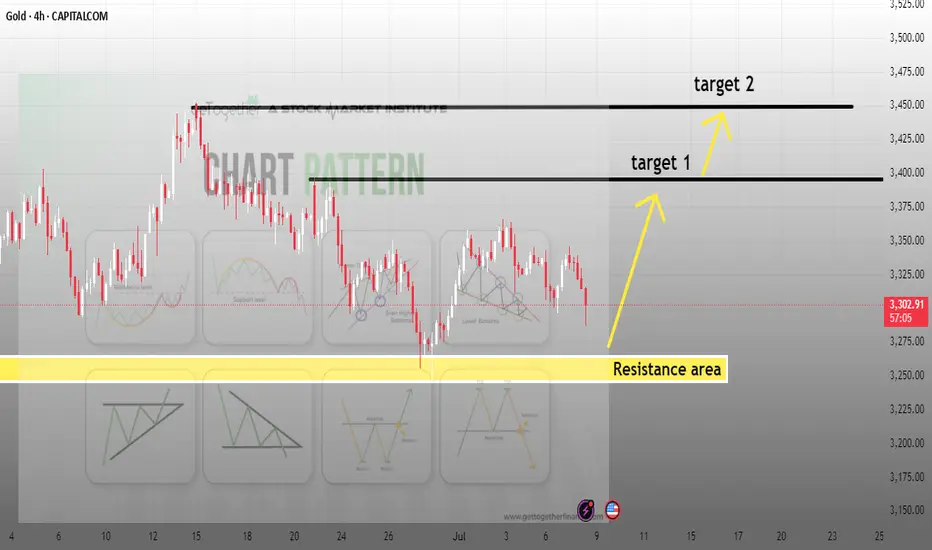
GOLD Breakout or Fakeout? Thief’s Guide to Safely Rob the Move!🏆 XAU/USD Master Plan: Loot the Bullish Rally Before the Bearish Trap!💨💰
🌟 Hola! Bonjour! Hallo! Marhaba! 🌟
Attention Money Makers & Market Robbers! 🤑💸
🔥 Thief Trading Strategy Alert 🔥
Time to execute our gold heist on XAU/USD! Based on technical + fundamental looting tactics, here’s the play:
📈 ENTRY ZONES (4H TIMEFRAME)
BUY: Sneak in at Market Maker’s Buy Zone (Pullback Entries Only!).
SELL: "The vault’s wide open!"—Ambush bearish traps at risky highs (Red Zone).
🛑 STOP-LOSS (THIEF RULES)
Hide your SL at:
Past key lows OR nearest swing low (4H).
Adjust based on your risk, lot size, & robbery multiplier.
🎯 TARGET: 3525.00 (OR ESCAPE EARTHER!)
Scalpers: Long-side only! Trail your SL to lock loot.
Swing Thieves: Join forces—big pockets or small, execute the plan!
⚠️ WARNING: NEWS = VOLATILITY TRAPS!
Avoid new trades during news.
Use trailing SL to protect stolen profits.
📰 FUNDAMENTAL LOOT LIST (READ BEFORE HEIST!)
COT Report, Macro Data, Sentiment Outlook—Link in bi0! 🔗🤙🏻👉🏻👉🏻
Gold’s bullish now… but robbers adapt fast!
💥 BOOST THIS PLAN = STRONGER GANG!
Hit 👍 & Share—More boosts = More gold stolen daily!
Stay tuned… Next heist drops soon! 🚀🐱👤

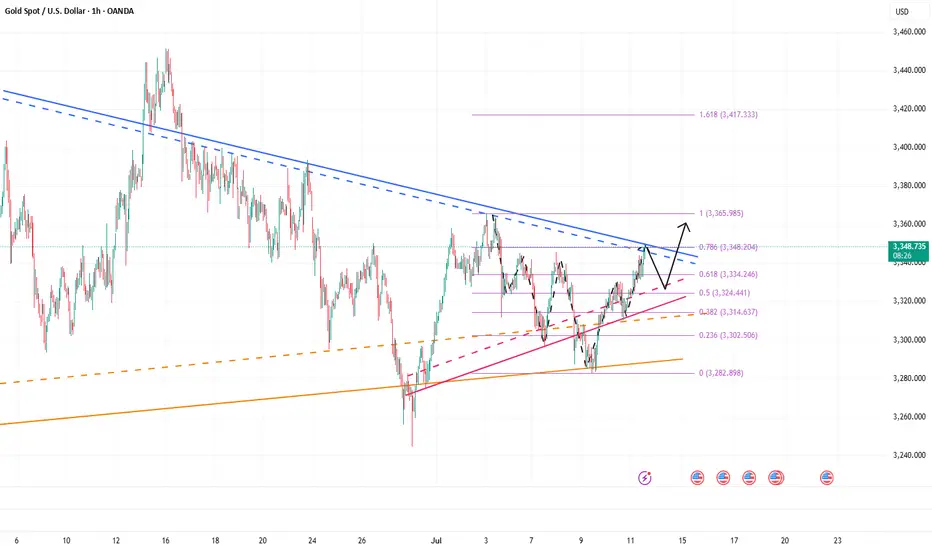
Continue to try to find the top of the band to short goldGold maintained a slow and volatile rise structure during the day. The highest has reached 3348, and it is only a step away from 3350. Will gold continue its upward momentum as usual?
In fact, it was beyond my expectation that gold could break through 3345 in the short term. According to my original expectation, the intraday high of gold was almost around 3345. Although the rebound of gold exceeded expectations, it is currently located near the resistance of 3348-3350, so I will definitely not give priority to chasing gold at high levels in short-term transactions.
Moreover, gold is currently in the resistance area of 3348-3350. The volatility of gold has converged, and the upward momentum has declined. As gold continues to rebound and faces the key resistance area again, the bulls are relatively more cautious. In this context, this resistance area may act as a catalyst, and the bears will react, leading the decline in gold. However, as gold rebounds and the support below gradually stabilizes, we can appropriately reduce the expectation of gold's decline and adjust the decline target to the 3330-3320 area.
So for short-term trading, I will still short gold based on the resistance area, trying to find a swing top in the 3340-3350 area, and look at the target area of 3330-3320.
GOLD H2 Intraday Chart Update For 11 July 2025Hello Traders
Today we have weekly closing & all eyes on weekly closing initially
2nd 3350 Psychological level remains watchable if GOLD break 3360 level successfully today then it will move towards 3390 else we have remains selling opportunities from TOP
below 3360 level market will move towards 3315
Disclaimer: Forex is Risky

Gold is fluctuating. Can it break through?Since the price of gold rose to 3500 on April 22 and encountered resistance and fell back, it has shown a triangular convergence and fluctuation trend so far. From the short-term trend, after the decline adjustment on Tuesday, it bottomed out and rebounded on Wednesday to close with a positive line, and on Thursday it completed the shock consolidation with a small positive line. The current moving average system is in an intertwined state, and the short-term market tends to fluctuate.
Today, we need to pay attention to the resistance of the 3340-3345 range. This position is a high point concentration area that has suppressed the upward movement of gold prices many times in the early stage. If the gold price breaks through this range, the bullish trend is expected to continue.
From the current trend, after the gold price bottomed out and rebounded, it formed a short-term support at 3310. Secondly, we need to pay attention to the support strength near the low point of 3282 on Tuesday. In terms of operation, it is still necessary to operate around the range.
Operation strategy:
Short when the price rebounds to around 3345, stop loss at 3355, profit range 3320-3300
Long when the price falls back to around 3310, stop loss at 3300, profit range 3320-3340
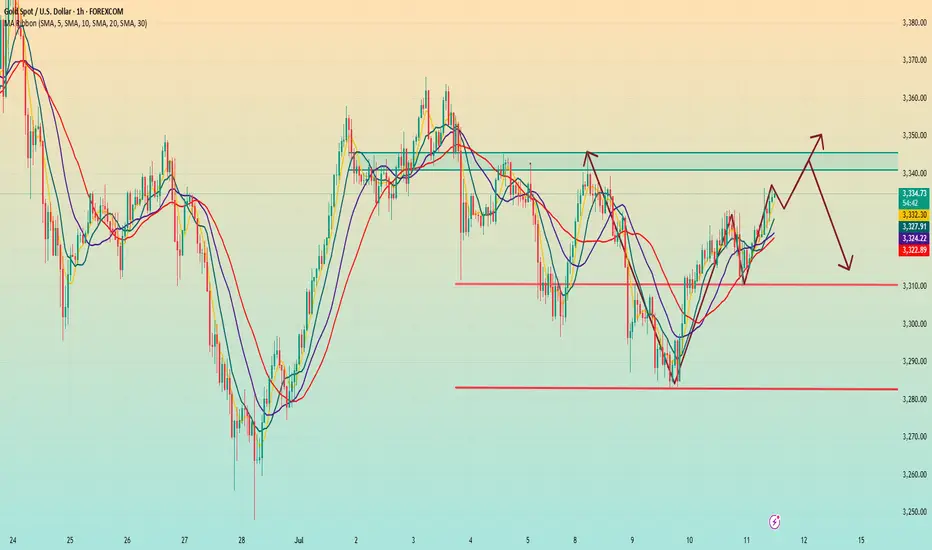
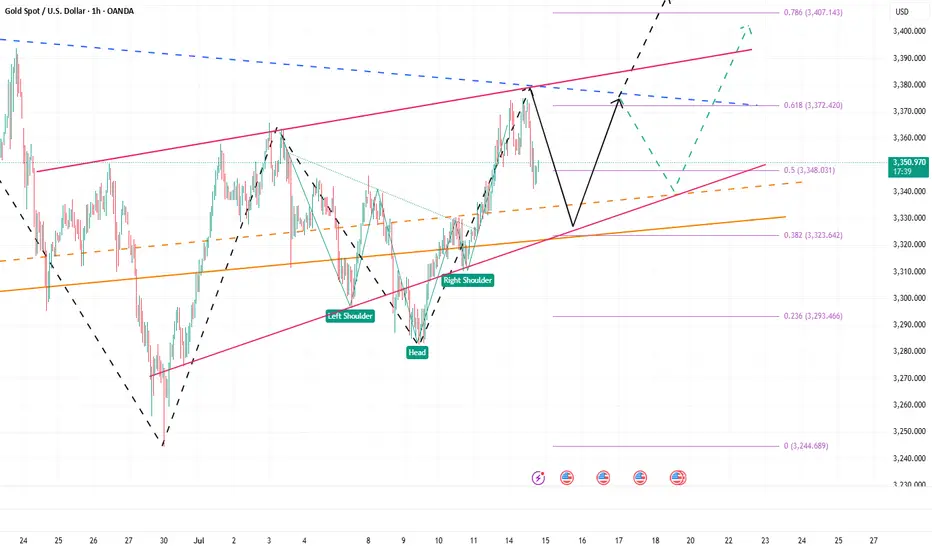
Gold’s Uptrend Is a Mirage,Bears Are Lurking Beneath!Gold has rebounded to around 3336, and seems to have tried to stand above 3335, but it has not stood firm. Therefore, it cannot be considered that the bulls have an advantage just because gold has tried to break through 3335. Recently, I have been reminding everyone that before gold stands above 3335, the bears still have the spare power to dominate the market, so I fully believe that the gold bulls and bears will fight fiercely for control around 3335!
Why do I think it is difficult for gold bulls to have a good performance in the short term? Because since gold fell and touched 3285, it has fallen below many key supports. The market is short-selling. The previous support has become a key resistance under the effect of technical top and bottom conversion, and multiple resistances are concentrated in the 3335-3345-3355 area. Under the suppression of multiple resistances, it is difficult for gold bulls to make any progress in the short term.
So before the resistance is effectively broken, I think any rebound may be an opportunity to short gold, so I will try to find the band top and short gold based on the resistance area, and now I think it is still worth a try to short gold in the 3330-3340 area as originally planned! And look at the target area of 3320-3310
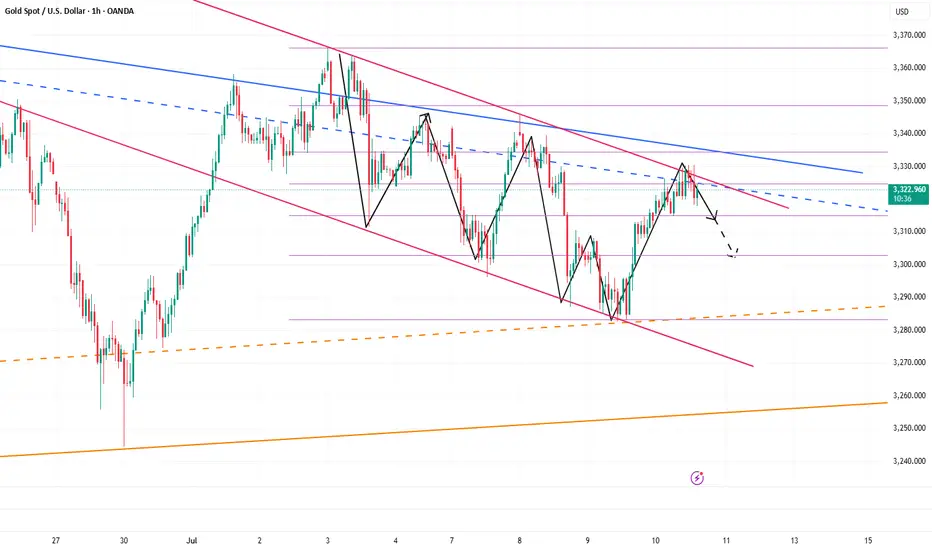
Short gold ,the downside potential is far from over.After we waited patiently for a long time, the gold bears finally showed signs of strength and began to fall as expected. Why do I insist on being optimistic about the gold retracement and wait patiently for it to retrace? !
In fact, it is very simple. Gold started to rebound from around 3283 and touched around 3330, which only recovered 50% of the decline. When facing the 50% retracement level, the bulls were unable to do so and could not stand above 3335, and could not even stabilize above 3330. The bulls' willingness was obviously insufficient. Then it can be determined that the gold rebound is only a technical repair of the sharp drop, and it cannot be completely regarded as a reversal of the trend. Then after a certain degree of repair, the gold bears will counterattack again.
Moreover, from the perspective of market psychology, the recent gold bull and bear markets have been discontinuous, and Trump often stirs up the gold market, making it difficult for the market to stand unilaterally on the bull side. Therefore, before gold stabilizes in the 3330-3340 area, there is limited room for rebound in the short term. Once gold falls below the 3310-3305 area again during the retracement, gold may test the area around 3280 again, or even around 3270.
So the above is why I insist on shorting gold, and I have shorted gold at 3320-3330 as planned, and patiently hold the position to see its performance in the 3310-3305 area, which is also the target area of our short-term short position.
7/9: Focus on Selling Gold on ReboundsGood evening, everyone!
Apologies for the late update today—I had some matters to attend to. I hope your trades are going smoothly.
Yesterday, gold found support around 3284 and continued to rebound during today’s session, reaching as high as 3330. The key resistance at 3321 has now been broken and is currently acting as a short-term support level. However, based on the current price structure, this level is likely to be retested multiple times, and some consolidation may follow.
The next major resistance lies between 3337 and 3343. In the absence of strong bullish momentum, the preferred short-term strategy remains selling on rebounds, especially near resistance zones.
⚠️ Additionally, the U.S. Initial Jobless Claims data will be released during the New York session tonight, which may cause increased volatility and potentially whipsaw price action. Be cautious with position sizing, and avoid emotional trades or chasing price action during news releases. Patience and discipline will be key.
XAUUSD Sell Nowthis is gold pairs and my analysis say gold down soon possible, like my analysis and share.
Gold rose. Trend reversed.Gold rose slightly in early Asian trading on Wednesday, but fell under pressure near 3308. It fluctuated in the European trading range of 3296-3282. It broke through the US trading range and rose to around 3317 in the late trading. The daily line closed with a positive line with a lower shadow.
After a sharp drop on Tuesday, gold showed a downward recovery trend on Wednesday and closed positive. It rose slightly in early Asian trading today. From the daily level, in the short term, we should first pay attention to the resistance near 3325-3330. This area brings together the current positions of the 5-day moving average, the 10-day moving average and the 60-day moving average, which is an important gateway for the game between long and short forces in the short term. If the gold price continues to be under pressure in this area, it means that the short-term upward momentum is insufficient, and we need to be alert to the risk of a market decline.
If the above resistance area can be broken and the price continues to rise strongly, the next target will be the resistance near 3345, which is not only the high point on Tuesday, but also the current location of the 20-day moving average and the 30-day moving average, which has a strong technical resistance significance.
In terms of support below, first pay attention to the support near 3280, which is the current support level of the trend line formed by the low points of May 15 and June 30, which provides certain support for the gold price.
Operation strategy:
Short at price rebound near 3345, stop loss at 3355, profit range 3320-3300
Long at price drop near 3315, stop loss at 3305, profit range 3320-3340
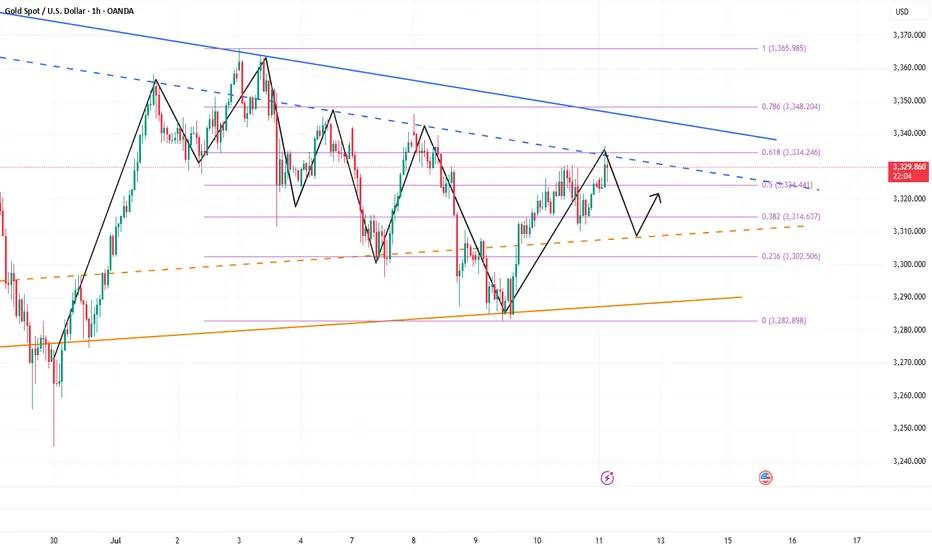
Start buying gold, a rebound may come at any time!Gold is undoubtedly weak at present, and bears have the upper hand. However, since gold touched the 3290-3280 area, gold bears have made more tentative moves, but have never really fallen below the 3290-3280 area, proving that as gold continues to fall, bears have become more cautious.
From the perspective of gold structure, multiple technical structural supports are concentrated in the 3285-3275 area, which makes it difficult for gold to fall below this area easily. After gold has failed to fall below this area, gold is expected to build a short-term bottom structure with the help of multiple supports in this area, thereby stimulating bulls to exert their strength and a rebound may come at any time.
Therefore, in the short term, I do not advocate chasing short gold; instead, I prefer to try to find the bottom and go long gold in the 3290-3280 area; but we should note that because gold is currently in an obvious short trend, we should appropriately reduce the expectation of gold rebound, so we can appropriately look at the rebound target: 3305-3315 area.
Data is about to be released. Where will gold go?Yesterday, the market expected a trade agreement between the United States and its trading partners, which boosted risk sentiment, and the strengthening of the US dollar and the rise in US bond yields further added pressure on gold prices. Gold fell 1% during the day and once lost the $3,300 mark during the session.
After gold bottomed out and stabilized at 3,320 on Monday, it fell sharply above 3,320 again on Tuesday and has now completely fallen below 3,320. The position of 3,320 is very important. In the 3,320-50 range, it chose to break down at 3,320 again.
Today, the Federal Open Market Committee of the United States will release the minutes of the June monetary policy meeting. Although Federal Reserve Chairman Powell remained neutral on the June interest rate decision, many Federal Reserve officials released dovish signals. Federal Reserve Board member Bowerman has turned to support the possibility of a rate cut in July.
From a technical point of view, the market has penetrated into the area around the lower support of 3,275-3,295.
The rhythm of the entire market is still a process of oscillating decline. From the perspective of pressure position, the daily MA5 average line has not fallen below, and may fall again to around 3270. Once the market falls too fast and approaches this position, there is a high probability that there will be a rebound demand.
Operation strategy:
Buy near 3375, stop loss at 3365, profit range 3315-3320.
Continue to hold position after breakthrough.
Buy Gold! The short-term bottom may have appeared!Gold continued to retreat yesterday and hit a recent low, reaching around 3287. Then gold gradually rebounded to above 3300. Relatively speaking, the rebound momentum was weak. It is expected that the long and short sides will fight fiercely around 3300. However, from the recent characteristics of gold operation, it can be seen that although the short position of gold is strong, it is difficult to continue in the short term, and I think the short-term decline of gold is basically in place, so at this stage, in terms of short-term trading, I do not advocate shorting gold directly;
As gold did not continue to fall after reaching around 3287, on the contrary, it gradually rebounded to above 3300, which may strengthen the market's consensus on the short-term bottom, thereby attracting the favor of off-site funds; from the current gold structure, if gold can maintain above 3300-3295, it may be combined with the 3287 low to build a "W" double bottom structure, which is conducive to supporting the rebound of gold.
However, as gold fell below 3300 again, the bearish trend is relatively strong, so we need to moderately lower our expectations for a gold rebound. In the short term, gold is under pressure in the 3315-3325 area, so we can temporarily look to this area for the rebound target. Therefore, in short-term trading, I do not advocate shorting gold directly, and you can first consider going long on gold in the 3300-3295 area, TP: 3310-3320-3330.
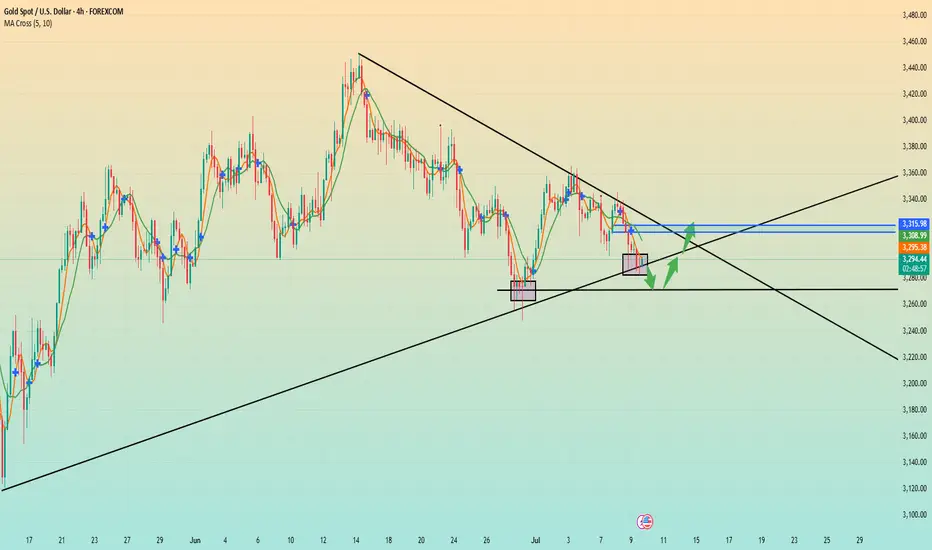
XAUUSD h4 buying target levelsGOLD (XAU/USD) - 4H Analysis
Price is currently reacting from a well-defined support zone (demand area) near $3,250–3,270, which previously acted as strong resistance and now flipped to support.
🔍 I'm watching for bullish confirmation from this zone for a potential upward move toward the next resistance levels.
🎯 Targets:
Target 1: $3,400 (First key resistance)
Target 2: $3,460 (Major resistance & previous high)
📉 If price fails to hold above the support area, this setup will be invalidated. Risk management is key.
This idea is based on structure breakout and price respecting previous resistance turned support zone.
📊 Levels:
Support (Entry Area): $3,250 – $3,270
Target 1: $3,400
Target 2: $3,460
Invalidation Below: $3,240
#GOLD #XAUUSD #PriceAction #TradingSetup #BuySetup #4HChart #ForYou #BreakoutTrade #SmartMoney #ForexAnalysis #LiquidityGrab
CAPITALCOM:GOLD
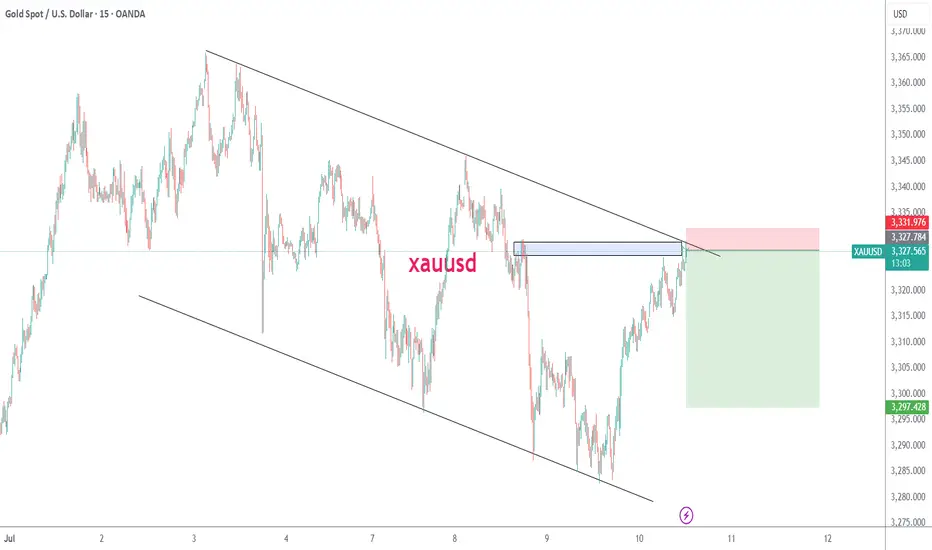
XAUUSD Short / Sell Setupwait for the entry and place tp & SL, must use SL, never exceed more than 2% on SL of your portfolio on any trade. If tp is achieved first then trade setup will be invalid.
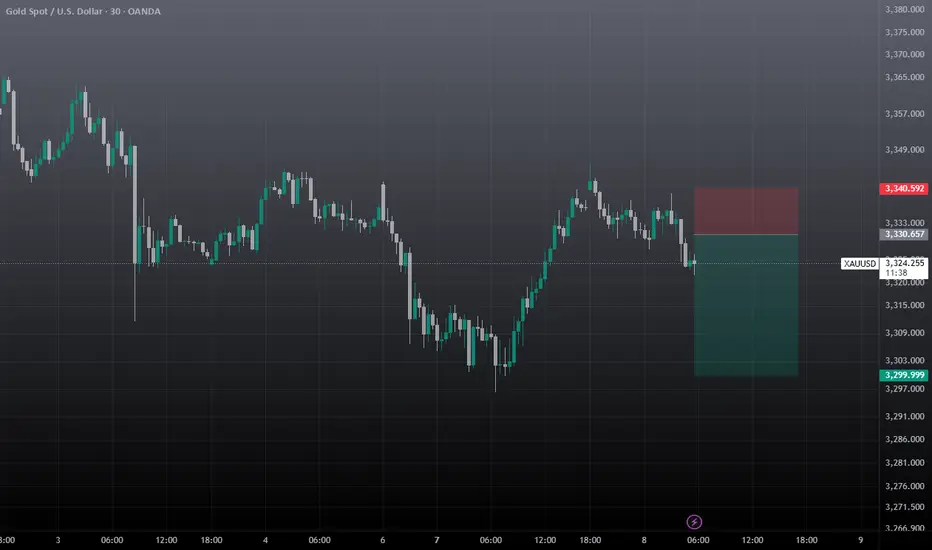
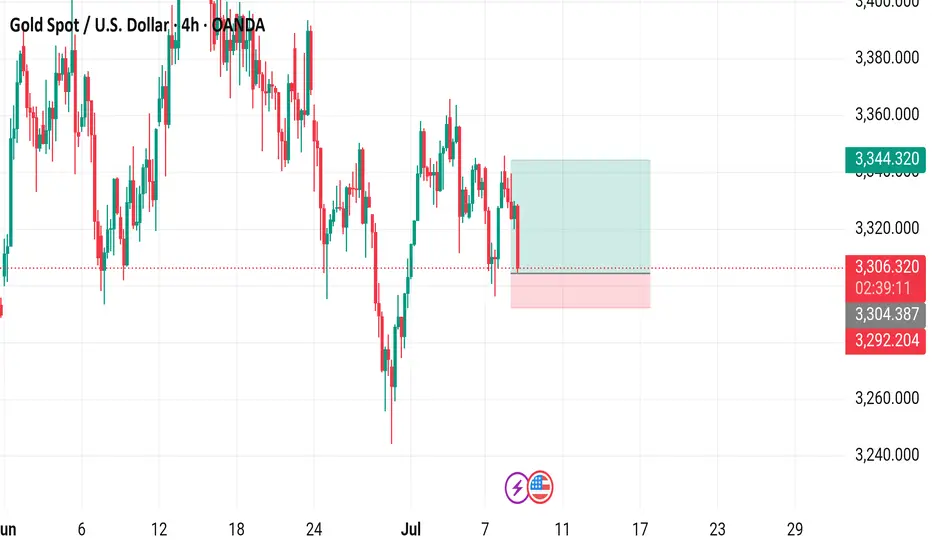
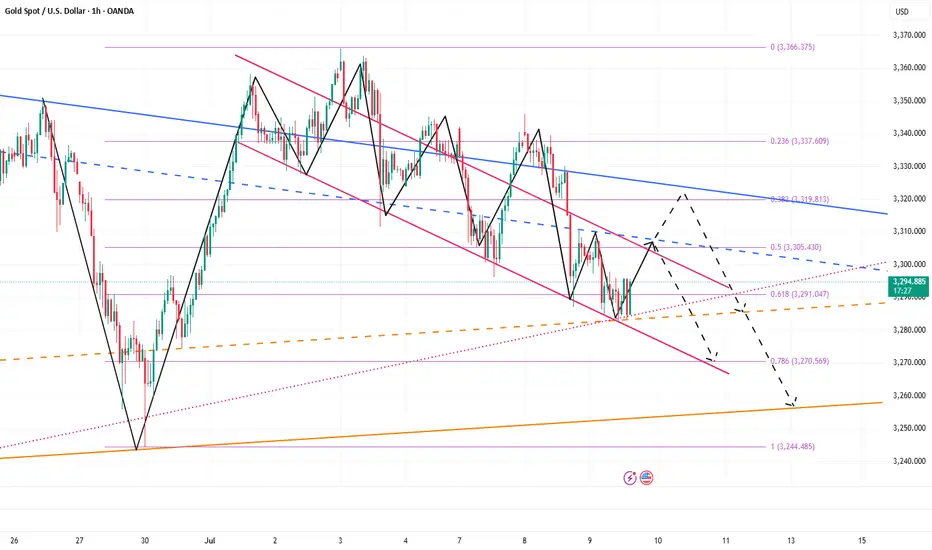
Gold Spot / U.S. Dollar (XAUUSD) 4-Hour Chart - OANDA4-hour chart from OANDA displays the price movement of Gold Spot (XAUUSD) against the U.S. Dollar. The current price is $3,805.780, reflecting a decrease of $30.660 (-0.92%). Key levels include a sell price of $3,305.390 and a buy price of $3,305.940. The chart highlights recent volatility with a shaded area indicating a potential support or resistance zone around $3,344.320. The time frame spans from late June to early July 2025, with the latest data point at 02:41:15 on July 8, 2025.