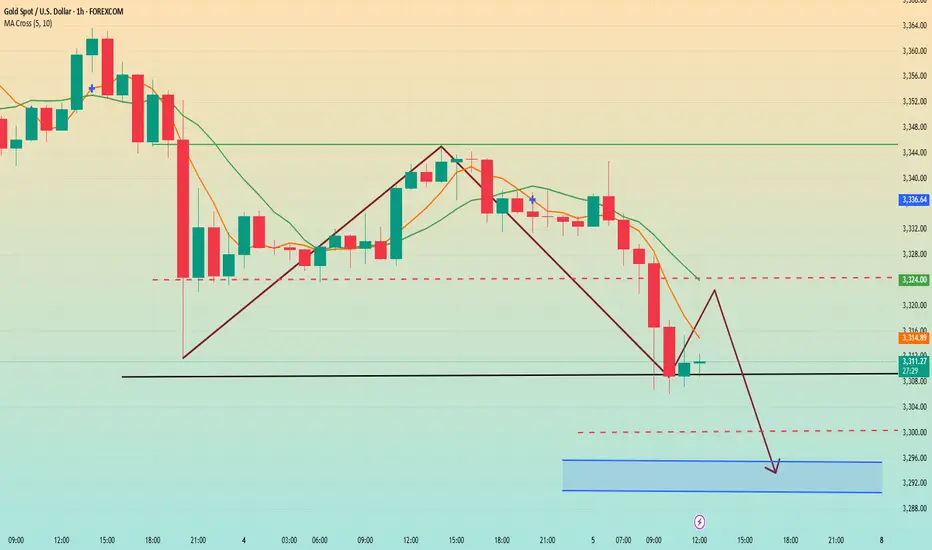
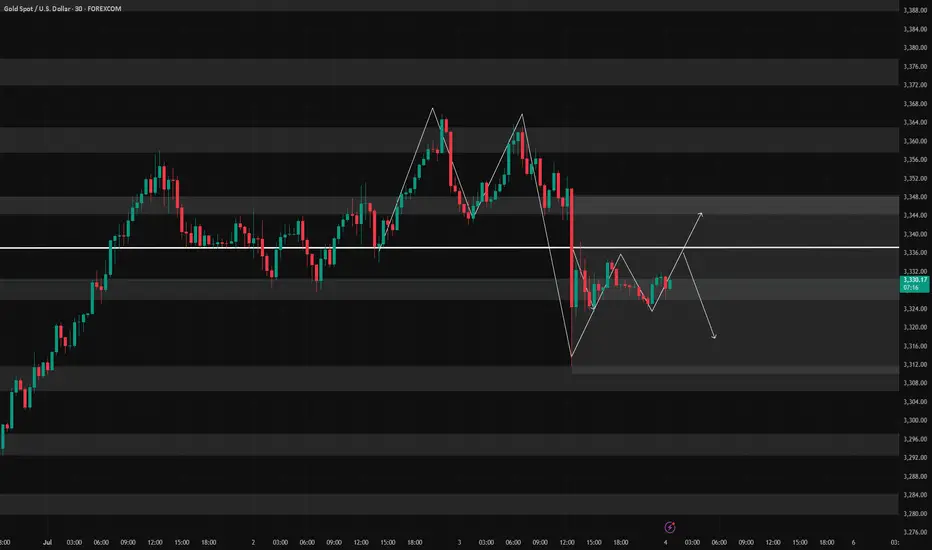
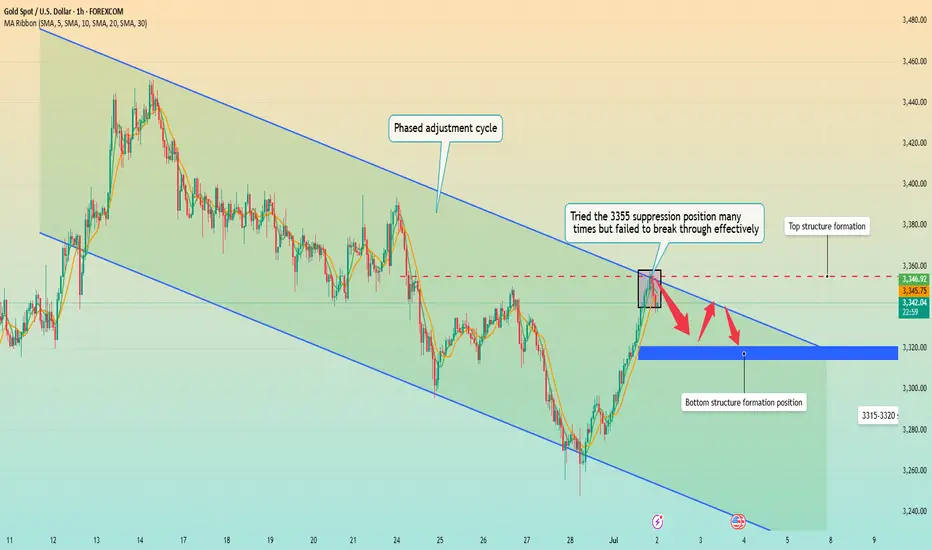
Data is about to be released. Where will gold go?Yesterday, the market expected a trade agreement between the United States and its trading partners, which boosted risk sentiment, and the strengthening of the US dollar and the rise in US bond yields further added pressure on gold prices. Gold fell 1% during the day and once lost the $3,300 mark during the session.
After gold bottomed out and stabilized at 3,320 on Monday, it fell sharply above 3,320 again on Tuesday and has now completely fallen below 3,320. The position of 3,320 is very important. In the 3,320-50 range, it chose to break down at 3,320 again.
Today, the Federal Open Market Committee of the United States will release the minutes of the June monetary policy meeting. Although Federal Reserve Chairman Powell remained neutral on the June interest rate decision, many Federal Reserve officials released dovish signals. Federal Reserve Board member Bowerman has turned to support the possibility of a rate cut in July.
From a technical point of view, the market has penetrated into the area around the lower support of 3,275-3,295.
The rhythm of the entire market is still a process of oscillating decline. From the perspective of pressure position, the daily MA5 average line has not fallen below, and may fall again to around 3270. Once the market falls too fast and approaches this position, there is a high probability that there will be a rebound demand.
Operation strategy:
Buy near 3375, stop loss at 3365, profit range 3315-3320.
Continue to hold position after breakthrough.
Xauusdtrade
XAUUSD:Sharing of the Latest Trading StrategyAll the trading signals this week have resulted in profits!!! Check it!!!👉👉👉
Gold Market Analysis:
Overnight Dynamics: Following Trump’s reinstatement of tariffs, gold’s safe-haven demand drove another rally, but it still pulled back after facing pressure at the 3345 level. The decline extended today, requiring attention to the sustainability of safe-haven flows—recently, safe-haven-driven rallies have often been followed by pullbacks, so caution remains warranted for further gold corrections.
Technical Trends:
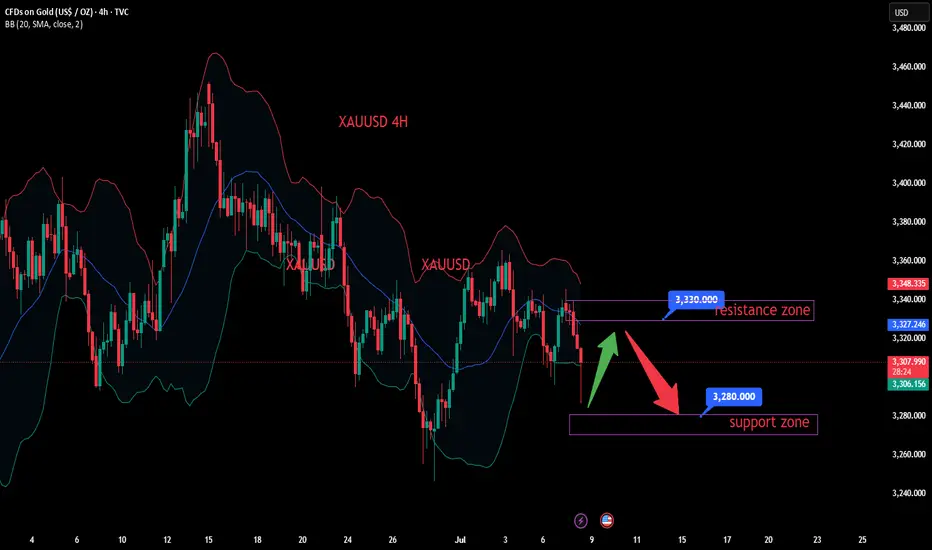
On the daily chart, gold continues to trade in a narrow range, with short-term moving averages essentially converging and flattening, suggesting a high probability of continued sideways movement in the near term.
The current range is temporarily compressed between 3285–3345, with the market bias leaning toward a "range-bound bearish" trend.
Trading Bias: Maintain a bearish stance on rebounds!
Trading Strategy:
Sell@3330-3320
TP:3300-3280
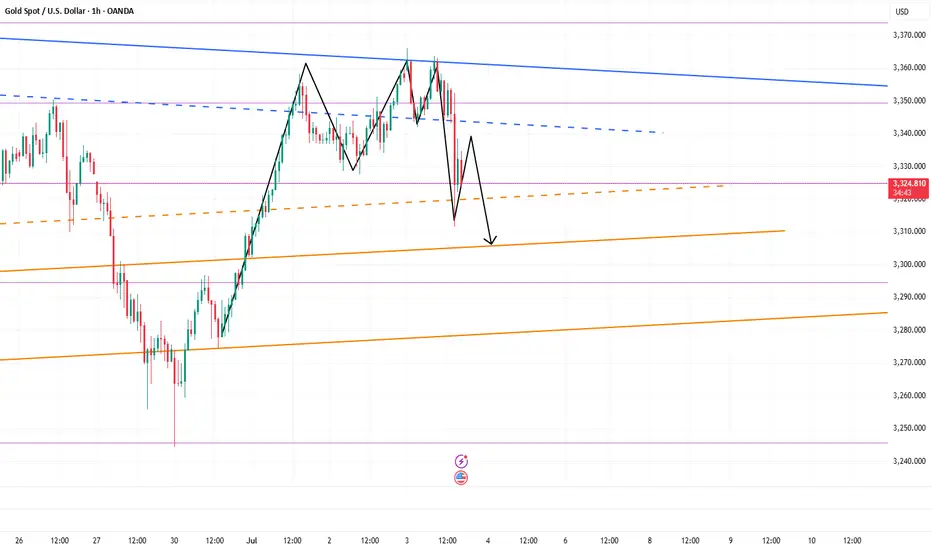
Gold is going down without any signs. Will it continue?Yesterday's seemingly strong rise in gold's safe-haven market may make people mistakenly think that gold is going to rise sharply, but the recent safe-haven market has poor sustainability and poor upward momentum, and cannot maintain the continuation of the upward trend.
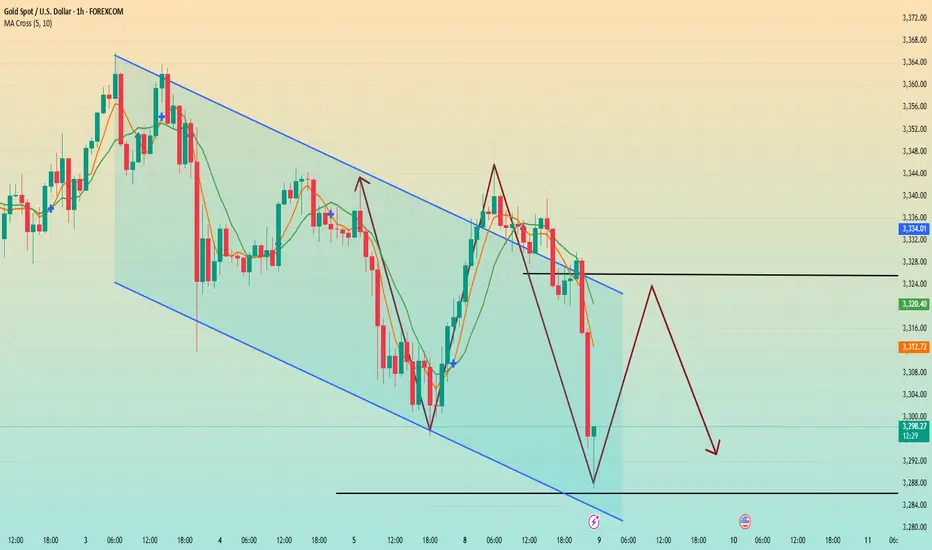
Looking at gold in 1 hour, after the price surged, it continued to fall under pressure at 3345. 3345 is also the recent key position for long and short positions. The 1-hour moving average of gold is still in a short position and continues to diverge downward. The short-term short momentum of gold still exists. I think the price will still fall after the rebound. Gold started to fall directly at 3330, and 3330 formed a strong resistance for gold in the short term. The downward low point did not continue after touching 3288. The current price rebounded and fluctuated around 3295. So we can sell high and buy low around 3385-3325.
Gold fluctuates. Beware of highs.On Monday, the U.S. dollar index rose sharply, reaching an intraday high of 97.65 as Trump announced that he would impose new tariffs on a series of countries including Japan and South Korea on August 1.
Spot gold fell first and then rose. It once fell below the $3,300 mark during the session, but then rebounded strongly in a V-shaped manner by nearly $40. As of now, it has stabilized above 3,330.
From the current daily line:
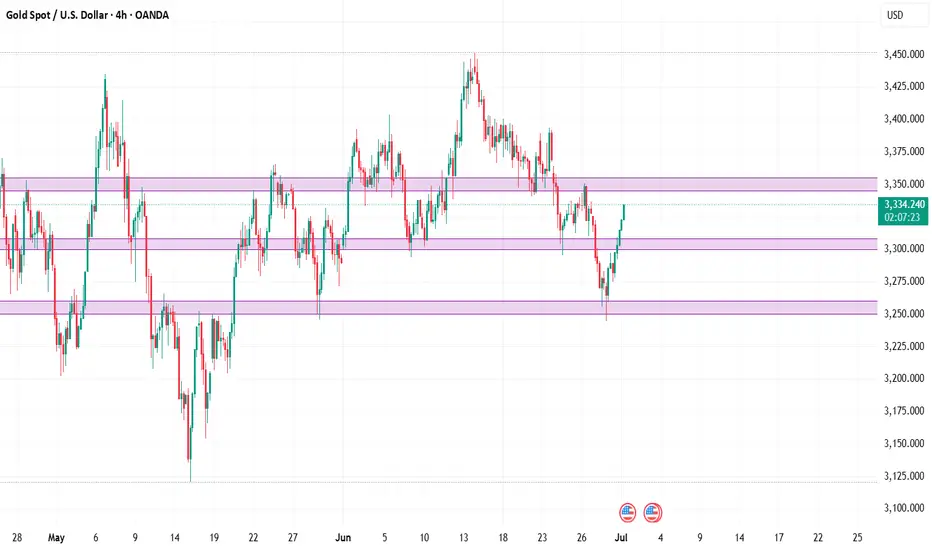
3,320 is the absolute support position for gold at present. Although it fell below 3,320 yesterday, Monday, it then reversed and stabilized above 3,320. For now, the daily line still cannot close below 3,320. If it closes below 3,320, the decline may open further. On the contrary, the current upper suppression position of gold is around 3,350. That is to say, it is basically maintained at 3,320-50 for rectification.
If the daily line stabilizes at 3350 again, the bulls may rise again.
From the 4-hour chart, gold currently shows signs of a head and shoulders bottom. If the 4-hour chart stabilizes above 3340 again, the suppression level of 3350 may be directly broken. Next, it may directly touch the high level of 3380-90. Therefore, in terms of operation, I suggest that you can maintain long positions at 3320-30.
The first target is 3340-50. As long as the 4-hour chart stabilizes above 3340, you can continue to look at 3380-90.
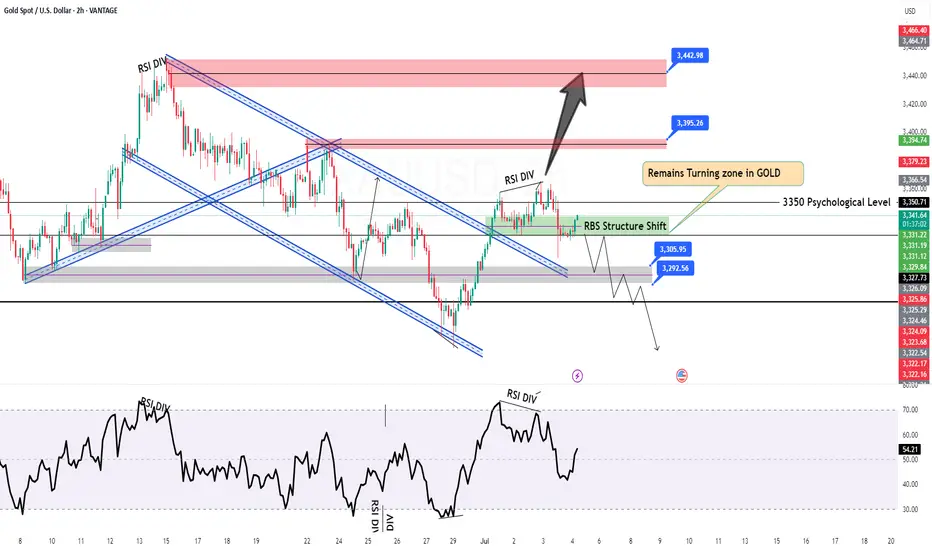
XAU/USD Eyes Key Resistance Amid Fresh Tariff Fears🟡 TVC:GOLD Gold Price Forecast: XAU/USD Eyes Key Resistance Amid Fresh Tariff Fears
OANDA:XAUUSD Spot gold (XAU/USD) is recovering from intraday lows near $3,296, now trading around $3,330 as fears over renewed U.S. tariffs fuel safe-haven demand. President Trump has begun issuing formal letters announcing fresh import tariffs—25% on South Korea, additional measures on Japan, and a 10% universal tariff on countries aligning with BRICS. With the 90-day tariff pause expiring August 1 and no trade progress in sight, geopolitical and economic uncertainty continue to support gold’s floor.
📉 Technical Structure
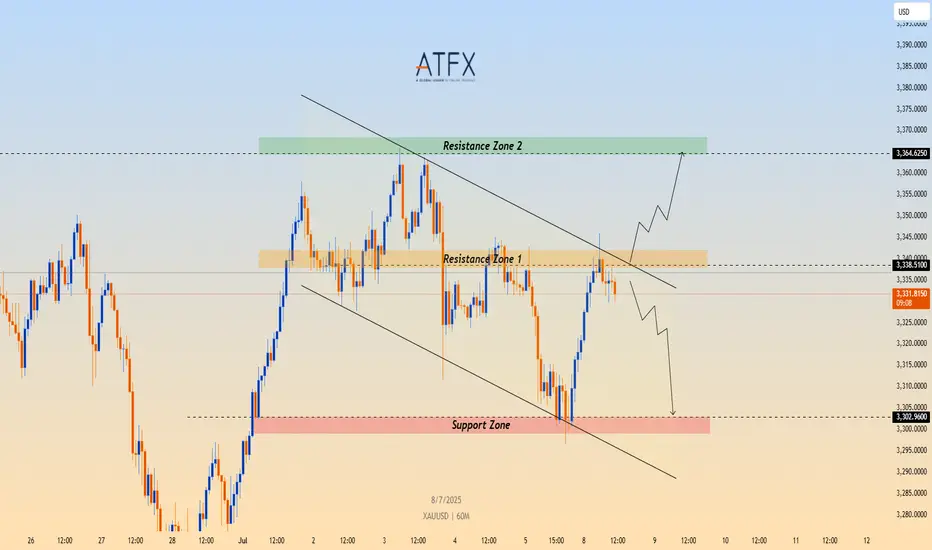
XAU/USD remains within a descending channel on the 1H chart, with price currently approaching the $3,338–$3,340 Resistance Zone 1. A clean breakout above the upper channel boundary could trigger a move toward the broader $3,364 Resistance Zone 2. Conversely, failure to break above Resistance Zone 1 would keep the bearish channel intact, with downside targets toward the $3,302–$3,305 support zone.
📌 Key Technical Zones
Resistance Zone 1: $3,338–$3,340
Resistance Zone 2: $3,364
Support Zone: $3,302–$3,305
Channel Structure: Bearish unless broken to the upside
📘 Strategy Summary
XAU/USD is showing signs of short-term recovery, but remains technically capped unless it breaks through $3,340 resistance. As long as the descending channel holds, rallies may be sold into. A confirmed break above $3,340 could shift bias toward $3,364, while rejection may reopen the path to $3,305 and potentially lower.
⚠️ Disclaimer
This analysis is for informational purposes only and does not constitute investment advice. Please consult a licensed financial advisor before making trading decisions.
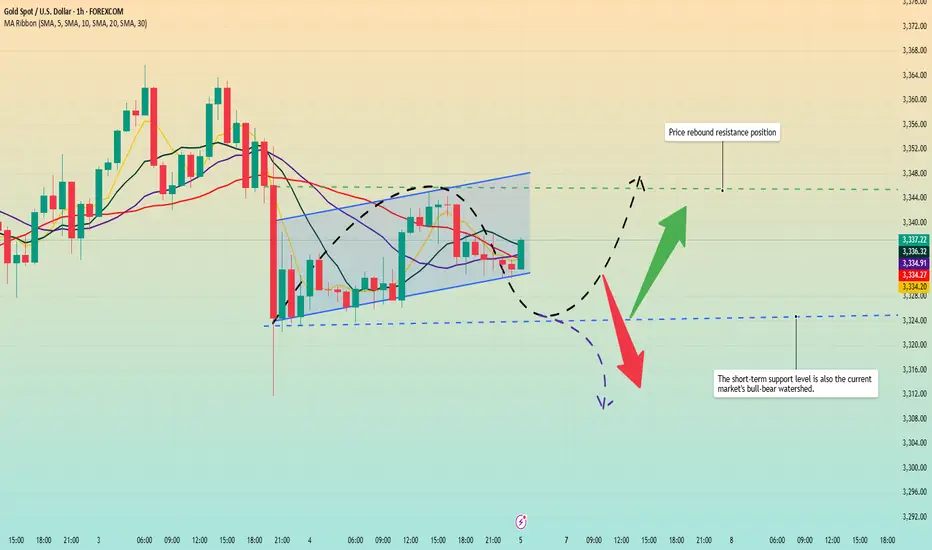
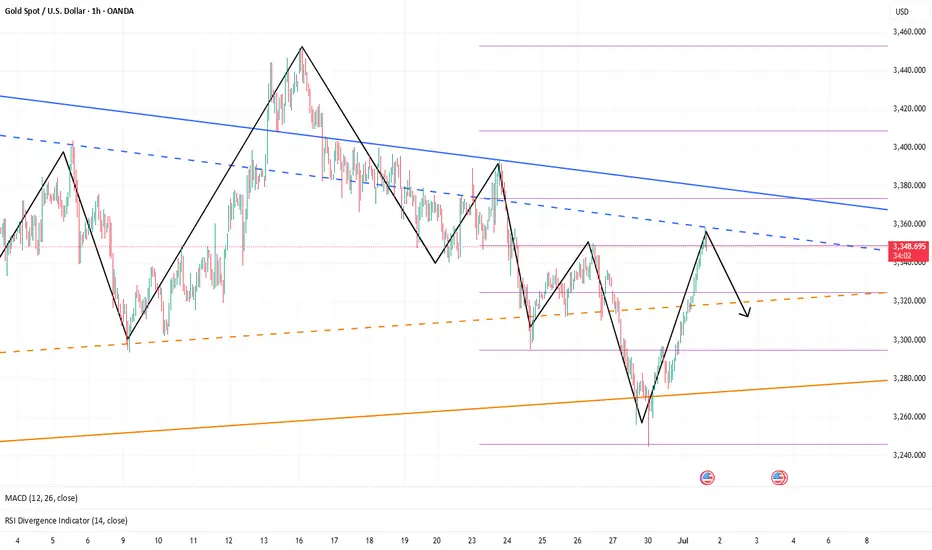
Gold rebounded from the bottom. Is the decline over?Gold prices faced selling pressure in today's Asian market. The price fell from 3343 to around 3320 in the early Asian session. The European price continued to fall, reaching a low of around 3296, and then rebounded upward. The current price is fluctuating around 3320.
Most investors will focus on the minutes of the Federal Open Market Committee (FOMC) meeting to be released on Wednesday to get guidance on the trend.
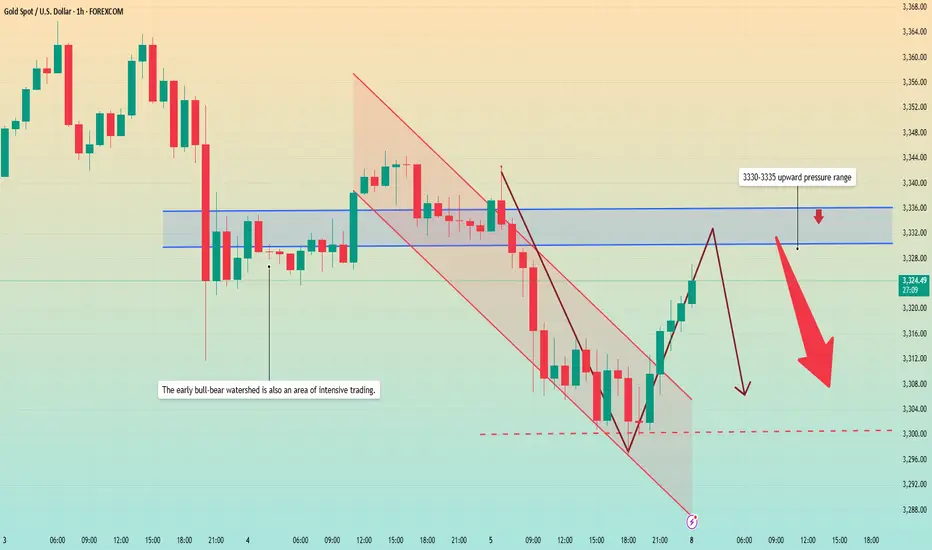
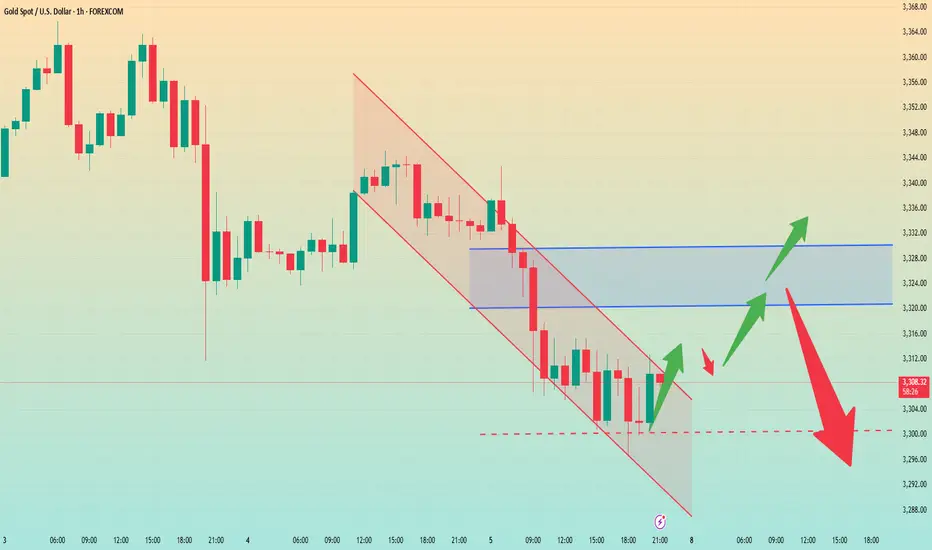
From the hourly chart, the upper pressure position is constantly being corrected. The current average pressure value is around 3330-3335. At the same time, this position is also the watershed between long and short positions in the previous dense area. The price may rebound to this position again. The lower support level is in the range of 3300-3290.
Quaid believes that the current market is still showing a downward trend, and the price may fall back below 3300 again.
Operation strategy:
Short around 3330, stop loss 3340, profit range 3310-3300, sustainable ownership after breakthrough.
Gold fluctuates downward. Do not short blindly.Today, gold is in a consolidation downward trend, with the lowest point reaching around 3296; it has rebounded slightly to around 3310. From the overall market, gold is indeed in a short trend. However, do not continue to short, which is very dangerous.
Because from the hourly chart, although the low point of gold is constantly refreshing, the key hourly chart support range position has not yet broken.
So, here I may think that gold may still be tempting to short in the short term. There is still a possibility of a pullback here on the hourly chart. From the current point of view, there is still a probability of a pullback to 3320-30 before the range is broken. In terms of the next operation, I suggest that you can pay attention to 3320-30.
However, if it really pulls up again, as long as it does not stand above 3330 again. Then, we can short here at 3320-30. On the contrary, if the rebound directly breaks above 3340, then be careful. The rebound may turn into a trend reversal, and it is very likely to replicate the rhythm at the beginning of last week.
The bill was introduced; the price did not rise but fell.Due to the implementation of the US bill, most traders in the market are bullish on gold and believe that gold will soar on Monday. As a result, it jumped up and fell sharply this morning. This is the uncertainty of the market. Although the short position given near 3340 last Friday was late, it fell to the low point of 3306 at the opening of the Asian market today.
In addition, the key to this sharp drop is the high point before the rebound, that is, the starting point or the position of the top and bottom conversion. Once it is broken, you have to change your mindset. The volatile market is like this, just get used to it. The turmoil caused by Trump's bill will not appear for a while. It takes a process and cannot be unilaterally considered as bullish or bearish.
In the early Asian market, the price fell all the way from 3342 US dollars to 3306. How to judge the end of the decline? It is to stare at the high point of the rebound before the last decline of 3320 US dollars. The loss of 3300 US dollars in the early trading indicates that the gap-up opening is a lure for more.
Today, I think that 3325 above 3320 can be used as the dividing point between long and short positions. You can short with a light position near 3315, and pay attention to the 3295-3290 line below. After the upward breakthrough is confirmed, consider adjusting the position and making other arrangements. For the time being, we will look at the weak adjustment during the day.
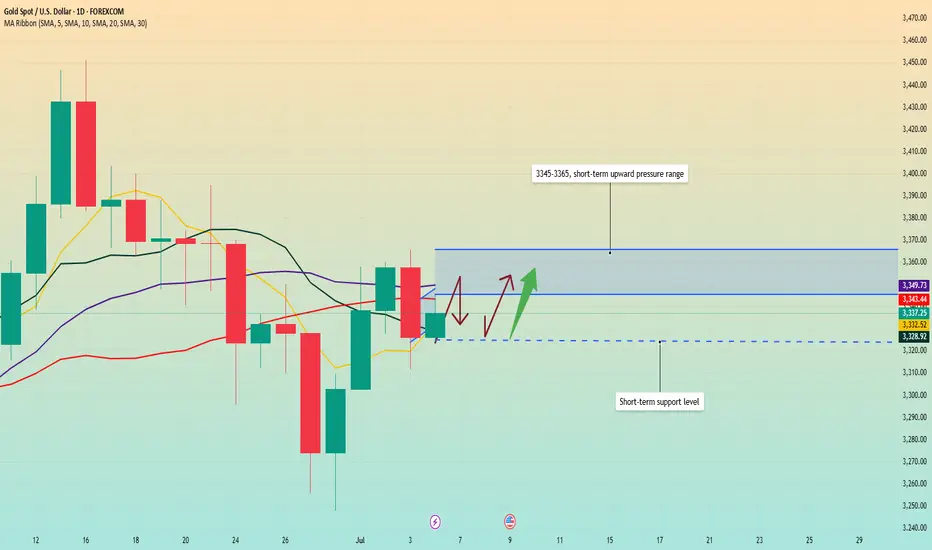
Big changes begin. Dominant trend?Event summary:
The United States passed the Big and Beautiful Act; how to get this part of the tax after the massive tax cut? Then it can only be obtained through other means, and the tariff war initiated by Trump is one of them. At the same time, the bill will increase the federal debt by trillions of dollars, further widening the gap between the rich and the poor.
Immediately after the bill was signed and took effect, Musk announced the establishment of the "American Party". He wrote: We live in a one-party state, not a democratic country. Today, the American Party is established to return your freedom to you. At the same time, Musk posted on July 6, when and where should we hold the first congress of the "American Party"? This will be very interesting.
This event is likely to support the trend change of gold bulls in the short term.
Market analysis:
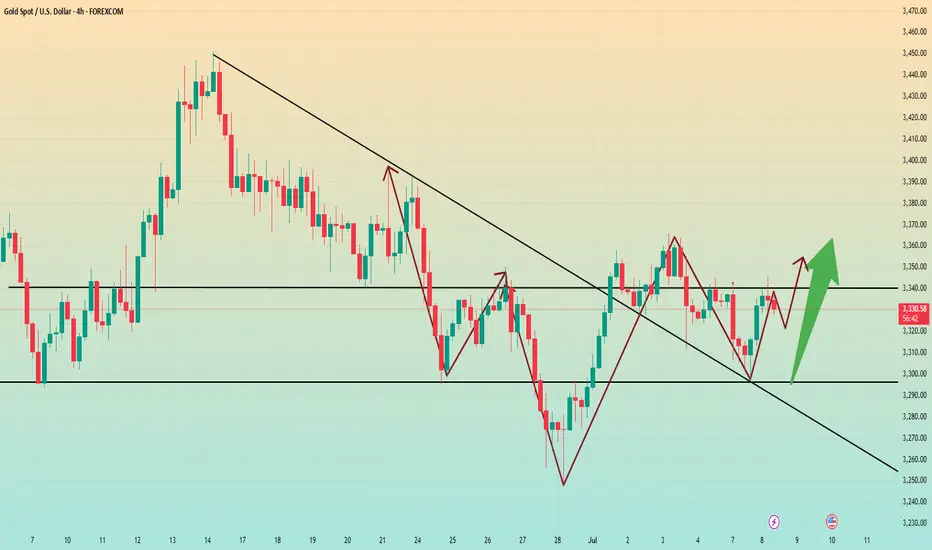
From the daily chart, after bottoming out and rebounding this week, the weekly line closed higher, and there is still upward momentum next week; short-term focus on the pressure of the 3345-3365 range, which is likely to become a key area for long and short competition. Before breaking upward, focus on the high and fall. Pay attention to the support rebound of 3320-3325 area below. Once the upper pressure range is broken, the bullish space will expand, and it is not ruled out that it will hit above 3400 and then go down.
In terms of operation, the price falls back and buy on dips in the 3315-20 area, and pay attention to the profit range of 3345-3365 on the upside.
Gold continues to fluctuate. The direction is uncertain.Gold prices did not have a large continuation breakthrough on Friday due to the impact of the US Independence Day holiday; although the non-agricultural data on Thursday fell rapidly under the unfavorable conditions and formed a bottoming-out situation, the short-term bulls and bears were once again in a deadlock. After a small sideways movement on Friday morning, it rose again. Although it did not break through the upper pressure line of 3345, it still closed in the form of a positive line, which also gave the bulls hope to dominate next week.
At present, the upper key pressure is still maintained at the 3345 line, which is also the first point for the bulls to break through. Once the upper breakthrough is successful, the next target will be maintained at around 3365-3380. The support below is maintained at around 3325. If this position is broken down on Monday, the support of 3325 will not be maintained, and the bears will continue to open the downward channel.
But overall, the market direction is still unclear, and we can conduct trial transactions. Go long when the price falls back to 3325 on Monday in the Asian market, the profit range is 3340-3350, and the stop loss is 3315. If the European market continues to strengthen, you can still go long. If the European market continues to strengthen, we can still continue to go long. Otherwise, we still need to adjust our thinking in a timely manner.
GOLD H2 Intraday Chart Update For 4 July 2025As you can see that GOLD is still in consolidation range above 3300 Psychological Level
Currently prices are still standing @ 3340 nearby Psychological Level, only if market breaks 3368 clearly then it will consider Bullish other below 3368 market still in Bearish Move
Reminder: Today is US Bank Holiday
Disclaimer: Forex is Risky
7/4: Trade Within the 3313–3346 RangeGood morning, everyone!
Yesterday’s intraday trades delivered solid profits. Since the U.S. market will be closed today, news-driven volatility is expected to be limited. Therefore, today’s trading focus will primarily revolve around technical setups.
Current structure:
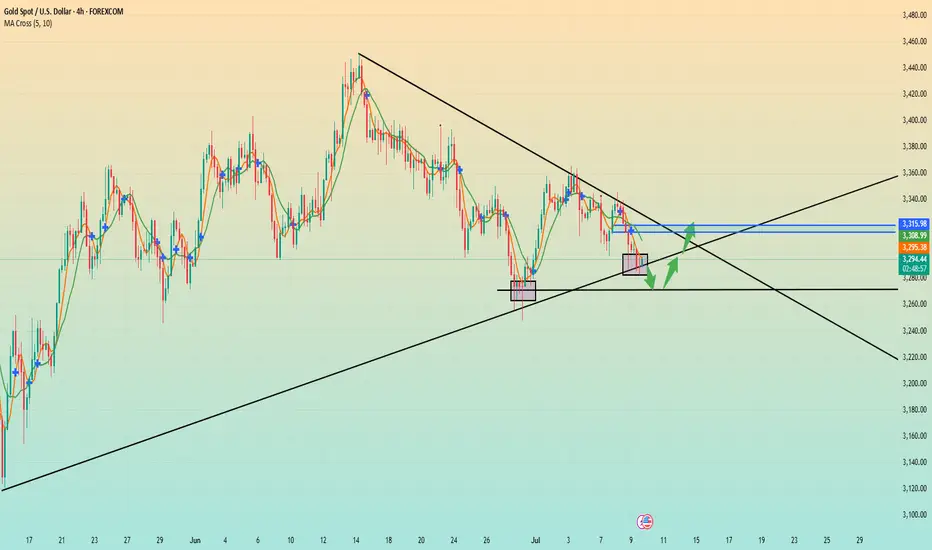
Key support: 3321–3316
Immediate resistance: 3337–3342, followed by 3360
If support holds and resistance breaks, a potential inverse head-and-shoulders pattern may form on the 4H chart, with the next target near 3380
If support breaks, focus shifts to the 3303–3289 support zone
Given the likelihood of range-bound price action today, the suggested intraday range is 3313–3346, with a preference for selling near resistance and buying near support.
If an upside breakout occurs, consider using the MA20 on the 30-minute chart as a guide for pullback entries.
Continue to maintain the rhythm of short tradingUnder the influence of NFP, gold fell sharply as expected. What I had suggested before was proven correct by the market again. "Gold rose in advance to reserve room for the NFP market to fall." After NFP, gold fell to around 3311 and the decline narrowed. Therefore, we accurately seized the opportunity to go long on gold near 3312 and set TP: 3330. Obviously, gold successfully hit TP during the rebound and made an easy profit of 180 pips.
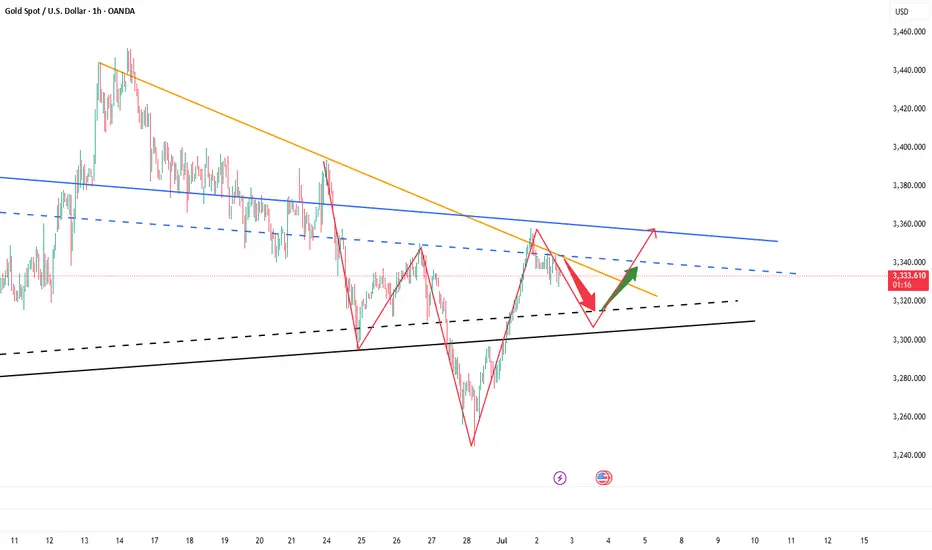
From the current gold structure, gold encountered resistance and retreated twice near 3365, and built a double top structure in the short-term structure. In order to eliminate the suppression of the double top structure, gold still needs to continue to fall after the rebound. After the cliff-like decline of gold, the short-term resistance is in the 3340-3345 area, and the short-term support below is in the 3320-3310 area.
So I think that gold can still continue to short gold after the rebound, and I have already shorted gold around 3336 with the 3340-3345 area as resistance. Now we just need to wait patiently for gold to hit TP. Let us wait and see!
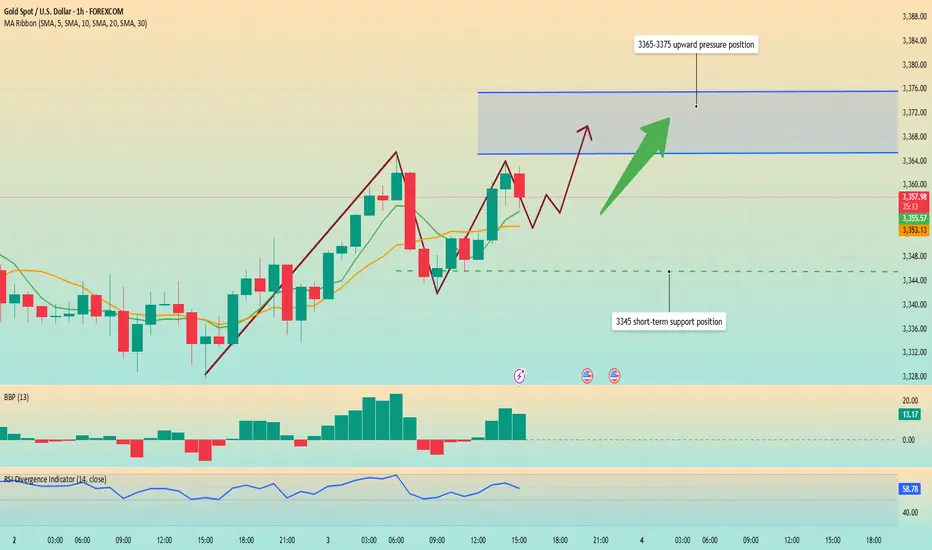
Data is about to be released. Trend change?Affected by the ADP employment data, gold prices broke through 3345 and continued to fluctuate upward to 3365 US dollars. This trend fully shows that the position of 3345 US dollars is the watershed between long and short.
From the 1-hour chart, the overall market is still fluctuating upward. Although it has fallen slightly, I think it is accumulating momentum for a second rise. ADP employment data is negative for the first time. Non-agricultural employment data will be released in 3 hours. The market expects 110,000 jobs. I think the data that may be released will be worse. The number of jobs will decrease and the unemployment rate will also increase, which will drive gold prices to continue to rise.
From a technical perspective, the RSI indicator is currently hovering around 58.7, showing strong upward momentum. MA5-day and 10-day moving averages form a golden cross and continue to rise. The current upward high has not appeared. The gold price may refresh the intraday high of 3365 again.
At present, the upward pressure focuses on 3365-3375 US dollars. The support level is around 3345, which is also the turning point for the upward movement of the MA5 daily moving average.
Operation strategy:
Buy near 3350, stop loss at 3340, and profit range 3370-3375.
Non-farm data is coming. Upward breakthrough?Information summary:
ADP data supports the rise of gold. Secondly, the weaker-than-expected non-farm data has triggered people's hope that the Federal Reserve will cut interest rates earlier. The gold price hit the 3360 mark, then fell back slightly, and is currently fluctuating around 3350.
This Friday is the Independence Day holiday in the United States. The non-farm data will be released on Thursday. Today, we will focus on this data, which will trigger a new trend.
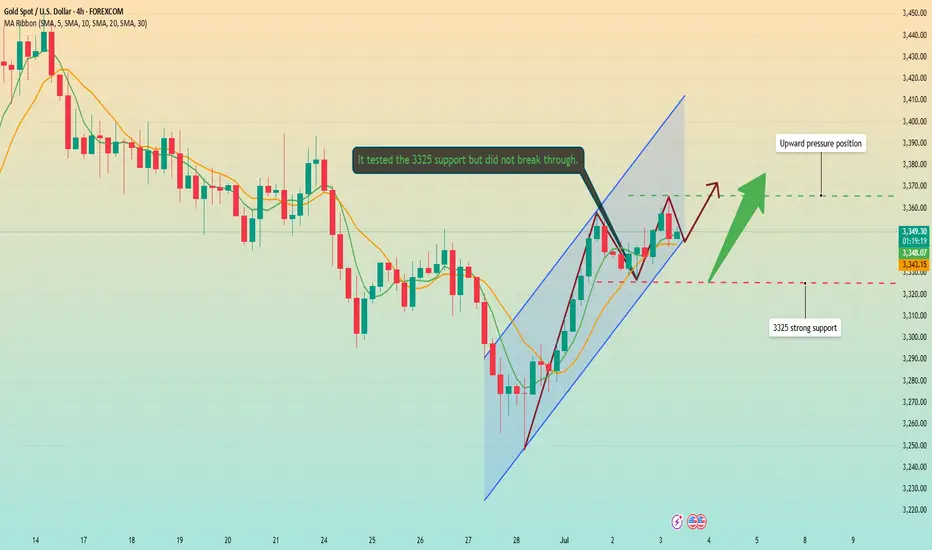
Market analysis:
From the 4-hour chart, gold is currently in a suppressed state. However, it is not ruled out that it will be supported at the bottom as before, and then break through the upper suppression position again with the help of non-farm data.
Therefore, the most critical position today is not above, but near the support of 3325 below. On Wednesday, the support near 3325 was tested many times but did not break down. If the price remains above this position today, the probability of an upward breakthrough is very high.
Based on the current market conditions and the data to be released soon, Quaid recommends that everyone wait and see for a while and wait for the new trend to come. Of course, according to the current forecast data, this will support the rise of gold. A radical approach can also try a long strategy around 3345.
I have shorted gold as expected and held on patientlyEven under the influence of the ADP data, which is bullish for the gold market, gold has not effectively broken through 3350, and even showed signs of falling back after rising several times. The resistance above is becoming more and more obvious, which may further weaken the market's bullish sentiment and confidence, thereby strengthening the dominance of the bears.
Although gold has not effectively fallen yet, from the perspective of the gold structure, even if gold wants to rise, it still needs to be backtested and support confirmed before rising, and the current retracement is far from enough, so gold still has a need for structural retracement; and before the NFP market, gold rose slowly but was far from enough to break upward, and there was no volume support, so the illusion of gold rising may be to lure and capture more bulls;
Therefore, out of caution, I try to avoid chasing gold at high levels; and I believe that shorting gold is still the first choice for short-term trading at present. And I have executed short trades in the 3340-3350 area according to the trading plan, and held it patiently. I hope that gold can retreat to the 3320-3310-3300 area as expected.
Exclusive trading strategy, short gold!From the current gold structure, we can see that gold still needs to continue to retest the 3320-3310, or even the 3305-3295 area; so in the short term, we can still seize the opportunity to consider shorting gold in batches in the 3340-3360 area.
Trading signal:
@3340-3360 Sell, TP:3325-3315-3305
A reliable trader must have an explanation for everything and respond to everything. I have always been committed to the market and insist on writing the most useful core strategies for traders. The transaction details can be seen in the channel!
I hold on to my short position and wait patiently.Currently, gold continues to rebound to around 3358, and there has been no decent retracement during the rebound, so during the trading period, apart from chasing the rise, there are almost no opportunities to go long on gold; so is the steady rise in gold during the day brewing a bigger rally?
I think there are three reasons for the continued rise of gold:
1. The continued weakness of the US dollar provides support for the strong rise of gold;
2. The trapped long chips have recently shown self-rescue behavior, and strong buying funds have driven gold up;
3. The market intends to eliminate and kill a large number of shorts in recent times;
Based on the above reasons, I think it is not a wise decision to chase gold at present; on the contrary, I still prefer to short gold in the short term, and I still hold a short position now; the following are the reasons to support my insistence on shorting gold:
1. The US dollar has a technical rebound demand after a sharp drop, which will limit the rebound space of gold and suppress gold;
2. After the recent trapped long chips successfully rescue themselves, they may cash out in large quantities, thereby stimulating gold to fall again;
3. While killing the shorts, the market has also lured a large number of long funds to a certain extent. Based on the above reasons, I currently still hold short positions near 3345 and 3355, and hope that gold can retreat to the 3335-3325 area.
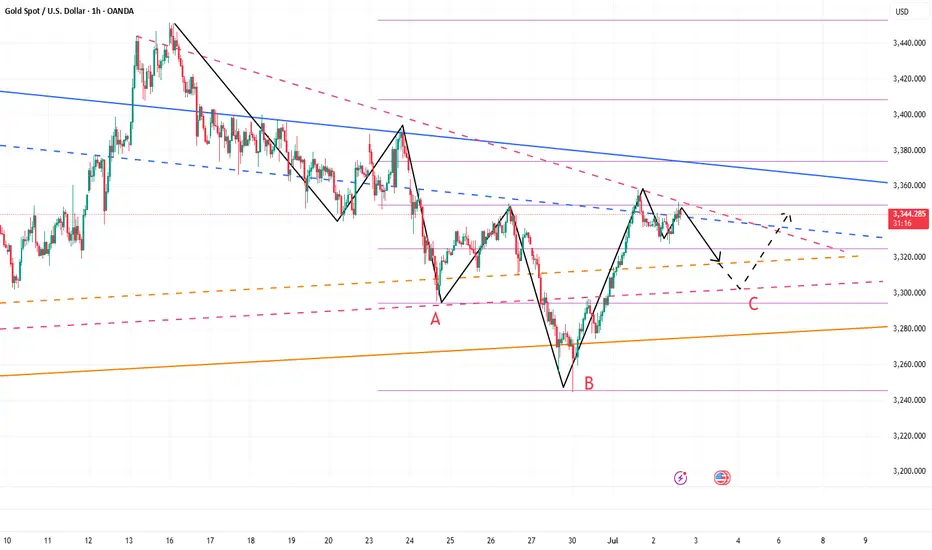
Gold falls back, is a bottom structure emerging?In terms of one-hour structure, this round of phased adjustment started from 3450 has not ended yet, but it will soon, especially the rapid rebound after the bottom of 3260 on Monday. This rebound has strong momentum. After bottoming out and rebounding, it is currently fluctuating around 3340, with a large overall span. This also shows that after the price has risen, the amplitude of the correction has increased, which means that the upward space is limited. This adjustment is likely to be over soon, but there is no definite bottom structure yet, so we need to wait for some time.
Before going out of the definite bottom structure, based on the principle of following the trend, you can try to short with a light position. At present, in terms of the one-hour pattern, the key point is here at 3355, and it is currently falling back from this position to 3340. If it falls back to the 3320 area today and stabilizes above it, you can operate a long strategy. On the whole, Quaid suggests that the short-term operation strategy for gold today should be mainly long on pullbacks, supplemented by shorting on rebounds.
Operation strategy:
Short at 3345, stop loss at 3355, profit range 3330-3325.
Long at 3320, stop loss at 3310, profit range 3340-3345.
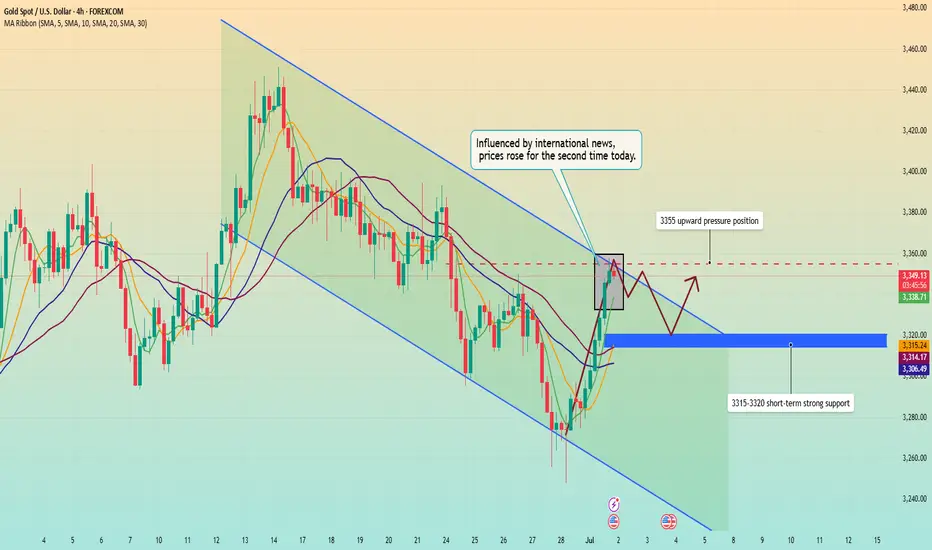
Gold surged and then fell. Has it reached its peak?Information summary:
Today, the United States and Japan negotiated on tariffs. Trump said that the US-Japan deal was unfair and might send a letter to Japan; the US-Japan trade negotiations seemed to be at a standstill. Trump also threatened that he would not extend the expiring tariff period and would send letters to most countries and regions in the next few days.
Secondly, the United States accused the EU of unfair digital legislation and asked the EU to relax its supervision of US technology giants. In addition, Trump accused "Mr. Too Late" Powell and the entire committee on social media that they should be ashamed of not cutting interest rates.
Affected by the above news, gold's risk aversion sentiment heated up and prices started to rise for the second time.
Market analysis:
From the 4-hour chart, the market is currently in a slow upward trend in a downward channel, and the price is also repeatedly testing the upward pressure position of 3355. MA5-day and 10-day moving averages turned upward and crossed with the 20-day and 30-day moving averages. At present, the upward momentum is slightly insufficient. In the short term, we should focus on the suppression position of 3355. If we fail to break through this position for a long time, the trend will most likely turn into a downward trend. If no black swan event occurs, today's price will most likely fluctuate around the 3320-3350 range. If there is no black swan event, the price today will most likely fluctuate around the range of 3320-3350.
Operation strategy:
Short near 3355, stop loss 3365, profit range 3340-3330.
Long near 3315 when the price falls back, stop loss 3305, profit range 3340-3345.
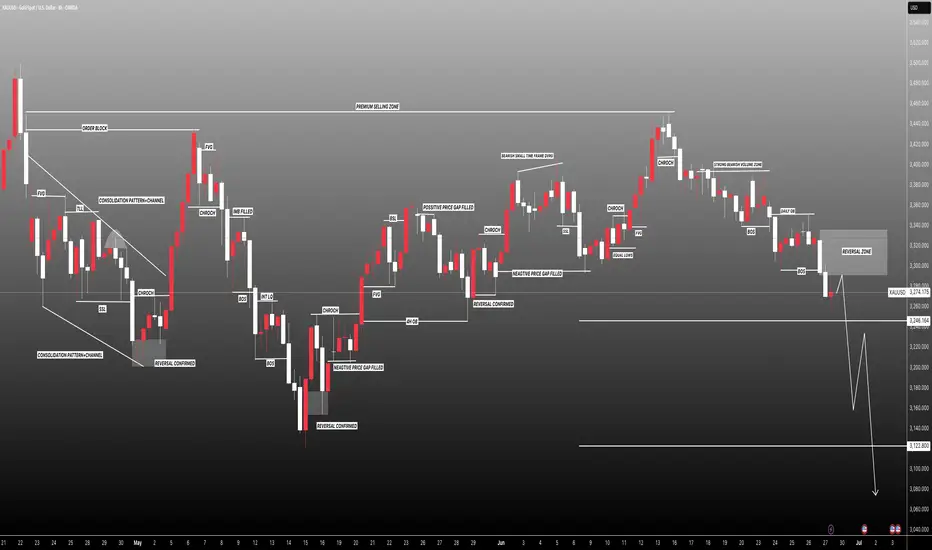
#XAUUSD(GOLD)): 29/06/2025 Last Analysis Going Great!Gold has been moving nicely since our last analysis, which we posted. Currently, 750+ pips have been generated, and we expect further price drops. There are still two targets in place, as per our previous analysis. We anticipate a steady decline in the price. We recommend all of you to follow strict risk management. This is not a guaranteed analysis or view, but rather an overview/educational chart analysis.
If you want to support us, you can do the following:
- Like
- Comment
- Share
Team Setupsfx_
#XAUUSD 30MIN 📉 #XAUUSD 30m Sell Setup – Bearish Continuation Ahead
Gold is currently retracing after a strong drop, consolidating within a short-term Supply Zone. We anticipate a temporary bullish push toward the 3345–3350 premium area, where the broader bearish trend is expected to resume.
🔻 Sell Zone: 3345 – 3350 (Supply / OB Zone)
🎯 Targets: 3300 → 3260
❌ Stop Loss: Above 3358
⚠ Note: This is a short-term retracement, not a trend reversal.
We expect selling pressure to return once price taps into the 3350 Order Block, in line with the higher timeframe bearish structure.
#gold #XAUUSD #forexsignals #SmartMoney

Gold (XAU/USD) Technical Outlook — July 1, 2025In the world of financial markets, few assets capture global attention like gold. A timeless store of value, gold continues to act as both a hedge against uncertainty and a battleground for technical traders seeking high-probability setups. As of today, gold (XAU/USD) is trading at $3328, a level that places it just beneath the most recent multi-month high at $3345. The recent surge in price is underpinned by both macroeconomic factors and bullish technical structure. However, as any seasoned trader knows, trends rarely move in straight lines — and gold is now approaching a technically sensitive juncture.
I. Gold’s Structural Landscape on the 4-Hour Chart
The four-hour chart reveals a textbook bullish trend. Beginning with a significant impulse from the $3194 base, gold has climbed steadily, printing higher highs and higher lows. The most recent break of structure (BOS) above $3312 confirmed the continuation of bullish intent, while the market remains firmly above key swing lows — signaling that the bullish regime has not yet been invalidated.
Price action shows clean, impulsive expansions followed by short consolidations, with buyers continuing to absorb supply at every retracement. Despite that strength, gold has now reached a potential exhaustion point, with the price reacting to overhead supply at $3345–3355, forming what could be an early-stage distribution zone.
Key Market Structure Developments:
BOS at $3312: confirms uptrend
No CHoCH (Change of Character) yet — no confirmed bearish reversal
Clean liquidity grab above $3345, followed by rejection — hinting at short-term profit-taking or internal bearish intent
II. The Fibonacci Grid: Retracement and Extension Zones
Applying Fibonacci retracement from the $3194 swing low to the $3345 high offers crucial levels of interest. The golden ratio at 61.8% ($3253) aligns perfectly with prior demand and a 4-hour bullish order block. Similarly, the 38.2% level at $3285 corresponds with a minor liquidity pool and potential reaccumulation base.
Fibonacci Level Price
23.6% $3308
38.2% $3285
50.0% $3269
61.8% $3253
78.6% $3228
On the extension side, should gold resume its rally beyond $3345, projected Fibonacci targets sit at $3372 (127.2%) and $3410 (161.8%), with both acting as measured projections for trend continuation.
III. Supply and Demand: Mapping Institutional Footprints
Institutional activity is best observed through unmitigated supply and demand zones — areas where large orders caused rapid price displacement. Gold currently trades between two such zones:
Demand Zone: $3250–$3260 — a sharp bullish rejection occurred here on the last visit, indicating strong buy-side interest and likely pending buy orders
Supply Zone: $3345–$3355 — where a sell-side liquidity grab recently occurred, followed by a strong rejection candle
These two zones bracket the market and serve as the highest probability areas for future reactions.
IV. The Smart Money Concepts (SMC) Framework
SMC theory revolves around observing the footprints of large market participants — often labeled “smart money.” In gold’s current structure, SMC tools provide a clearer roadmap than standard indicators.
Current Observations:
Break of Structure (BOS): Confirmed at $3312 (bullish continuation)
Change of Character (CHoCH): Absent (bull trend intact)
Buy-Side Liquidity Grab: Above $3345 — trapped breakout buyers likely fuel for reversal
Sell-Side Liquidity Pool: Uncollected beneath $3280 — probable magnet for a liquidity sweep
Fair Value Gap (FVG): Between $3260 and $3280 — price inefficiency offering high-probability reentry for smart money
Bullish Order Block (OB): At $3250–$3260 — final down candle before explosive up move, unmitigated
All these elements point to a high-probability pullback, rather than a full-blown reversal. Until structure is broken with a CHoCH, the base case remains bullish.
V. High-Probability Levels for 4-Hour-Based Opportunities
From this framework, we identify the following key price levels:
The highest-probability reaction is expected at $3250–$3260, where smart money is likely to re-engage if price retraces.
VI. Refinement on the 1-Hour Chart: Intraday Trade Setups
Zooming into the 1-hour chart allows us to fine-tune our execution strategy. Gold is consolidating just below $3330, forming what appears to be an ascending triangle — a common bullish continuation structure — but within the broader context of a possible short-term pullback.
Intraday Trade Idea #1 — High-Conviction Long
Entry: $3260
Stop-Loss: $3245
Take-Profit 1: $3308
Take-Profit 2: $3340
Risk–Reward: ~1:4
Rationale: Aligned with 4H demand, fair value gap, OB, and golden ratio retracement. Structure remains bullish.
Intraday Trade Idea #2 — Speculative Short (Low Conviction)
Entry: $3340–$3350
Stop-Loss: $3362
TP1: $3305
TP2: $3285
Risk–Reward: ~1:2.5
Rationale: Countertrend, only viable if bearish rejection candle forms. Not aligned with dominant 4H structure.
VII. The Golden Setup: Long from Demand + FVG Confluence
Among all technical configurations, the long setup at $3260 emerges as the most compelling. It is supported by:
An unmitigated bullish order block
A clear fair value gap
61.8% Fibonacci retracement
Untouched sell-side liquidity below
Directional alignment with trend
Institutional demand pattern
This setup offers both superior risk-to-reward and a technical foundation that aligns with Smart Money’s modus operandi. It represents a low-risk, high-reward opportunity for traders who wait for price to re-enter the value zone and confirm with bullish order flow (e.g., a bullish engulfing or BOS on 15m).
VIII. Final Thoughts and Tactical Summary
As of July 1, 2025, the gold market reflects strong bullish momentum, albeit entering a corrective phase that should not be mistaken for reversal. While intraday volatility and range compression may tempt countertrend trades, the smartest play remains to wait for a discounted reentry into a zone of value.
Until structure shifts significantly, the dominant trading thesis remains: “Buy the dip into institutional zones”. Patience, not aggression, will separate the retail trader from the professional in today’s complex market structure.