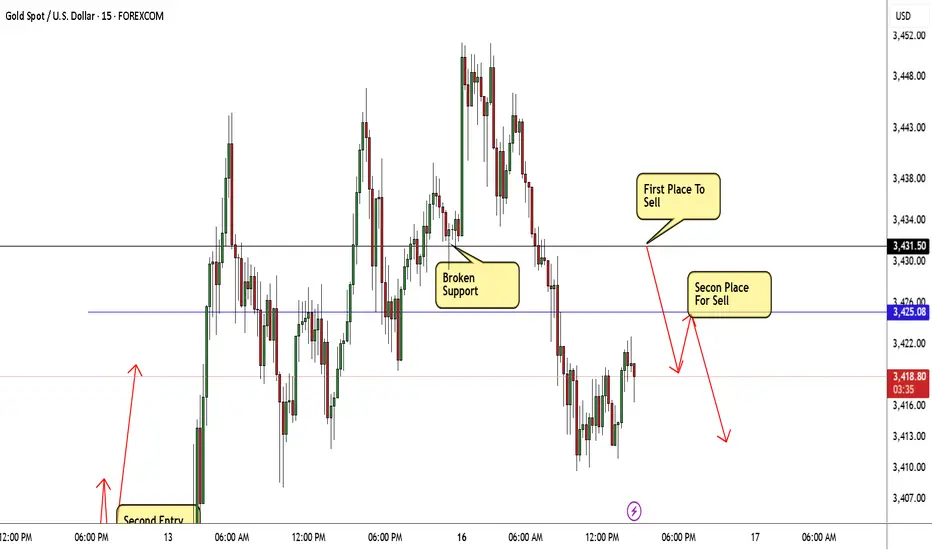
GOLD Best 2 Places For Sell Very Clear To Get 500 Pips !Here is my 15Mins T.F Chart On Gold and here is my fav 2 places to sell this pair , if we take a look on the chart we will see that we have avery good support @ 3431.50 and the price broke it and close below it and now i`m waiting for retest to this broken support and new res , and if i have a good bearish price action i will enter a sell trade and targeting the first support @ 3425.00 and if i have a good closure below it at least with 30 Mins Candle then i can add another contract and targeting the second support , if we have a closure above 3431.50 this idea will not be valid .
Xauusdtrade
The international situation is bad. Gold fell back.Information summary:
Latest news: Israeli fighter jets "flew freely" over Tehran, and Iran lost air supremacy over the entire west. Israel's goal turned to a wider range of Iranian military and infrastructure.
Iran's counterattack, Tel Aviv, Haifa and other Israeli cities are being attacked by Iranian missiles. Both sides are currently suffering heavy losses.
But the price of gold fell back at this time; I think the biggest reason is that this week, the global "super central bank week" is about to hit, the market will usher in a very critical Federal Reserve interest rate decision, and central banks such as Japan, Switzerland and the United Kingdom will also hold monetary policy meetings one after another, and investors are on high alert. Under the influence of multiple conditions, the price of gold has a technical correction.
Technical analysis:
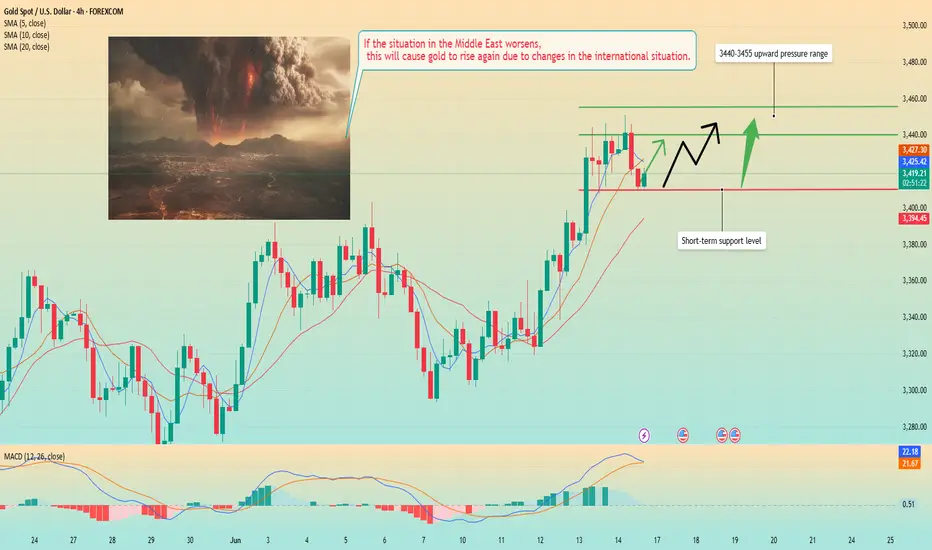
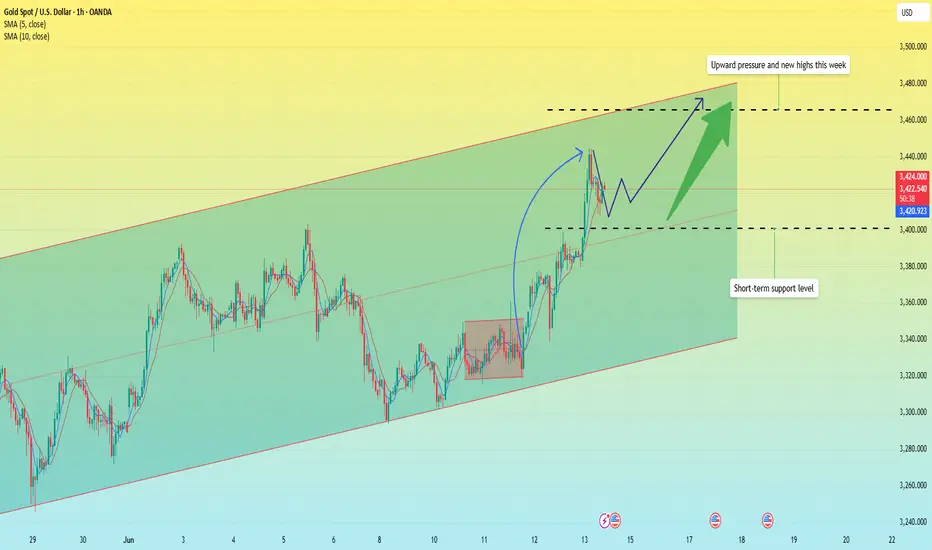
From a technical point of view, the impact of the conflict in the Middle East did not directly push up prices, but instead rushed up and fell back, which shows that the market has great pressure on the upward trend. Therefore, for the upward trend, it is necessary to be relatively conservative.
From the position point of view, the support below is around 3410.
From a trading perspective, most traders are waiting for the release of some data, which will change the overall trend of gold. However, according to the latest analysis of 14 Wall Street analysts, 10 analysts expect prices to continue to rise.
So I guess that this time the gold price pullback is accumulating energy for upward movement. At present, the price has started to rise after falling back to around 3410. The point of this pullback rebound is expected to stop around 3440, and then start to fluctuate at a high level.
If the price breaks through 3440 strongly and stabilizes above this position, the price may hit the upward pressure level of 3455 again.
Gold Regains Bullish MomentumGold Regains Bullish Momentum
Gold price started a fresh surge above the $3,375 resistance level.
Important Takeaways for Gold Price Analysis Today
- Gold price started a fresh surge and traded above $3,420 against the US Dollar.
- A key bullish trend line is forming with support at $3,415 on the hourly chart of gold at FXOpen.
Gold Price Technical Analysis
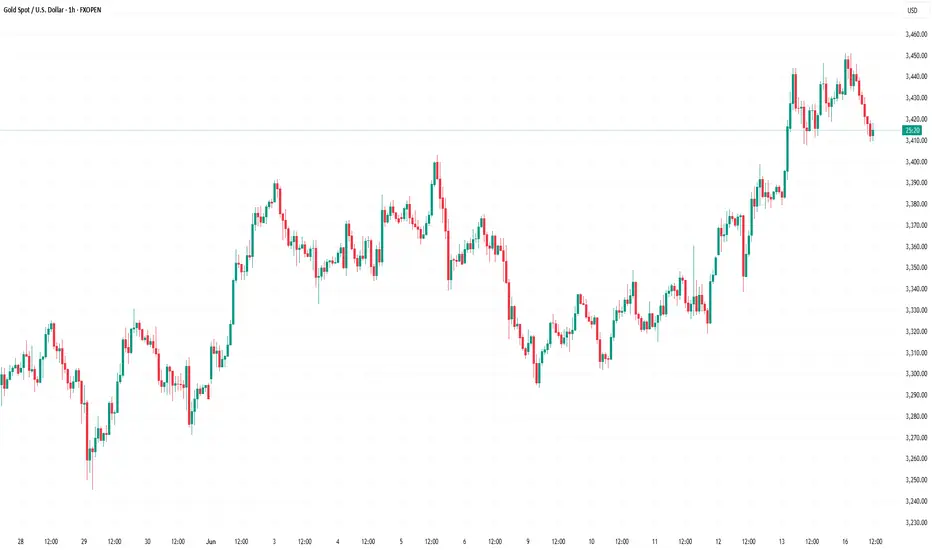
On the hourly chart of Gold at FXOpen, the price formed a base near the $3,300 zone. The price started a steady increase above the $3,350 and $3,375 resistance levels.
There was a decent move above the 50-hour simple moving average and $3,400. The bulls pushed the price above the $3,420 resistance zone. A high was formed near $3,450 and the price is now consolidating gains.
On the downside, immediate support is near the $3,415 level and the 23.6% Fib retracement level of the upward move from the $3,301 swing low to the $3,451 high.
Besides, there is a key bullish trend line forming with support at $3,415. The next major support sits at $3,375 and the 50% Fib retracement level of the upward move from the $3,301 swing low to the $3,451 high.
A downside break below the $3,375 support might send the price toward the $3,335 support. Any more losses might send the price toward the $3,300 support zone.
Immediate resistance is near the $3,450 level. The next major resistance is near the $3,460 level. An upside break above the $3,460 resistance could send Gold price toward $3,480. Any more gains may perhaps set the pace for an increase toward the $3,500 level.
This article represents the opinion of the Companies operating under the FXOpen brand only. It is not to be construed as an offer, solicitation, or recommendation with respect to products and services provided by the Companies operating under the FXOpen brand, nor is it to be considered financial advice.
XAU/USD Chart Analysis Following Israel-Iran StrikesXAU/USD Chart Analysis Following Israel-Iran Strikes
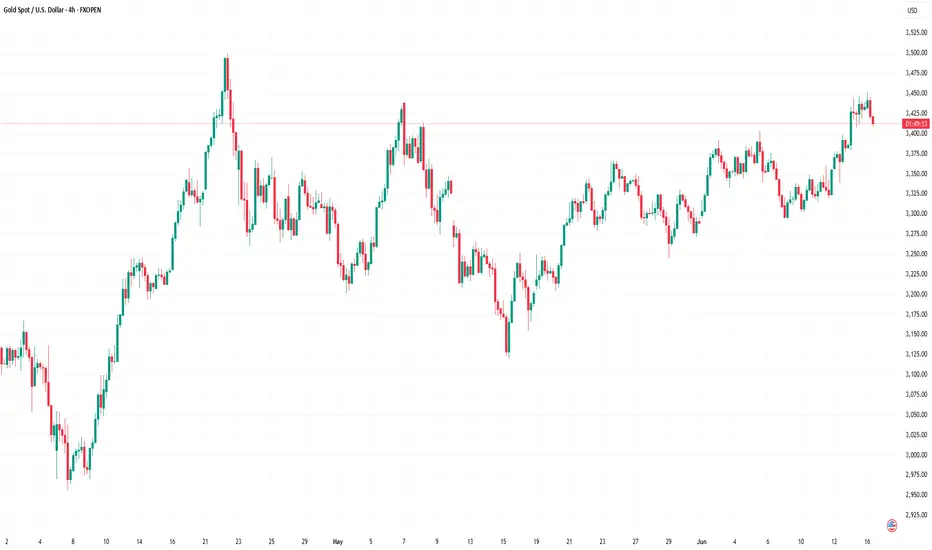
In 2025, the price of gold continues to form a long-term upward trend, highlighted by the black line. The red line previously acted as resistance, resulting in the formation of a contracting triangle on the XAU/USD chart – a typical sign of market equilibrium.
However, this red line was breached (as indicated by the arrow) amid news of the exchange of strikes between Israel and Iran. In response, gold price movements have more clearly outlined the rising blue channel, which began to take shape in the second half of May.
Over the weekend, the strikes continued, and on Monday morning, trading opened with a modest bullish gap. This indicates that geopolitical risk concerns are helping to keep gold prices anchored above the red line.
What could happen to the price of gold next?
Much will depend on how the situation in the Middle East develops. Should the exchange of strikes between Iran and Israel subside and official statements offer hope for de-escalation, a pullback from the upper boundary of the blue channel is likely.
If such a scenario plays out, technical analysts may focus on the support zone around $3,390–3,400 on the XAU/USD chart, formed by:
→ the psychological level of $3,400;
→ the red line, which previously acted as resistance;
→ the median of the blue channel.
This article represents the opinion of the Companies operating under the FXOpen brand only. It is not to be construed as an offer, solicitation, or recommendation with respect to products and services provided by the Companies operating under the FXOpen brand, nor is it to be considered financial advice.
Geopolitical conflict re-emerges, price points to 3500?Information summary:
The powder keg of the Middle East situation exploded. A new round of fierce fighting between Israel and Iran has pushed the global financial market into a risk-averse storm. In just one day, gold soared. In the early Asian session on Monday, the price of gold was unstoppable, hitting a nearly seven-week high of $3451/ounce. Under the dark clouds of geopolitical conflict, gold bulls are in full swing, and the $3500 mark seems to be within reach.
In addition, the market will face two major tests this week: the monthly rate of US retail sales and the highly anticipated Federal Reserve interest rate decision.
Technical analysis:
At the daily level, the MA10, MA7, and MA5 moving averages are diverging upward, the RSI indicator turns upward, and the gold price is running steadily in the upper and middle track area of the Bollinger band. In the four-hour cycle, the moving average forms a golden cross arrangement and the opening continues to expand. The price continues to rise along the MA10 daily moving average, and the Bollinger band also maintains an upward opening shape.
The current market is dominated by geopolitical risks in the Middle East, and the gold price is consolidating at a high level. If the situation does not change, the gold price will most likely remain above $3,400 today, and it is even very likely to refresh the historical high of $3,500 today and tomorrow. Therefore, before the trend changes, the long strategy is still the best choice.
Operation strategy;
Buy near 3420, stop loss 3410, target 3460-3470.

Is this week a chance for gold to break through 3,500?
⭐️Gold Information:
Gold prices surged for the third consecutive trading day on Friday as geopolitical tensions intensified after Israel launched a military strike on Iranian targets, including nuclear facilities and key leaders. The escalation of the situation triggered widespread risk aversion in global markets, stimulating demand for safe-haven assets. As of the time of writing, XAU/USD was trading at $3,431.
Gold surged to a five-week high of $3,446 before giving up gains as traders took profits before the weekend. Geopolitical turmoil, coupled with dovish signals released by recent US inflation data, reinforced expectations that the Federal Reserve may begin to cut interest rates later this year - despite improved consumer confidence. These factors together support the bullish momentum of gold.
⭐️Personal Comment:
Continued military tensions next week are a big driving force for gold prices to continue to break through 3,500
. 🔥 Technical aspects:
Based on the resistance and support levels of gold prices in the H4 framework, the following important key areas can be identified:
Resistance: $3488, $3502, $3562
Support: $3382, $3342
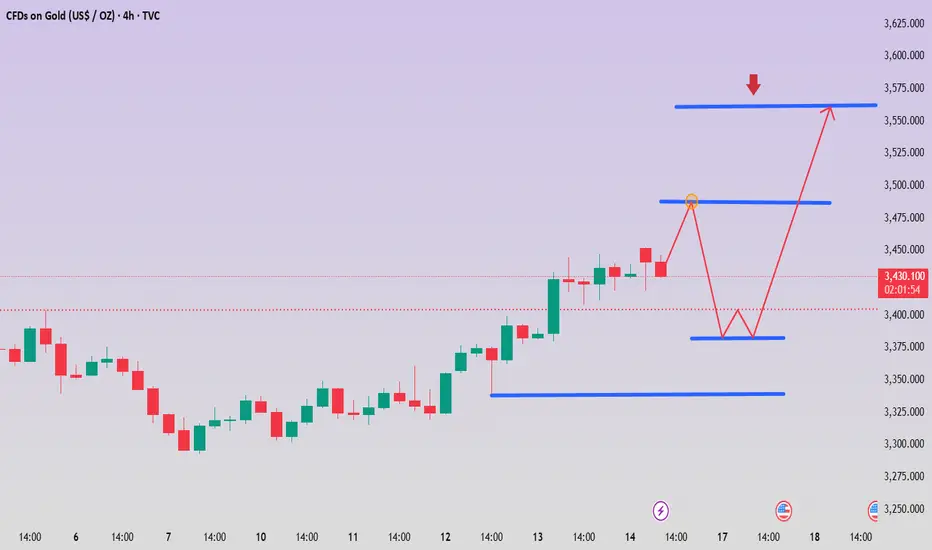
Risk aversion escalates, prices continue to rise?Information summary:
On the last trading day of last week, gold rose again under the stimulation of risk aversion. The gold market is shrouded in risk aversion in the Middle East. In the short term, the trend of gold is still supported by risk aversion and may continue to rise. At present, the relationship between Israel and Iran has not been eased; there is the latest news: Iran may retaliate against the air strikes it suffered this time. This will provide momentum for the rise of gold.
Market analysis:
Gold 1 hour shows that the moving average forms a golden cross and diverges upward, and the bullish trend of gold is still there. After the rise of gold risk aversion, gold has adjusted sideways in the short term, but it is still oscillating strongly at a high level; it is still in the process of rising. The short-term fluctuation of gold is the adjustment in the process of rising, and it will continue to rise at any time. After the gold bulls broke through 3400, they have been stabilizing above this position, so the strategy for next week is still to buy on dips.
However, it should be noted that if the international situation suddenly changes, the price may not fall back, but directly rush to a new high.
In addition, if the international situation eases and falls below 3400, we must adjust the operation strategy in time to avoid losses.
Important positions:
Resistance levels: 3450, 3475, 3490
Support levels: 3410, 3400, 3380
Operation strategy:
Buy near 3410, stop loss at 3400, win range above 3450 points.
There are still 7 hours left before the Asian market opens. I hope my analysis can help all traders gain something in the gold market.
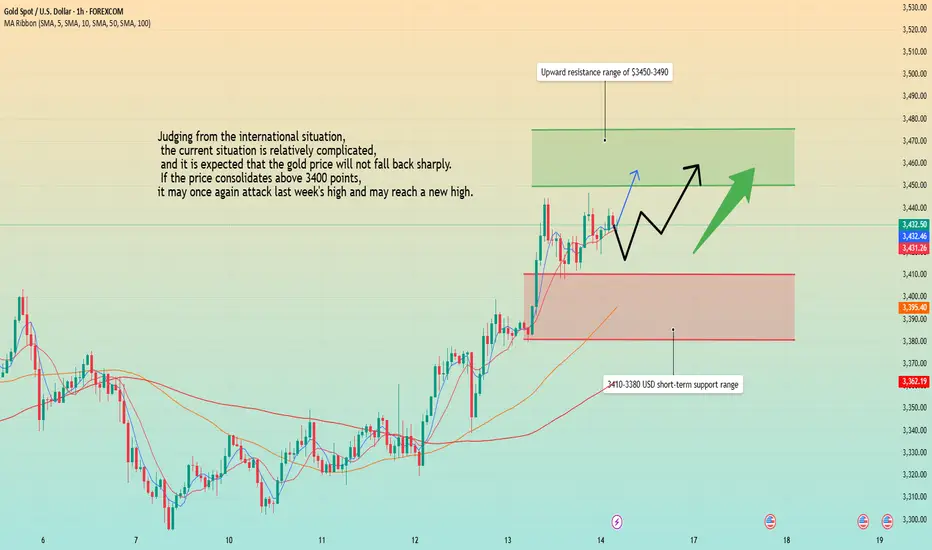
Adjustment over? Uptrend coming?Information summary:
A new round of air strikes by Israel against Iran on Friday has significantly escalated the conflict in the Middle East. Investors have quickly poured into traditional safe-haven assets such as gold, U.S. Treasuries and the Japanese yen. The market's current first choice for hedging geopolitical risks is gold, not the U.S. dollar. The U.S. dollar index rebounded slightly this week, but it has not become the main target of safe-haven fund flows, and gold has dominated the flow of safe-haven funds.
Although risk aversion has become the main theme of the gold market this week, the Fed's policy trends are still the core variable affecting the long-term direction of gold prices. In this week's FOMC meeting, the Fed kept interest rates unchanged and hinted that it may only cut interest rates once this year. But Powell also pointed out that future policies will still depend on data, leaving speculation about reversals.
Market traders generally believe that if the future inflation data falls more than expected or the job market slows down, the Fed's stance may turn dovish again, and gold prices may therefore gain new upward momentum.
Trend analysis for next week:
The weekly bullish trend extends, and there is still a lot of room for growth. After a round of decline last week, the weekly line closed this week again in a very strong position, and the daily rising trend channel resumed its operation. From the market alone, the gold price trend has been stabilizing above the middle track, and the bulls continued to line up at the opening of Monday. From the indicators, the middle track has been extending upward. Since May, the price has continued to create highs in the rising channel and has a tendency to challenge the historical high position of 3500, indicating that there is still room for upward movement in the short term.
From the 1-hour chart, the price rose to 3447 and then made a short-term correction to 3420, and the correction has been sufficient. 3420-3415 forms the most important support area. If this position is touched, it is an opportunity for long trading; but the price may not fall back to the support line and rise directly. Before breaking the important neckline, no short strategy will be adopted at the beginning of next week. We can patiently wait for the opportunity to go long after the correction.
Operation strategy:
Buy at 3415-3420, stop loss at 3410, profit range at 3450-3455.

#XAUUSD[GOLD]: Massive Boost For Buyers, Incoming More Volume! Gold has been moving as expected in our previous chart. We anticipate a smooth bull market in the coming days, with a target price region of 3400$. There are three specific targets you can aim for.
If you’d like to contribute, here are a few ways you can help us:
- Like our ideas
- Comment on our ideas
- Share our ideas
Team Setupsfx_🚀❤️
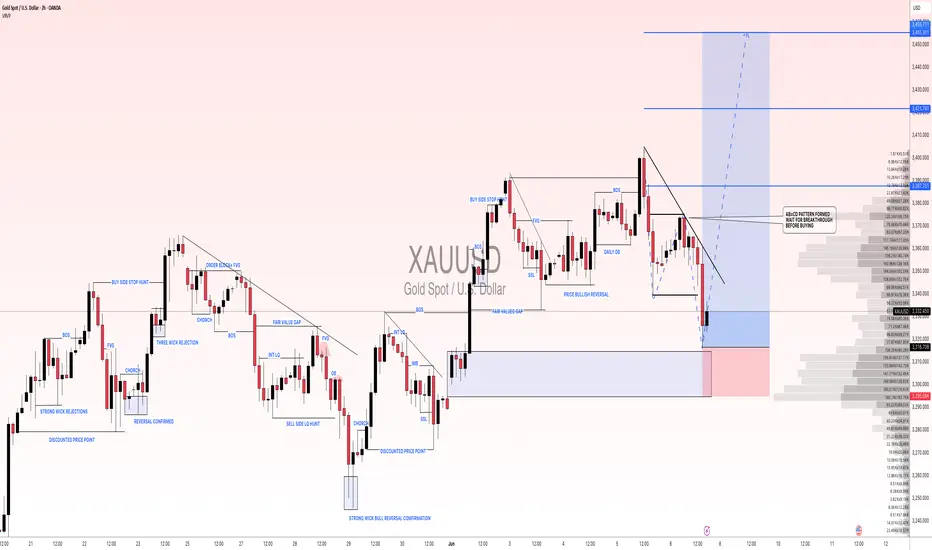
XAUUSD:06/06/2025 Update! Gold experienced a decline to 3314 following the release of unexpectedly strong NFP data. However, this decline is unlikely to lead to further price drops below 3314. This is primarily due to the ongoing turmoil within the president’s own political party, which is only just beginning to unfold and will likely intensify in the coming weeks.
Before making any trading decisions, it is advisable to conduct your own analysis. Additionally, the current price action has established an AB=CD pattern, where the price has successfully reversed from point ‘d’. This pattern suggests that waiting for the price to break out could be a prudent strategy for a safe entry.
Three targets have been reasonably set, with the potential to reach target two. However, the target three remains uncertain. The total potential profit from this idea is approximately 1300 pips.
It is also important to monitor the DXY closely. We recommend waiting for the price to complete its bullish correction before taking an entry on gold.
We sincerely hope that this analysis proves beneficial. Please consider liking, commenting, and sharing this post to encourage us to provide more such insights.
Best regards,
Team Setupsfx_
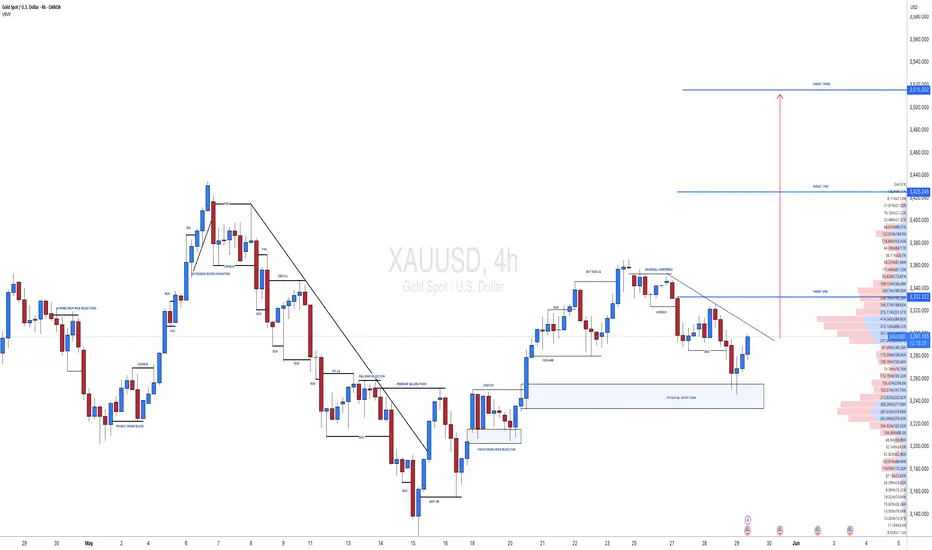
The situation escalates, and gold rises again.Information summary:
Israel issued a statement: The attack on Iran has been completed. All Israeli Air Force pilots and crew members who participated in the attack on Iran returned to the base unscathed.
Iran issued a statement: The attack could not have happened without the coordination and permission of the United States. The United States is responsible for the consequences of the Israeli air strikes.
The unpredictable international situation has caused the price of gold to continue to rise after retreating.
New forecast:
After a strong rebound in the 3338 shock area and forming a high point, it is currently in a clear upward channel. The recent breakthrough of the 3398.4 area indicates that the trend will continue and point to the resistance line near 3465. At present, the price is testing the trend line that broke above, which may become a springboard for the next round of rise.
Buy trigger point: rebound from near 3405, with strong trading volume.
Risk attention:
The possibility of triggering a false breakout trap near 3440.
If gold loses the 3380-point trend line, its momentum may stagnate.
Broader macro data could overtake technical support near resistance levels.
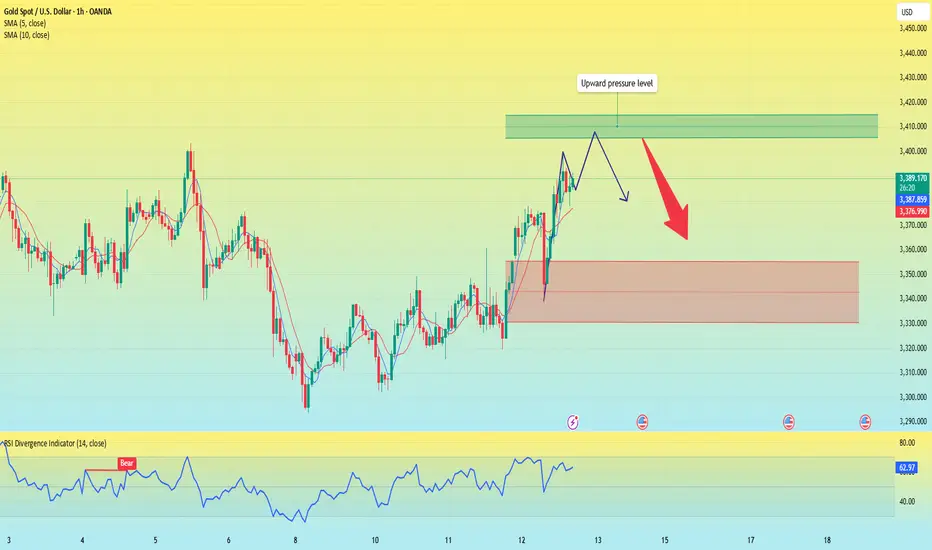
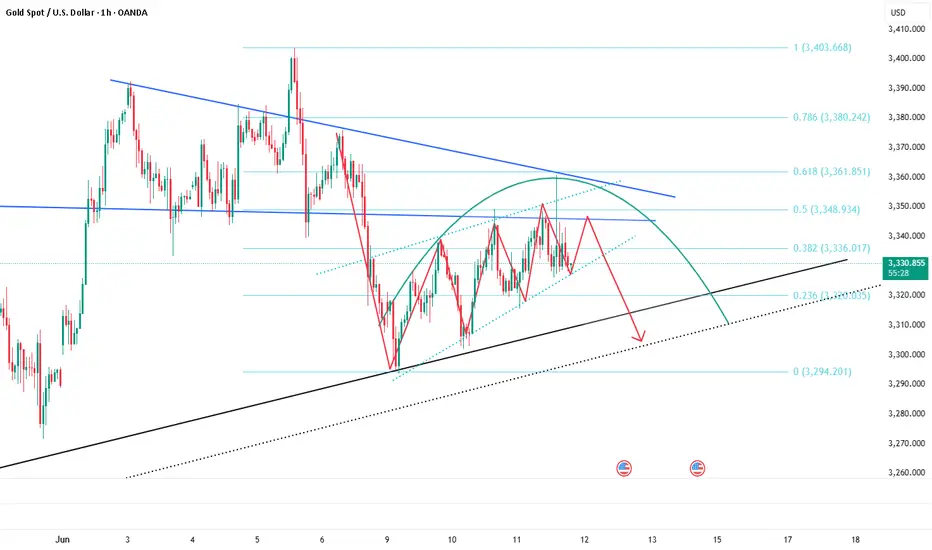
Stick to shorting gold and aim for the target area.Gold has not broken through 3400 after accelerating its rise, and the upper suppression effect still exists; currently gold is fluctuating in a narrow range below 3390, showing signs of stagflation to a certain extent. Therefore, the accelerated rise of gold is not for the short-term impact of 3400, but for a deep retracement, eliminating more scattered funds in the market by sweeping up and down.
So in the short term, I think it is difficult for gold to continue to break upward under the suppression of the resistance area near the short-term high of 3402, but to test the lower support area of 3375-3365 before breaking upward. So I have shorted gold as scheduled according to the short trading plan mentioned above, and aimed at the lower target area of 3375-3365.
At present, our short position has made a certain profit, but I still look forward to profiting from gold hitting TP! Let us look forward to gold falling back to the target area as expected!

The situation escalates. Will the price of gold continue to riseEvent summary:
On June 13, Israel launched an air operation codenamed "Lion Rising" against Iran. So far, five rounds of air strikes have been launched.
As the situation in the Middle East escalates, gold has risen again due to risk aversion, directly breaking through 3,400. Gold risk aversion has increased, and there is no sign of easing for the time being, so gold risk aversion continues to rise, and gold prices are expected to continue to rise. Under the blessing of risk aversion, gold bulls have begun to dominate again.
Market analysis:
The 1-hour moving average of gold has formed a golden cross and formed an upward trend. The upward momentum of gold is getting stronger and stronger. In the early Asian session, it once surged above $3,440, only $60 away from the historical high of 3,500. The outbreak of risk aversion is entirely the release of accumulated kinetic energy. Only when it is fully released can the strength of gold bulls weaken. The decline of gold means going long. If the price of gold falls back to the support level near 3,400 during the Asian session, buy on dips.
Focus position:
First support level: 3405, second support level: 3390, third support level: 3380
First resistance level: 3440, second resistance level: 3450, third resistance level: 3470
Operation strategy:
Long strategy: Buy near 3405, stop loss: 3395, profit range: 3430-3450;
Short strategy: Buy near 3455, stop loss: 3465, profit range: 3400-3380;
If you want to trade aggressively, you can buy at the current price and wait for the price to reach a high point near 3350.

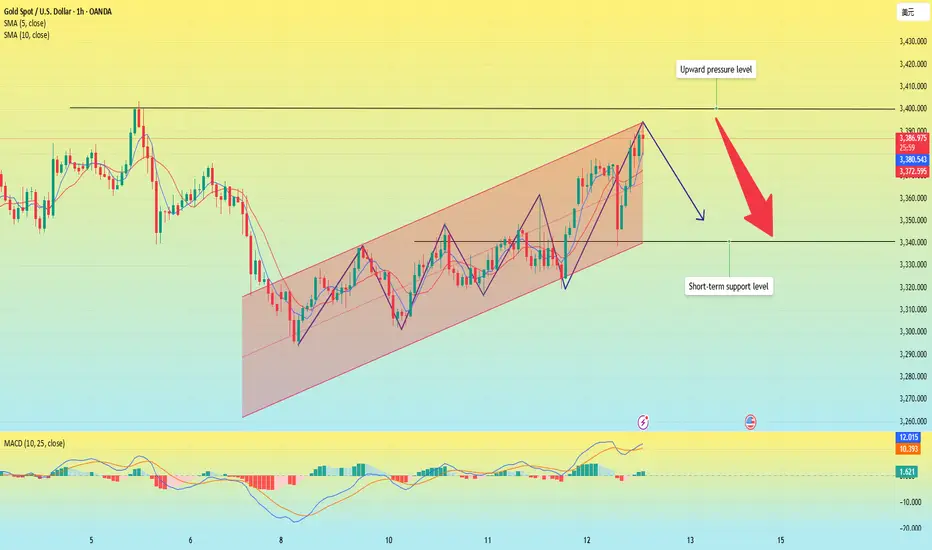
Gold is rising, will there be a new intraday high?Yesterday, gold closed with an engulfing positive line, and the closing line stood above the 5-day and 10-day moving averages.
From the analysis of gold in 1 hour, the current price is still in a fluctuating upward channel. Based on this technical pattern feature, if the subsequent economic data is positive and pushes the gold price to further strengthen, it may form a trading opportunity for shorting at a staged high. Although the gold price showed a rapid upward trend after the data was released, there has been obvious resistance in the historical trading concentration range of 3400-3410. The current bullish momentum has no technical conditions to break through this position, and the technical correction after the price surge is in line with the price behavior logic.
The current price has reached a high of around 3398. After today's rise, there is not much room for upward movement; since the market is rising in a volatile manner this week, it is not suitable to chase the rise directly. Although the 4-hour Bollinger Band opening continues to diverge upward and the moving average is arranged in a bullish pattern, the upward momentum is slightly insufficient and may be under pressure to move downward near 3410. I suggest that all traders short at high levels.
Operation strategy:
Short around 3410, stop loss at 3420, profit range 3360-3355. If it breaks through 3355, it may hit the intraday low below 3340.
Gold is rising, beware of a pullback.Since last Friday, the daily line has shown an alternating trend of yin and yang. In the three trading days this week, the lows and highs have been rising continuously, which shows that the short-term trend is strong. Today's intraday trend also illustrates this point. At present, gold has risen directly to the 3388 line, directly refreshing the intraday high again.
From the hourly chart, we must be careful of the possibility of gold diving. From the previous rules, each rise is about 45 US dollars. This time it also started from 3340-3345, and the increase was close to 45 US dollars. Moreover, each time the rise is completed, the dive callback is 35 US dollars. Therefore, once it starts to fall from 3385-3390, it is very likely to reach 3350-3355.
In terms of short-term resistance, pay attention to the 3400 pressure level above; the support level is around 3340. the support level pays attention to the vicinity of 3340.
Operation strategy:
Short at 3385, stop loss at 3395, and profit range is 3360-3350.
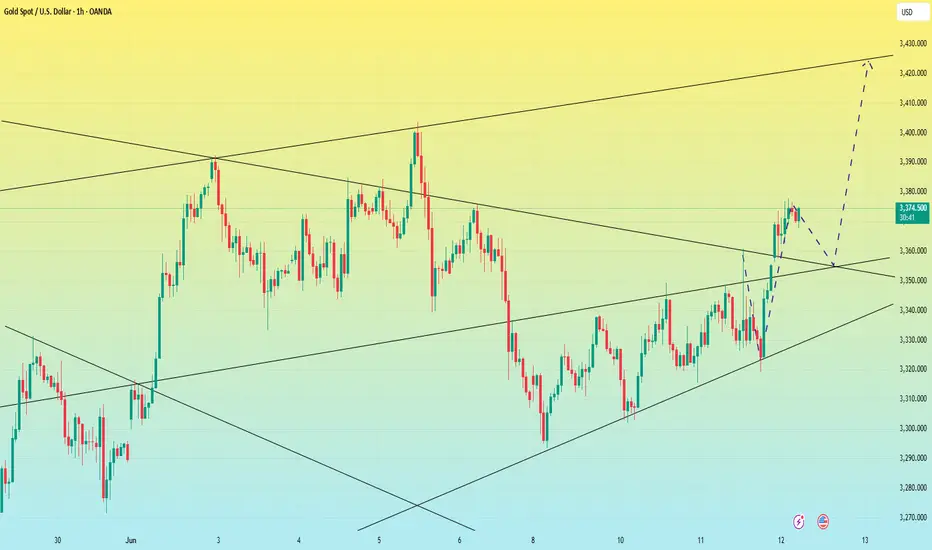
Gold surged, what will be the trend today?Information summary:
On Wednesday, the US dollar index plunged during the session as the CPI data that was lower than expected boosted the market's expectations of interest rate cuts. As of now, the lowest point is near 98.2.
After the release of the CPI data, gold rose in the short term and touched the 3360 US dollar mark, and then quickly gave up the gains and retreated to around 3320. However, it rose again due to the sharp escalation of the situation in the Middle East. As of now, the highest is around 3380.
Market analysis:
From the current 4-hour chart:
Yesterday's 3360 pressure level has been broken, and the Asian market has successfully stood above this position in the early trading. Then the suppression position of 3360 has turned into a support level. Therefore, the position we should pay close attention to next should be 3360-3350. If the price falls back to around 3350, it is possible to enter the market and do more. If the price rises again, it is very likely to break through 3400. Once it breaks through 3400, it will most likely reach around 3420.
Secondly, from the hourly chart, there are some signs of head and shoulders bottom. It would be perfect if it can fall back and then go up again. But gold cannot fall below 3345 again. If it falls below 3345 again, it cannot be long.
Operation strategy:
Go long when the price falls back to around 3350, stop loss at 3340, profit range 3375-3400.
Insist on shorting gold on ralliesToday we made a total profit of 350 pips in 2 short trades. First, we shorted gold near 3345, and when gold fell to around 3330, we manually closed the order to lock in profits; the second time, gold rebounded sharply with the help of CPI data, and we seized the opportunity to short gold again near 3360, and ended the transaction by hitting TP: 3340. We accurately grasped the profit of gold shorting.
At present, gold is in a narrow range of fluctuations near the 3330 mark. Relatively speaking, gold is still in a weak position. Although gold has rebounded sharply with the help of the positive CPI data, it has shown a long upper shadow in the candle chart due to the rapid retracement, which has strengthened the resistance above and limited the rebound space of gold in the short term. In addition, the morphological structure shows signs of building a head and shoulders top structure. The resistance area in the short term is 3345-3355; followed by 3360-3370. Although gold is currently in a narrow range of fluctuations near the 3330 mark, it does not show obvious signs of support. It is easy to fall below the area near 3330 in a weak situation. The relatively strong support is in the 3320-3310 area, followed by the area near 3300-3290.
So for short-term trading, I still advocate taking the 3345-3355 area as resistance first and continue to short gold!
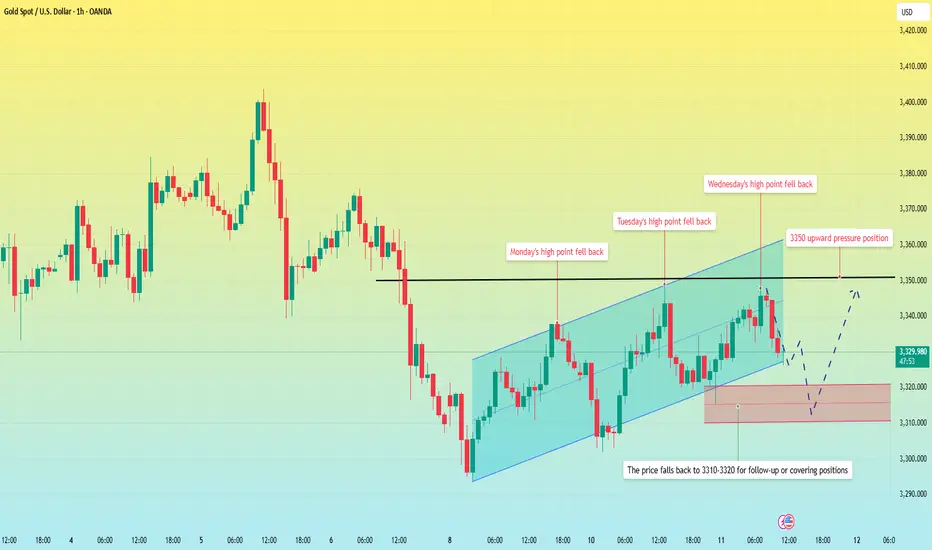
Continue to short gold Gold rebounded from around 3315 and has now reached above 3340. According to the current structure, gold tends to rebound upward. But the characteristics of the recent market trends are also very obvious. Gold has risen with difficulty, but has retreated very quickly! Overall, there was no continuation in the process of long and short games, which was disorderly fluctuation.
According to the current structure, as long as gold cannot break through the 3350-3355 area and the bulls have not completely gained the upper hand, gold still has the potential to go down and test the 3320-3310 area again. Therefore, for short-term trading, we should not chase gold too much, and we can still try to short gold with the 3345-3355 area as resistance.
Gold fluctuates, awaiting CPI data.In Asian trading on Wednesday, traders are awaiting the release of the latest U.S. Consumer Price Index (CPI) data for May. Estimates suggest that prices are likely to rise as American households feel the impact of tariffs imposed by the Trump administration. But the easing between the world's two largest economies should have an adverse impact on safe-haven assets such as gold, and the lack of a downward trend in gold prices suggests that investors are waiting for more developments.
In terms of short-term trends, the gold 1-hour chart shows that gold prices remain in an upward channel with a low point. So from the trend, the current momentum for gold to rise will be stronger. The price pullback is giving opportunities to go long.
The change of thinking is actually following the trend. For the current operation, enter the market with the trend, and cover the position when it falls back or break through the profit position to cover the position. In a strong market, during the correction phase, the price is rising, and the amplitude of the correction is often small. The bulls retreated at the opening to accumulate momentum. Above is the pressure level of 3350-3360. Once it breaks through and stabilizes, it will accelerate the upward trend. Just follow the general trend of the market.
Operation strategy:
Go long when the price falls back to 3310-3320, stop loss at 3300, and profit range is 3345-3360.
How is the market situation during the China-US talks?Information summary:
On Tuesday, as the China-US trade negotiations entered the second day, the US dollar index fluctuated around the 99 mark.
The gold price once approached the 3,300 US dollar mark in the Asian market, and then continued to rise, reaching the highest of the 3,350 US dollar mark. After the opening of the US stock market, all the gains during the day were given up, and it has been maintained below 3,350 for consolidation.
From the current known negotiation information, the two sides basically agree on the general direction and principles, but it means that more specific content and details have not yet been fully negotiated, and more dialogue is needed to resolve.
Market analysis:
From the current gold market, as long as the 3,350 mark cannot be strongly broken through next, the price will fall again. The consolidation range will remain at 3,300-3,350. As long as the price fails to break through strongly, there will still be a fifth wave of downward trend.
Therefore, gold is still maintaining short selling operations at high points.
Operation strategy:
Short at 3345-3450, stop loss at 3360, the first target is this week's low of 3300, the second target is 3285, and the third target is 3250.
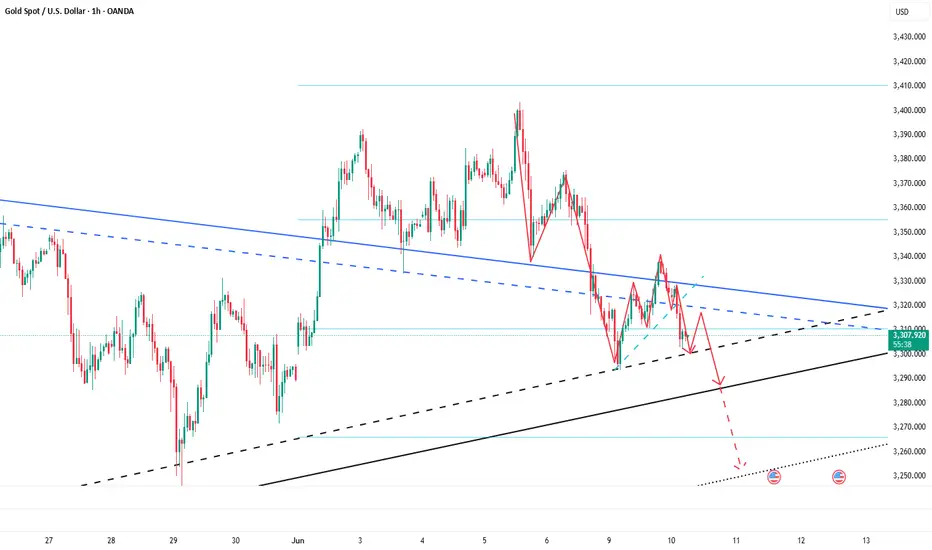
GOLD M30 Intraday Chart Update For 10 June 2025Hello Traders
Market tested 3302 level this morning and move back towards 3340 SBR structure zone
all eyes on 3340 level clear breakout once market breaks 3340 level it will move towards 3350 Psychological Level or even 3365
Key Support for the day 3300 Psychological Level
Disclaimer: Forex is Risky

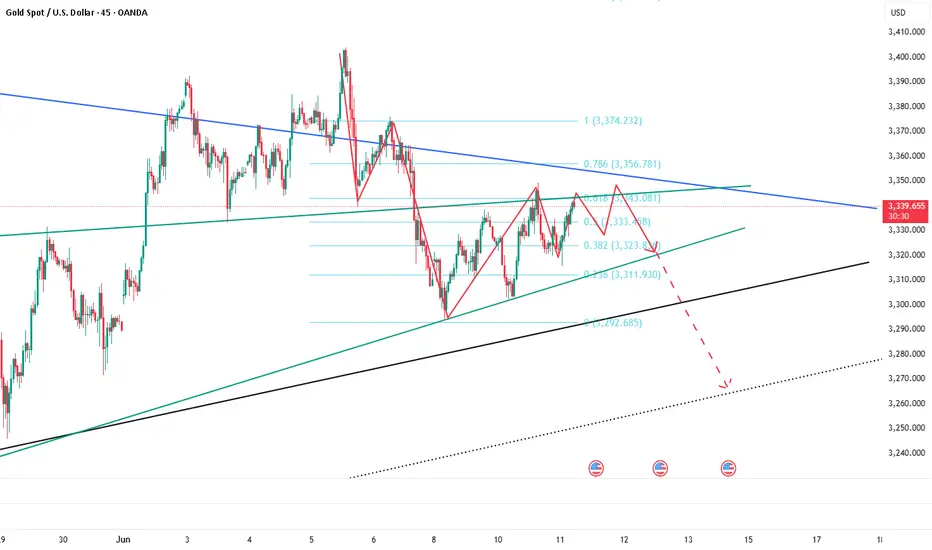
Gold is expected to continue to fall to 3280 or even 3250In the short term, the operation of gold is completely in line with my expectations. I clearly pointed out yesterday that gold will encounter resistance in the 3330-3340 area and will at least retest the area around 3315-3305 again. At present, gold has rebounded slightly after retesting the area around 3302 and is trading around 3309.
According to the strength of yesterday's rebound, gold did not effectively break through the 3300-3340 area. Gold is still weak in the short term, and the head and shoulders top structure is constructed in the 3328-3338-3328 position area in the short term, which suppresses gold to a certain extent and limits the rebound space of gold. After multiple tests, the area around 3300 may be more conducive to being broken. After gold has been under pressure and fallen many times, the current short-term resistance area has been reduced to the 3310-3320 area; so I think gold still has a good downward space in the short term, which may continue to 3280, or even around 3250.
So for short-term trading, I think it is possible to consider continuing to short gold.
Gold is falling. Where is the low point?Market summary:
Yesterday, thanks to the weakness of the US dollar, the US dollar once fell below the 99.0 mark. Spot gold rebounded from the low of 3293 hit earlier in the session, recovering all the losses during the day, and the highest point was near 3338.
It fell from the high point in the early Asian session on Tuesday, and has been consolidating in the 3300-3310 range so far. In my early analysis, I pointed out that there is a high probability that the fifth wave of the wave trend will fall at the beginning of this week, and as I predicted, it is completing the fifth wave of the downward trend.
Trend analysis:
From the four-hour chart, the fourth wave of rebound has been completed, so today is the fifth wave of the downward trend. Next, we look at the two target ranges.
The first target is around 3280, and the second is 3260-3350. And today, it is highly unlikely to stabilize above 3310, so don't choose to short at the rebound high point, the chance is very slim.
Operation strategy:
Short around 3310, stop loss at 3320, profit range 3380-3350.
