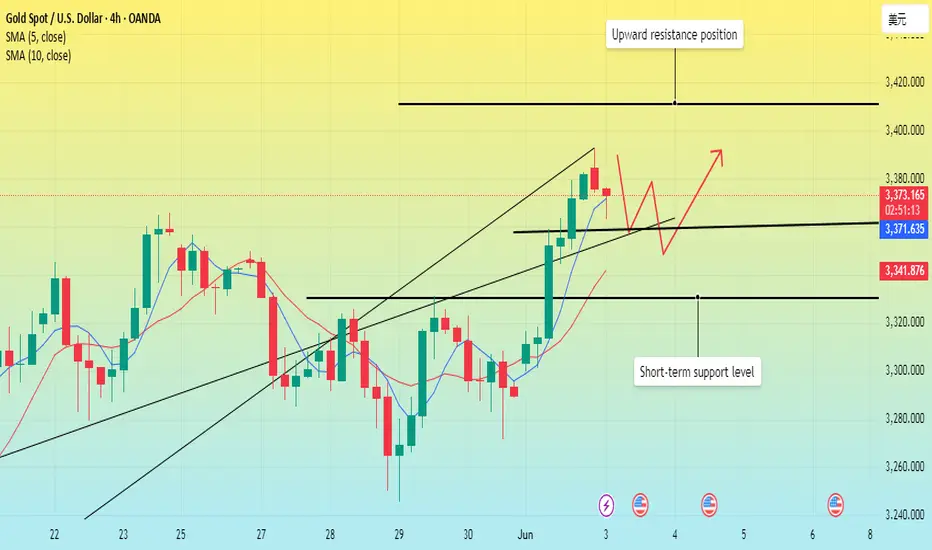
Gold price rebounds, short-term strength?After the opening of the U.S. stock market today, the price of gold rose rapidly, breaking through the first resistance level of 3325, and currently reaching the intraday high of 3337.
However, from the hourly chart, the current price has not reached the upward trend point I predicted, so the price is likely to rise slightly again in the future.
From the 4-hour chart, gold rose again after falling back in the U.S. market, and the price broke through the 3325 position upward, which means that the short-term is strong; in the morning analysis, I predicted that gold would fall back and rush high, and the fall back can be short-term long, and the volatile market can be operated in the short term according to this strategy.
At present, the 4-hour MA5-day and 10-day moving averages have a trend of forming a golden cross upward, and after the fall in the morning, the moving averages are currently showing an upward turning trend.
Therefore, after the price breaks through 3325, the probability of continuing upward is still relatively large, and the pressure position is 3345; this position is the point after the fall back from the high point in May, and it is also an important pressure position after the current price falls back and rebounds.
The price is currently heading towards a retest of 3340-3345 levels. If the dollar continues to fall and gold manages to consolidate above 3345, the bullish trend is likely to continue. However, a false breakout of 3340-3345 area could trigger a further decline following the breakdown of the bullish structure.
Xauusdtrade
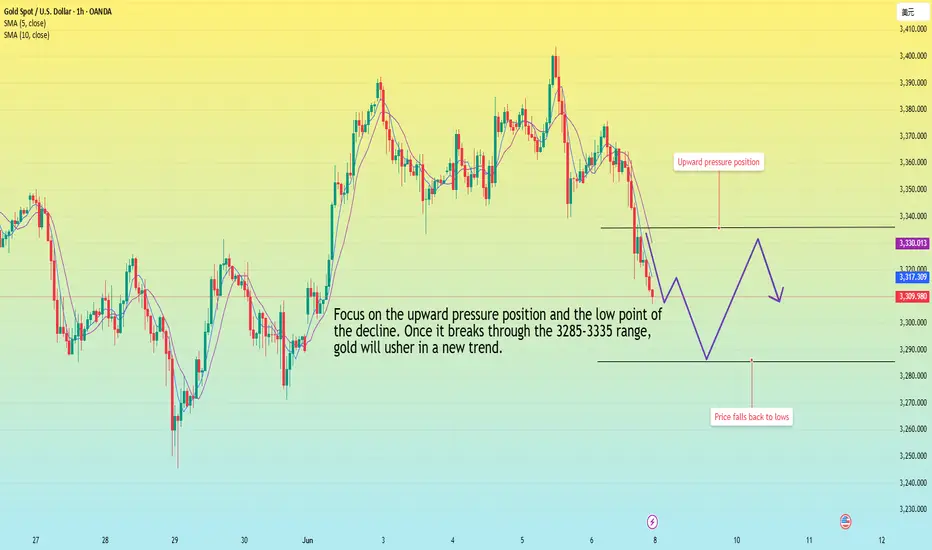
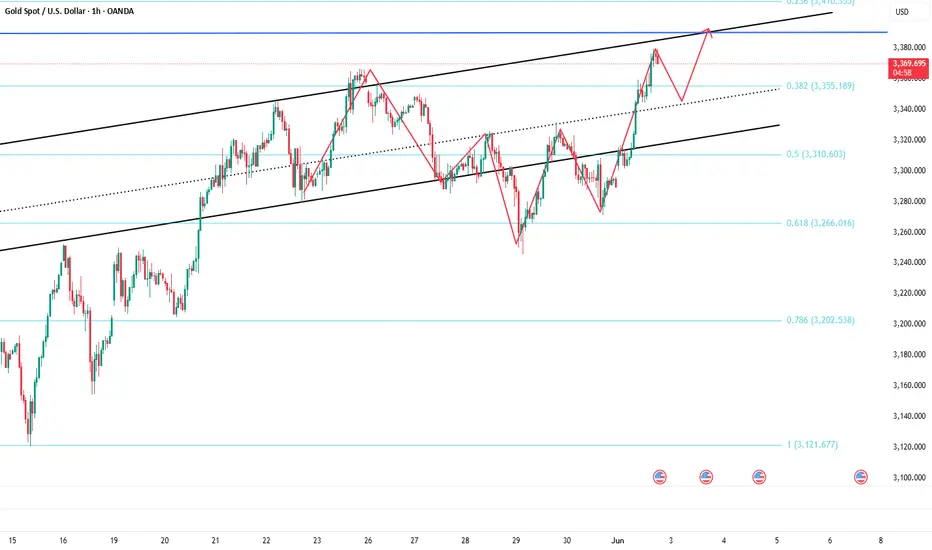
Gold is falling, waiting for the trend to be completed?The Asian market continued to fall on Friday in the early trading on Monday, reaching a low of around 3293. It then bottomed out and rebounded, reaching a high of around 3325, and is currently maintaining a consolidation around 3320.
From the hourly chart, gold is completing the fifth wave in the wave trend; in the short term, gold is in a rebound trend, and has been maintaining this upward trend channel.
As long as it cannot fall below 3310 next, the gold rebound has not ended, and it may directly test the top around 3345. Because 3345 is exactly the bottom of the first wave, the rebound trend from 3293 is likely to be the fourth wave.
As long as the fourth wave rebound cannot strongly break through the bottom of the first wave at 3345, then the fifth wave will most likely show a downward trend.
Therefore, the current trading operation is basically simple;
Long strategy: long at 3315-3320, stop loss at 3305, and profit range at 3340-3350.
Short selling strategy: wait for the price to stabilize near 3345 and then enter the market to short sell.
Important tip: If the price falls from 3345, it is highly likely to go down directly to the low point of 3280-3250.

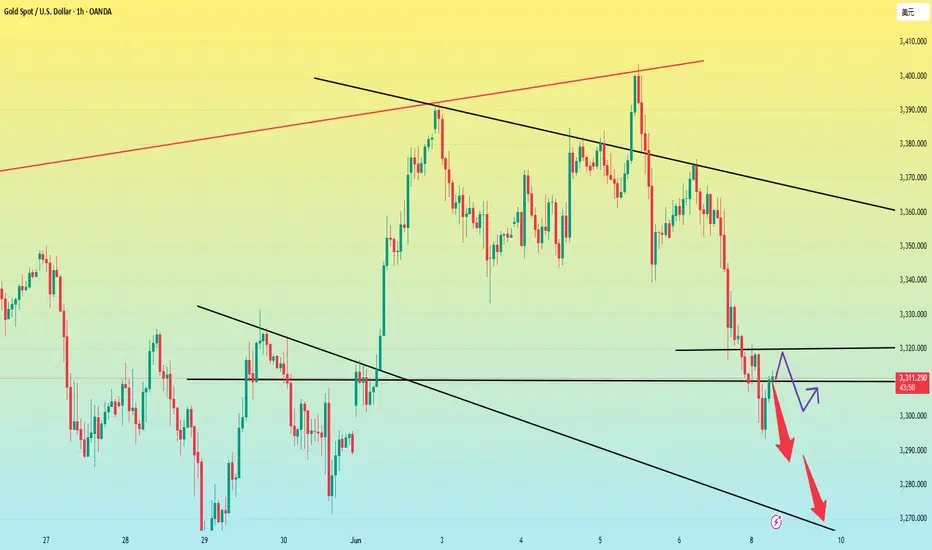
The decline is not complete, beware of the low point.Last Friday, the US dollar index rose and recovered the 99 mark as the non-farm data exceeded expectations and weakened the Fed's hope of cutting interest rates this year. Spot gold continued to fall after the release of non-farm data, breaking through the 3345 and 3330 levels.
Market analysis:
First look at the 4-hour chart of gold:
It broke through the 3300 mark in the early Asian session on Monday and is currently maintained near 3310. However, from the current point of view, the decline of gold has not been completed. From the trend point of view, gold must at least test the position near 3280 and 3250 before there will be a relative chance of rebound. Once it falls below 3250, gold may not have a chance to rebound, and it will officially enter a bearish trend, and it will be greeted by a bearish trend at the daily level.
From the hourly chart, if it cannot stabilize above 3310, then gold is likely to fall, and see whether it will break through 3280 or 3250. On the contrary, if it stabilizes above 3310, it may hit the early high near 3320 again. However, as long as it cannot stabilize above 3325, gold will still fall. Now you should pay attention to where to short gold.
Operation strategy:
If the price cannot stabilize above 3310, you can short near 3310.
If it stabilizes above 3310, you can wait for short near 3320.
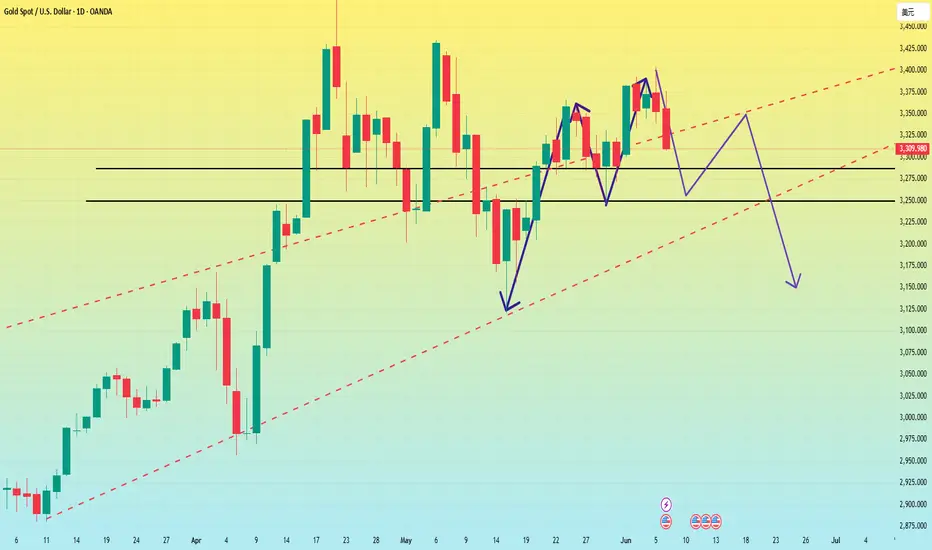
In the new week, is gold brewing a new market?Information summary:
This week, the market continued to be affected by Trump's tariff policy and the progress of negotiations. On Thursday, the phone call between the Chinese and US heads of state boosted market sentiment. In the early stage, the precious metals market ushered in a collective rise, and the prices of silver and gold performed strongly. Silver rose to a 13-year high on Thursday, breaking through $36 for the first time since February 2012.
After gold hit the $3,400 mark during trading on Thursday, the US dollar rose as friendly talks between China and the United States stimulated the rise of the US dollar; gold fell rapidly and gave up all the gains during the day. On Friday, the US stock market closed at its highest level since February due to the boost of non-agricultural data.
Gold continued its retreat trend again, closing at around 3,310 as of Friday.
Market analysis:
From the trend of the US dollar, there is already an opportunity to bottom out, and the trend at the beginning of the week is critical.
Once the US dollar stands above 99.5 at the beginning of the week, it will continue to touch the 100.0--100.2 mark.
If it stabilizes above this position, gold will most likely fall below 3300 next week.
First, from the weekly chart:
The current moving average support below the weekly line is almost at 3250-3260. If it can hold here, gold may continue to maintain consolidation and wait for an opportunity to choose a new trend. However, if it falls below 3250, it can fall to the 3200 mark. If 3200 falls below again, it will be the low point of 3100.
It can also be seen from the daily chart that the important position of gold is at 3318-3280. If it stands above 3318, gold is in a bullish upward trend. If it falls below 3280, gold will enter a bearish trend. At present, gold has closed below 3318, so from the daily line, the next target is around 3280. If 3280 falls below again, then as the weekly analysis shows, it will test 3250-3260. However, judging from the daily chart, I think the market will not go down too easily.
Therefore, I guess that gold may follow the head and shoulders top structure of the daily chart next week. It may fall to 3250-3260 at the beginning of the week to lure short sellers into the market, and then stretch and rebound to around 3350 to form a shoulder position. Finally, it will directly dive down to around 3150.
The Asian market is about to open, and I hope my analysis can help everyone make some profits in the market. A new week is about to begin, and I wish you all good luck.
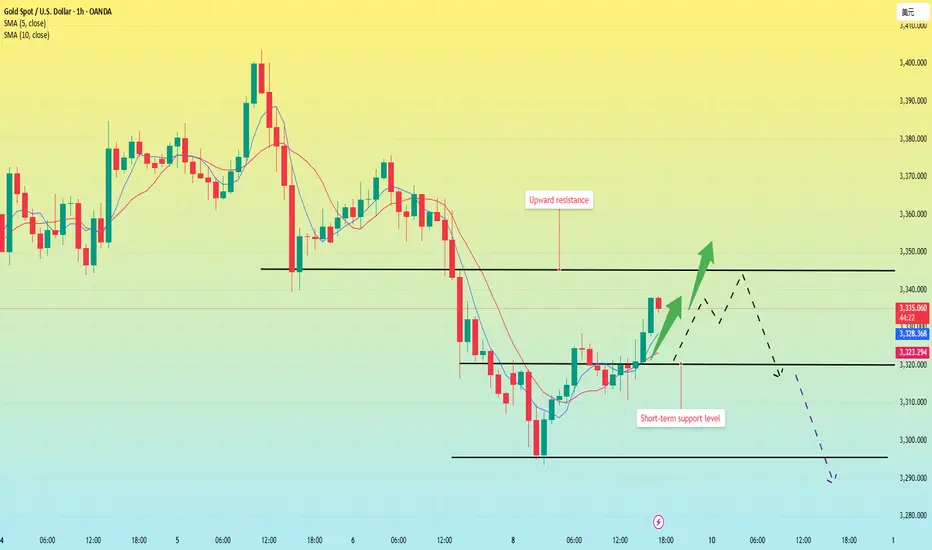
Gold plunges, what will be the trend next week?From the daily chart:
Since the last round of breaking the triangle convergence oscillation and breaking the trend line, gold has surged to 3400, but the upward momentum is insufficient and it has retreated. The low point of the retreat on Friday happened to be the support level of the previous triangle convergence trend line near 3300. If it falls below, the price will return to the triangle convergence oscillation range, and the gold price may fall further;
From the perspective of gold 1 hour, the MA5-day and 10-day moving averages have formed a dead cross downward, so gold still has downward momentum. After the gold 1-hour high box oscillation, gold finally broke through the box downward, indicating that the gold shorts are better, so the bottom of the gold box has now formed resistance, and the gold short-term resistance to gold has been formed near 3335. If gold is 3335 at the beginning of next week, then gold can continue to be short.
Next week's operation strategy is still around the 3285-3335 range.
Before the non-agricultural data, gold is waiting for the trendToday, the market will focus on the US non-agricultural employment data. The market expects that 130,000 new jobs will be added and the unemployment rate will remain unchanged at 4.2%. If the non-agricultural data is far worse than expected, it may continue to hit the US dollar and stimulate a sharp rise in gold prices. On the contrary, if it is higher than expected, it may also cause the US dollar to rebound, and gold will continue to maintain the possibility of low consolidation.
Yesterday, the US stock market collapsed across the board due to the debate between Trump and Musk. Therefore, I am worried that Trump will continue to make remarks to boost the US stock market today. Once the US stock market rebounds again, gold may continue to fall, or remain at a low level for consolidation.
From the 4-hour chart, it can be seen that gold has been rising along the 4-hour trend line. However, from the current chart, gold has not yet stepped back. Therefore, it is not ruled out that gold will continue to step back to 3330-3340 and then choose a direction again. 3330-3340 is a critical position. Once it falls below 3330 again, it is very likely to directly touch 3300. On the contrary, if it stabilizes at 3330-3340 again, then gold will definitely stabilize above 3400 if it goes up again.
Secondly, from the perspective of the US dollar:
The bottom divergence structure appears here in the 4-hour chart. Therefore, once the divergence of the US dollar takes shape, it will also cause gold to return to a low level again.
Therefore, be careful when going long on gold today. The position where you can go long today is in the range of 3330-3340. Secondly, if gold falls below 3330 today, it will test around 3300, so another long position for gold is around 3300. On the contrary, if it falls below 3300, there will be no chance to go long on gold, and the subsequent decline may accelerate.

Non-agricultural data is coming. Disrupt the market?Market analysis:
The market once again staged a long-short trend yesterday. Due to the intensification of geopolitical risks, gold has been advancing all the way. Because of the easing of Sino-US trade relations, prices have fallen sharply. From the current market point of view, non-agricultural data is the key today. After a sharp drop in the early morning, it fluctuated sideways and maintained a small rebound.
According to the ADP data on Wednesday, there is a high probability that the data will be bullish today. The support in the early trading will focus on around 3345. Under the condition that the upward trend remains unchanged, the current market prompts a risk of retracement, but it will not prompt shorts to enter the market; before the non-agricultural data, it is still a low-multiple idea.
Non-agricultural data analysis:
Non-agricultural, recently affected by tariff conflicts, employment is very bad, especially Wednesday's ADP data, which is far below expectations, and this month's non-agricultural is expected to be 130,000. Although the expectation is lower than 177,000 last month, this number is still relatively high compared to ADP.
If the data released is higher than 177,000, it will be bearish for gold, but in terms of tariffs and ADP, this possibility is extremely small. The data is higher than 130,000 and lower than 177,000, which is also likely to be bearish for gold.
If it is lower than 130,000, gold may take this opportunity to rise sharply.
I think according to Wednesday's ADP, today's non-agricultural data is likely to be lower than 130,000, and the market will rise.
Positions to pay attention to today:
First support level: 3345, second support level: 3330, third support level: 3300
First resistance level: 3375, second resistance level: 3390, third resistance level: 3410
Operation strategy:
Aggressive trading-currently long at 3370, after the release of non-agricultural data, the gold price is likely to rise above 3400 points, which is also our profit range.
Steady trading-long at around 3350, the profit range is still at 3400 points after the release of non-agricultural data.
US-China Talk Drops Gold Short; Short StrategyToday, Trump announced that China and the U.S. participated in a telephone exchange 🔊! After the market learned this, optimistic sentiment surged rapidly, causing U.S. stock futures to rise sharply in the short term 📈. As a result, spot gold turned lower in the short term ↓. The current situation favors short positions:
Short at current price 📉: Initiate a small short position near 3350 👌, set a unified stop loss above 3360 ⚠️, and target key support levels at 3325-3320 🎯.
Add to shorts on rebound ↕️: If the price rebounds to the 3350-3360 range, increase the short position 📊, maintaining the same target 🎯.
Chase shorts on breakdown 💥: If the price breaks below 3320 support, chase the short trend with a stop loss at 3330 ⚠️, targeting the psychological level of 3300 🧠.
Risk reminder ⚠️: Monitor U.S. stock futures and follow-up developments in U.S.-China relations closely 👀, and be wary of volatility caused by a reversal in market sentiment 🚦. Keep position sizes within 10% ⚖️ and strictly adhere to stop losses ⛔.
Gold Trading Strategies
sell@3350-3355
tp:3325-3320
sell@3315-3320
tp:3305-3300
Professional trading strategies are pushed daily 📊
Lock in precise signals amid market fluctuations 🚀
Confused about market trends? Stuck in strategy bottlenecks?
Real-time strategies serve as your "trading compass" 🌐
From trend analysis to entry/exit points, dissect market logic comprehensively
Refer now 📲
Help you move steadily forward in investments ✨
👇👇👇
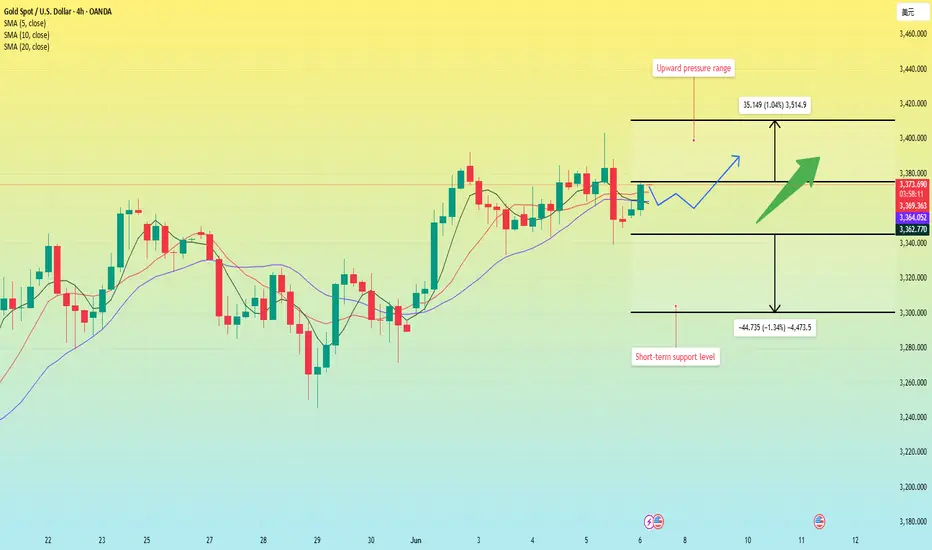
Gold points to 3400, madness before data release.Market analysis:
Gold fell slightly to around 3361 in early trading on Wednesday. After falling to around 3346, it quickly rose to around 3372, then was blocked and fluctuated and fell. It fell to 3344 in the European session and then rebounded. It rose strongly to 3384 in the US session and fluctuated above 3370 in the late trading.
The daily line of gold showed a trend of alternating yin and yang. But the overall trend was upward. The 5-day moving average and the 10-day moving average formed a golden cross and extended upward, which provided moving average support for the gold price, allowing gold to maintain a strong and volatile trend. At present, the 5-day moving average is around 3352, and the 10-day moving average is around 3335. The first thing to pay attention to is the resistance of Tuesday's high of 3392. If the gold price can break through this resistance level, it is expected to continue the bullish trend.
In terms of points, first pay attention to the support near MA5/MAA10 below, and focus on the support of MA20 moving average. The downward exploration on Tuesday and Wednesday both defended the MA20 moving average position. Above this, it is treated as a strong shock. Secondly, pay attention to the support near 3335, which is the low point on Tuesday and the key to the short-term structure. Secondly, pay attention to the support near 3335, which is the low point on Tuesday and the key to the short-term structure. First pay attention to the resistance near 3395 above, and then pay attention to the resistance near 3415 and 3430, which are the previous high points.
Operation strategy:
Short near 3395, stop loss 3410, profit range 3380-3360
Long near 3360, stop loss 3350, profit range 3375-3380-3390-3400.

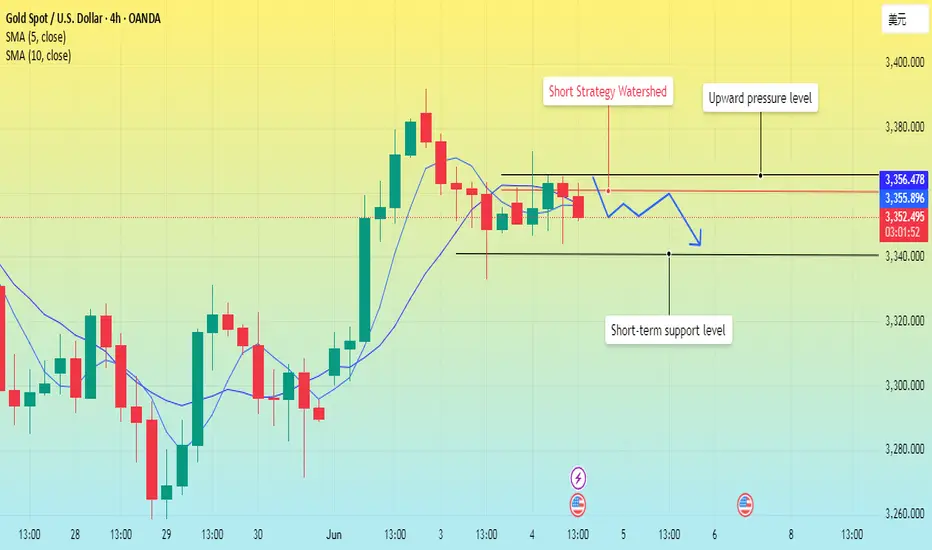
Gold fluctuates. It is expected to retreat.Gold continued its strong performance on Monday in the early trading yesterday and reached a high of around 3391 before starting to fall all the way. It was weak and downward in the European trading. The US trading quickly fell back to around 3335 and then rose again. However, it touched the 3372 line again in the morning and continued to fall, forming a large range of fluctuations.
Affected by the ADP data, although the positive impact is large, it is very likely to be just an illusion given to the market, not to achieve a strong effect. The key pressure position above is maintained at around 3360, which may play the role of a watershed between long and short positions, and the strong pressure above will also be maintained at 3365; the support position below is around 3340. Once this position is broken, the room for decline may be expanded in the later period.
Although the MA5-day and 10-day moving averages have the intention of forming a golden cross, they have not completely released the energy of the bulls, making the market more unpredictable for the bears. In the correction of the bulls' strong upward movement, there was no further effort. Perhaps this is one of the signs of bull exhaustion. The current channel position formed from 3391 also gives the bulls enough pressure. Only by breaking through this position again can a strong upward trend be achieved.
Operation strategy:
Short near 3360, stop loss 3370, profit range 3345-3330.
GOLD H1 Chart Update For 4 June 25Good Morning Traders,
As you can see that market is in swing range since starting the week but right now main strong 3400 resistance remains intact, Once market clearly breaks 3400 then it will move towards 3420 or even 3440
Intraday swing trading range is 3440-3480
If market break 3325 level successfully then it will move towards 3310 or even 3290
Scalping range 3345-55 for buy side
Good Luck
Disclaimer: Forex is Risky

Gold-Asian market rises, what is the trend?Event summary:
On Wednesday in the Asian market, spot gold fluctuated slightly and is currently trading around $3,370/ounce.
There are two reasons for the strong rise in the Asian market: 1. Ukraine directly blew up 41 Russian fighter jets; 2. The tariff storm re-emerged, and Trump is expected to impose a 50% tariff on steel and aluminum. The tense international situation and tariff storm have become important factors that disrupt the market.
Market analysis:
The four-hour chart shows that the current price is still running above the middle track of the Bollinger Band channel, and the MA10-day moving average and the 5-day moving average are running above 3,340. Due to the wide fluctuations in the market, short-term participation is the main option. Intraday callbacks are still mainly low and long.
Gold rebounded directly in the early trading, and the center of gravity of the low point of the rebound is also constantly moving up. From the current market, the short-term gold price has stabilized above the top and bottom conversion position of 3,340, and it also remains above the rising trend line, and the bulls are strong.
In the early trading, the gold price fell back to the lowest level of 3346, and it formed a Yang-enclosing-Yin pattern, which means that the bulls' energy is relatively strong. We only need to pay attention to two points in the early trading, namely the key level of 3330 and the short-term support level of 3346. If it falls back to around 3350 during the trading session, we will start to go long.
Operation strategy:
Short at 3375, stop loss at 3385, target 3340-3320;
Long at 3345, stop loss at 3333, target 3370-3400;
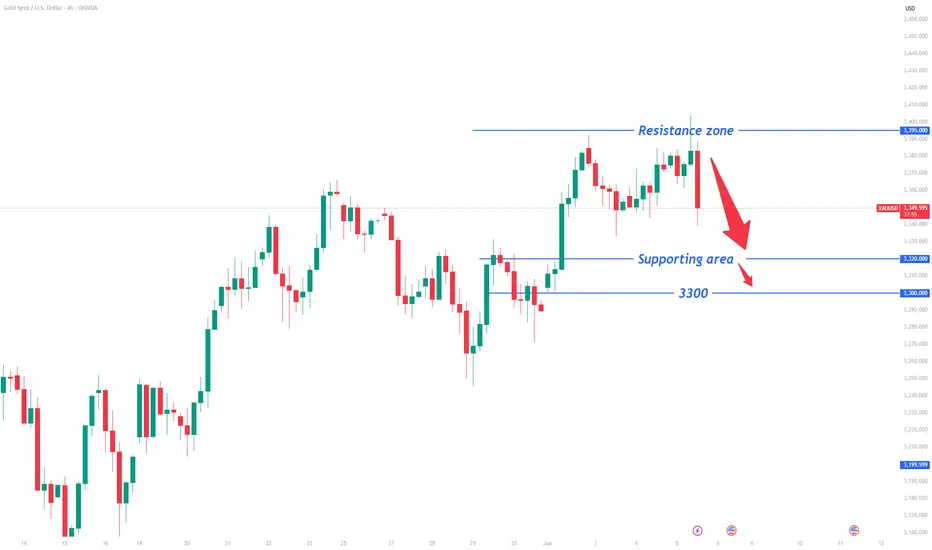
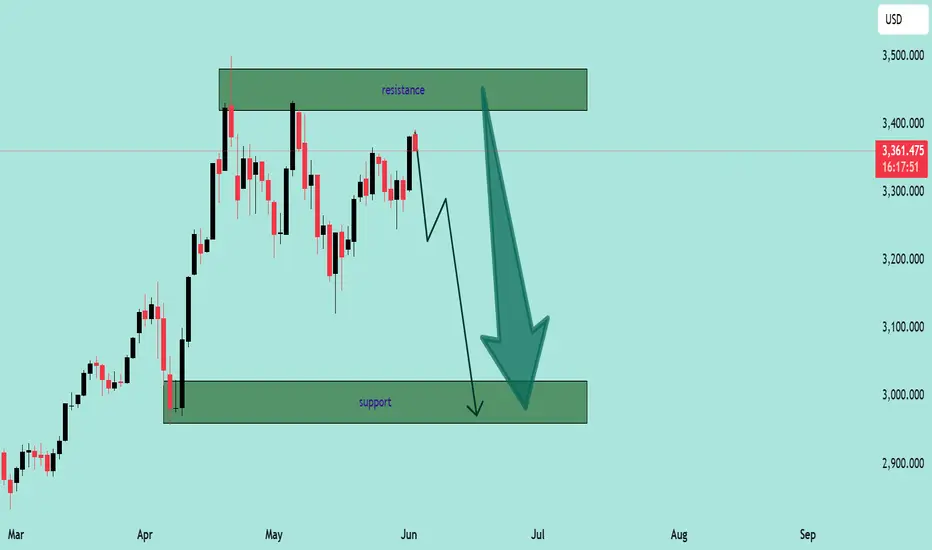
XAU/USD Bearish Rejection at Resistance – Potential Drop Ahead!XAU/USD Bearish Rejection at Resistance – Potential Drop Ahead! 💥
🔍 Technical Analysis:
Instrument: Gold vs US Dollar (XAU/USD)
Timeframe: Daily
Current Price: $3,363.26
Resistance Zone: $3,380 – $3,470
Support Zone: $2,970 – $3,100
🧠 Market Context:
Gold has recently approached a well-defined resistance zone near the $3,380–$3,470 range. Price action shows multiple rejection wicks and failed attempts to break above this level, indicating strong selling pressure from bears. 🐻
The current candlestick structure suggests the market is printing lower highs, which may indicate a transition from a consolidation phase into a potential bearish trend.
📉 Projection:
The chart projects a move down toward the support zone, around $2,970–$3,100, possibly due to:
Repeated rejections at the resistance zone 🔄
Lack of bullish momentum near highs ⚠️
Bearish engulfing or reversal candlestick formations 🔻
✅ Key Levels to Watch:
Level Type Price Zone Action
🔴 Resistance $3,380 – $3,470 Strong rejection expected
🟢 Support $2,970 – $3,100 Major demand zone; potential bounce
🧭 Trading Outlook:
⚠️ If price fails to break above the resistance zone, short opportunities may develop with a target near the support zone. A confirmed break and close below $3,300 would strengthen bearish sentiment.
📌 Bearish Bias Maintained Until Resistance Breaks
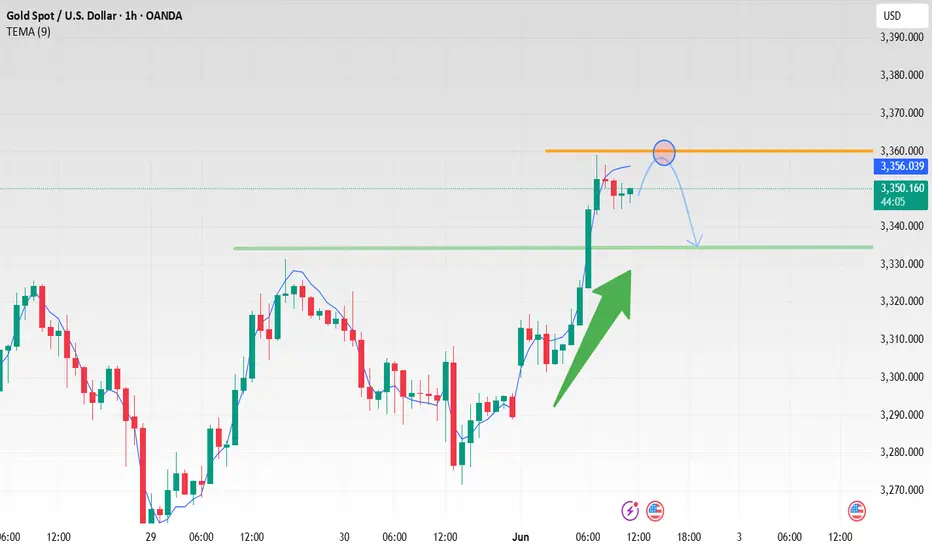
Gold prices have fallen back, so it's time to take action.I reminded all traders in the morning to be alert to the risk of gold falling back today. Now it has successfully reached the point I predicted in the morning; it's time to adopt a long strategy.
From the daily chart of gold:
The current price has fallen back to around 3335, which happens to be the support position of the daily trend line. This is why we are bearish on gold.
As long as the US stock market closes above 3335, gold will still be in a long trend. On the contrary, if it falls below the closing line of 3335 today, it will break the trend line, and the subsequent market may be more complicated. Therefore, the current operation can adopt a long strategy. Long positions are entered near the support level.
If gold once again stabilizes above 3,400, then there is a possibility that it will reach a new high.
Operation strategy:
Enter the market at the current price, stop loss 3330, profit range 3350-3365.

Prices exploded. Beware of falling support.Information summary:
Russia and Ukraine held a second round of peace talks on Monday. The two sides only agreed on the exchange of prisoners.
No breakthroughs have been made on the proposed ceasefire agreement that Ukraine, its European allies and Washington have called on Russia to accept.
Umerov said Ukraine proposed more talks before the end of June, but believed that only a direct meeting between Zelensky and Putin could resolve the differences between the two sides on several key issues. Secondly, Trump's tariff issue has escalated global trade tensions, and the intensification of the Russian-Ukrainian conflict has also caused geopolitical risks to rise rapidly.
Market analysis:
Gold has stretched directly from 3290 at the beginning of the week to a high of 3391, a $100 increase.
From the perspective of the daily gold line, it is indeed in a bullish trend, breaking through several important pressure levels. But I think all traders need to be wary of chasing more at high levels.
The daily trend of gold started from 3120. 3120-3365 is the a wave, 3365-3242 is the retracement of the b wave. So the current trend from 3242 is the rise of the c wave. After breaking through 3340 on Monday, gold has reached 3396 near the 618 position.
At present, if gold cannot stand above 3400, it is very likely to maintain the consolidation in the 3396-3340 range.
Especially before the release of non-agricultural data this week, such a large fluctuation range. Be sure to be alert to the possibility of continuing to fall back to the support of 3340-3330.
Operation strategy:
If the price falls back to around 3340-3350, go long, stop loss at 3330, and profit range at 3370-3380.
Of course, if you prefer aggressive trading, you can choose a short strategy at 3370-3380, stop loss at 3390, and profit range at 3340-3330.

After the price surge, has the trend of gold changed?Gold opened slightly higher in the Asian morning on Monday and then rose. It basically maintained a slow and volatile rise throughout the day. It rose to around 3383 before the close, and the daily line closed with a big positive line.
The current 5-day moving average and the 10-day moving average form a golden cross and extend upward. This signal indicates that the short-term trend is strong. In the short term, we need to focus on the moving average support. The 5/10-day moving average support is in the 3330-3325 area. As long as the price remains above this area, it can be treated as strong. The upper resistance level needs to pay attention to the previous secondary high point of 3438.
In terms of points, the lower support level first looks at around 3360, which is the previous high point of the short-term. After breaking through, we need to pay attention to the top and bottom conversion. The second is the 3330-3325 area support. Pay attention to the top and bottom conversion. If the price falls back strongly, we need to pay attention to the 3300 mark support. This is the current support area of the trend line formed by the low point connection of gold since the rise of 3120.
The upper resistance level is around 3410, followed by the resistance in the 3448-3458 area. This area is the current resistance area of the rising channel formed by the high point since the rise from 3120.
Operation strategy:
Short at current price, stop loss at 3390, profit range 3360-3340;
Long at price drop to around 3340, stop loss 3325, profit range 3345-3360.
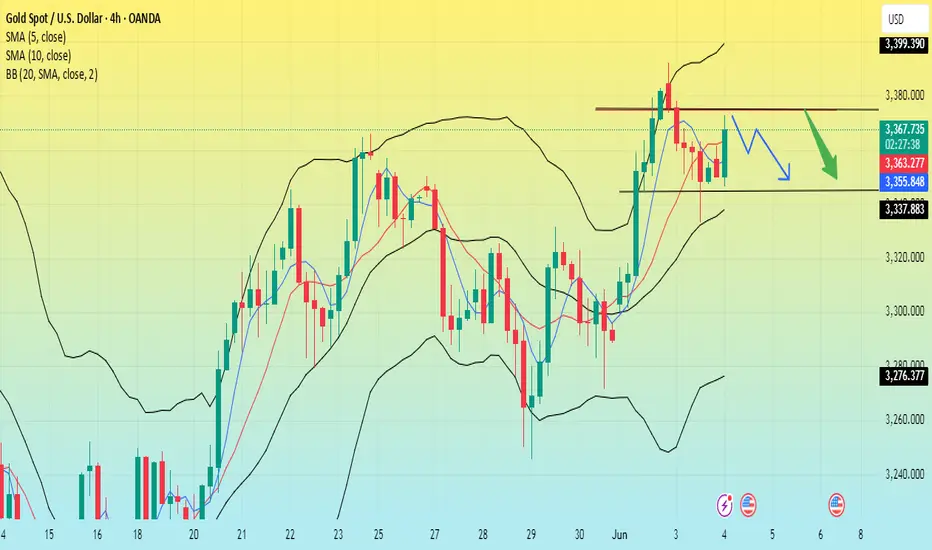
Keep gold shorts open and look forward to profits!After breaking through the resistance areas near 3335 and 3355, gold continued to rise to around 3379; although the rise in gold was relatively large, after gold touched above 3370, the bullish momentum weakened and there were signs of high-level stagflation, so gold is still expected to usher in a wave of retracement in the short term.
After the sharp rise in gold, the current relatively obvious support area is located in the 3345-3335 area. If gold cannot effectively break through 3380, then gold is expected to retrace to test the support of the 3345-3335 area again.
As the trading strategy shared in my previous opinion, I have shorted gold in batches in the 3370-3380 area as planned. At present, we still hold short positions. Let us look forward to the expected retracement of gold!
CAPITALCOM:GOLD OANDA:XAUUSD FOREXCOM:XAUUSD TVC:DXY
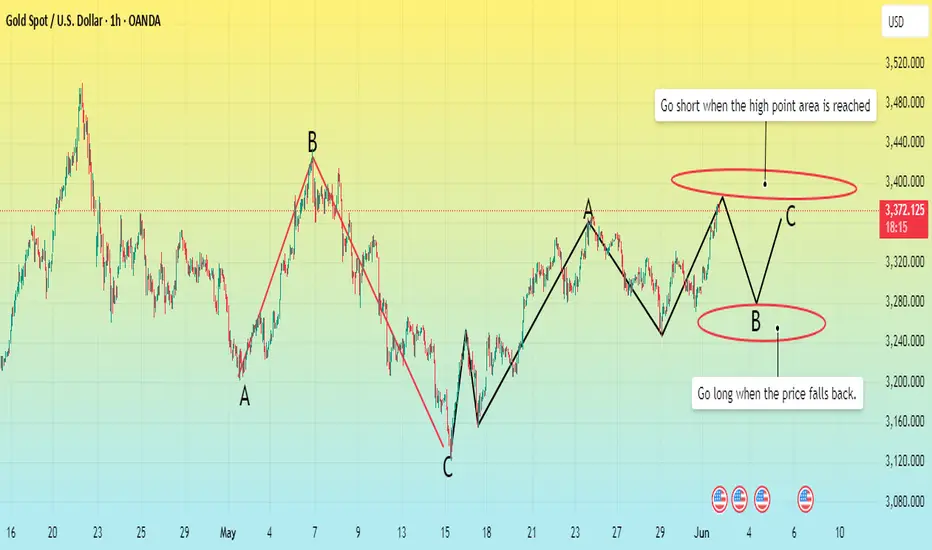
Gold surges, what is the subsequent trend?Weekly chart analysis:
From the weekly chart, gold has been pushed upward for five waves from the starting position of 1614. The current market is in the extended wave of wave 3. Gold has adjusted downward from the high point of 3500. The current market is divided into two situations.
In the first case, assuming that the high point of 3500 has completed the 3rd wave, then 3500 will adjust downward for 4 waves. The three-wave ABC structure within the 4th wave regards 3500-3120 as wave A, 3120 upward as wave B, and there is another wave C decline after wave B to complete the 4th wave adjustment, and then the 5th wave will rise. Therefore, after the market rises, pay attention to the C wave decline at any time.
In the second case, assuming that the 3rd wave has not been completed yet, 3500 is still in the internal adjustment of the extended wave of wave 3. At present, the three-wave ABC adjustment of 3500-3120 has ended, and a new round of upward rise from 3120 may complete the last wave of the 3rd wave. Therefore, after the market rises above 3500, it will face the 4th wave decline at any time.
Hourly chart analysis:
In the 1-hour chart, no matter how the market operates, the current market trend is in a state of shock. Affected by the increased risk aversion due to the weekend news, the market rose sharply after opening on Monday. So what will the trend be after the surge? I think that after the rise, try not to chase the rise, but look for high positions to short, and wait for the market to adjust downward before going long.
Operation analysis:
Currently, the upper resistance is 3385-3405, and the lower support is 3350-3330. Short-term operation suggestions: short at the high point area of 3385-3395, stop loss at 3410, profit range 3360-3350, and continue to look down at 3330-3320 if it breaks. It is recommended to continue to look above 3400 if 3350 is not broken.
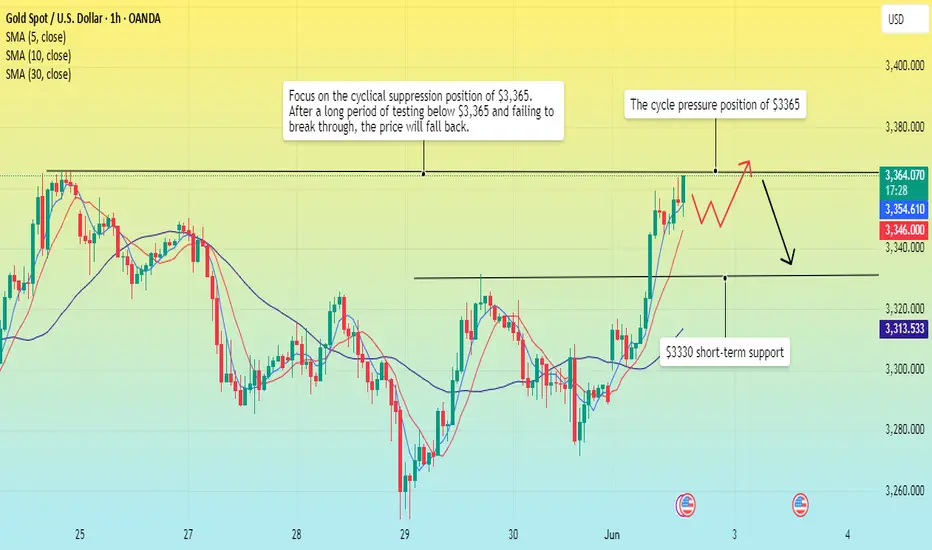
Gold is rising strongly, waiting for a breakthrough.Gold prices soared after the Asian market opened, reaching an intraday high near 3363. However, today's market is also affected by many black swan events.
Event summary:
On the eve of the ceasefire negotiation between Russia and Ukraine, Ukraine attacked a Russian military base with a drone; the United States said it was unaware of the incident.
Trump made a statement saying that China violated the relevant provisions on trade tariffs, and then the US Treasury Secretary said: The United States will never default. This news has worsened Sino-US trade relations.
Due to the sudden black swan event, the sentiment for gold as a safe-haven asset has rapidly heated up, and the price of gold has skyrocketed in the Asian market.
At present, due to the impact of international events, the price of gold has calmed down after the correction, and is currently consolidating around 3355. The 1-hour chart shows that the 5-day MA moving average is currently flat, but the 10-day and 30-day MA moving averages have turned sharply and are on an upward trend, so I think that the current rise in gold has not yet reached its peak.
Market analysis:
The support level in the Asian morning session is around 3300, and the gold price has successfully stood above 3330, and the lower support has also moved up to around 3330; the intraday gold price has a very small retracement, and it is still breaking through the upper side. It is currently trying to break through the cycle suppression level of 3365. After a strong breakthrough, it will reach the cycle high point of 3370. If it fails to break through strongly, the price will fall below 3365 and may touch the current support level of 3330.
Operation strategy:
Buy near 3345, stop loss 3335, target range 3360-3370.
Affected by tariffs, gold prices rebounded to above 3,300
Gold finally broke the calm of the past and resumed its upward trend. What happened? This is also thanks to President Trump, who imposed tariffs again over the weekend, and there was also news of air strikes. The combination of the two directly broke the calm of gold prices in the past.
So where can this wave of gold go? Technically, gold 1-hour cycle, maintained fluctuations around 3,348, and the support line is expected to be around 3,330.
Our strategy today is also very simple. As long as the gold price retests around 3,360-3,350, I will go short. Which specific position can stop profit? I will tell my VIP.
Market Analysis: Gold Price Could Gain Bullish PaceMarket Analysis: Gold Price Could Gain Bullish Pace
Gold started a fresh increase above the $3,300 resistance level.
Important Takeaways for Gold Price Analysis Today
- Gold price started a steady increase from the $3,250 zone against the US Dollar.
- A connecting bearish trend line is forming with resistance at $3,318 on the hourly chart of gold at FXOpen.
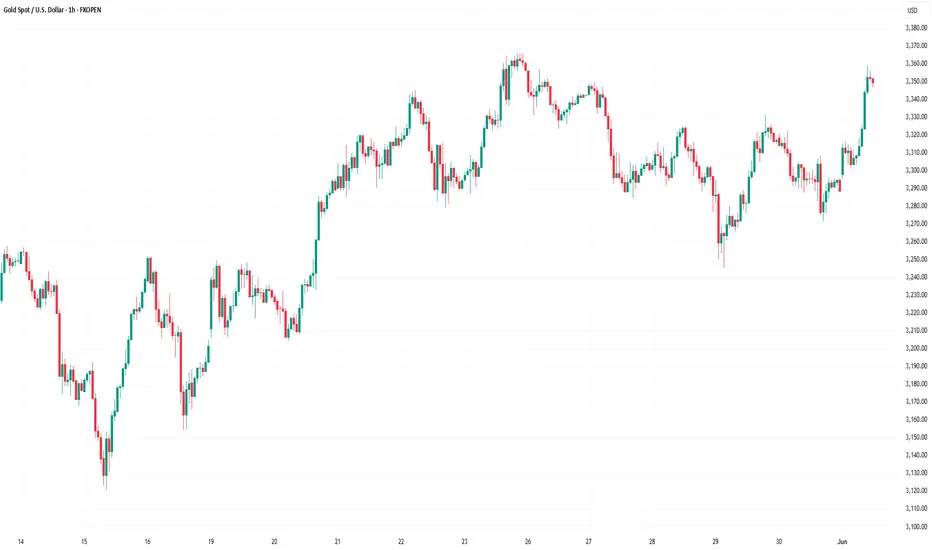
Gold Price Technical Analysis
On the hourly chart of Gold at FXOpen, the price found support near the $3,250 zone, formed a base, and started a fresh increase above the $3,280 level.
The bulls cleared the $3,300 zone and the 50-hour simple moving average. There was also a move above the 61.8% Fib retracement level of the downward move from the $3,331 swing high to the $3,271 low. The RSI is now above 50 and the price could aim for more gains.
Immediate resistance is near the 76.4% Fib retracement level of the downward move from the $3,331 swing high to the $3,271 low at $3,318. There is also a connecting bearish trend line forming with resistance at $3,318.
The next major resistance is near the $3,330 level. An upside break above the $3,330 resistance could send Gold price toward $3,382. Any more gains may perhaps set the pace for an increase toward the $3,400 level.
Initial support on the downside is near the $3,300 zone. If there is a downside break below the $3,300 support, the price might decline further.
In the stated case, the price might drop toward the $3,270 support. The next major support sits at $3,250. Any more losses might send the price toward the $3,220 level.
This article represents the opinion of the Companies operating under the FXOpen brand only. It is not to be construed as an offer, solicitation, or recommendation with respect to products and services provided by the Companies operating under the FXOpen brand, nor is it to be considered financial advice.
Trade conflicts are re-emerging, will gold rise?Information summary:
Gold prices rose slightly in early Asian trading on Monday, affected by the long-term uncertainty of tariffs and international geopolitical conflicts, which increased the demand for safe-haven assets.
Trump made a statement earlier that China had violated the Sino-US trade negotiation regulations in a big way; then the US Treasury Secretary assured that the United States would never default. This has once again led to tensions in Sino-US trade relations, and investors are also cautious about this news.
This news has undoubtedly disrupted the international market and supported the rise in gold prices.
Traders need to pay attention to the May ISM manufacturing report to be released by the United States today, which may affect the new trend of gold.
Trading analysis:
I think the repeated emotions of the United States on tariffs will cause gold prices to rebound after a downward adjustment, and then fall slightly.
If gold cannot break through the upward 3350 cycle pressure level strongly and stabilize above this position. Then the price will fall back below this position.
Operation strategy:
Long at 3340, stop loss at 3330, take profit at 3350.
Short at 3350, stop loss at 3365, profit range is around the early support level of 3300-3390.
If you want to trade steadily, you can continue to wait and see for some time, because there are too many black swan events in the Asian market today, and the market is full of uncertainty.

The international situation is turbulent, how is the trend of goInformation summary:
On June 1, Russia and Ukraine continued to clash. Ukrainian drones attacked several Russian military airports, including military bases in eastern Siberia, more than 40 aircraft were damaged, and the loss was about 2 billion US dollars. This was the first time that a military base in Siberia was attacked by a drone. Murmansk Oblast was also attacked by a drone on the same day.
However, on the same day, Russia and Ukraine planned to hold a second round of ceasefire negotiations in Istanbul on June 2. The United States said that it was not informed of the Ukrainian attack in advance. Russia and the US Foreign Minister discussed the negotiation plan by phone. The Hungarian Prime Minister revealed that the mediation in 2024 was unsuccessful, and the two sides had obvious differences on the timing of the ceasefire.
The current situation is complicated, the prospects for peace talks are unclear, and market risk aversion and economic data (this week's employment report, central bank interest rate decision, etc.) have become new focuses.
Gold trend analysis:
From the daily chart, the current daily support position is around 3280. This position is the key to the gold band trend. Since the price has broken upward recently, it has stepped back many times and finally closed above the daily support, so the position of the daily support is still the key. Before falling below this support level, the price will most likely maintain a range of 3320-3280 US dollars.
Operation strategy:
Buy near 3280, stop loss 3270, profit position 3320.
