Market Analysis: Gold Prices Ease – Market Awaits Fresh CatalystMarket Analysis: Gold Prices Ease – Market Awaits Fresh Catalyst
Gold price started a fresh decline below $3,380.
Important Takeaways for Gold Price Analysis Today
- Gold price climbed higher toward the $3,430 zone before there was a sharp decline against the US Dollar.
- A key bearish trend line is forming with resistance near $3,350 on the hourly chart of gold at FXOpen.
Gold Price Technical Analysis
On the hourly chart of gold at FXOpen, the price climbed above the $3,380 resistance. The price even spiked above $3,400 before the bears appeared.
A high was formed near $3,432 before there was a fresh decline. There was a move below the $3,380 support level. The bears even pushed the price below the $3,350 support and the 50-hour simple moving average.
It tested the $3,325 zone. A low was formed near $3,325 and the price is now showing bearish signs. There was a minor recovery wave towards the 23.6% Fib retracement level of the downward move from the $3,433 swing high to the $3,325 low.
However, the bears are active below $3,342. Immediate resistance is near $3,350. There is also a key bearish trend line forming with resistance near $3,350.
The next major resistance is near the $3,380 zone. It is close to the 50% Fib retracement level of the downward move from the $3,433 swing high to the $3,325 low. The main resistance could be $3,410, above which the price could test $3,432. The next major resistance is $3,450.
An upside break above $3,450 could send the gold price towards $3,465. Any more gains may perhaps set the pace for an increase toward the $3,480 level.
Initial support on the downside is near the $3,325 level. The first major support is near the $3,310 level. If there is a downside break below it, the price might decline further. In the stated case, the price might drop towards the $3,265 support.
This article represents the opinion of the Companies operating under the FXOpen brand only. It is not to be construed as an offer, solicitation, or recommendation with respect to products and services provided by the Companies operating under the FXOpen brand, nor is it to be considered financial advice.
Xauusdtrading
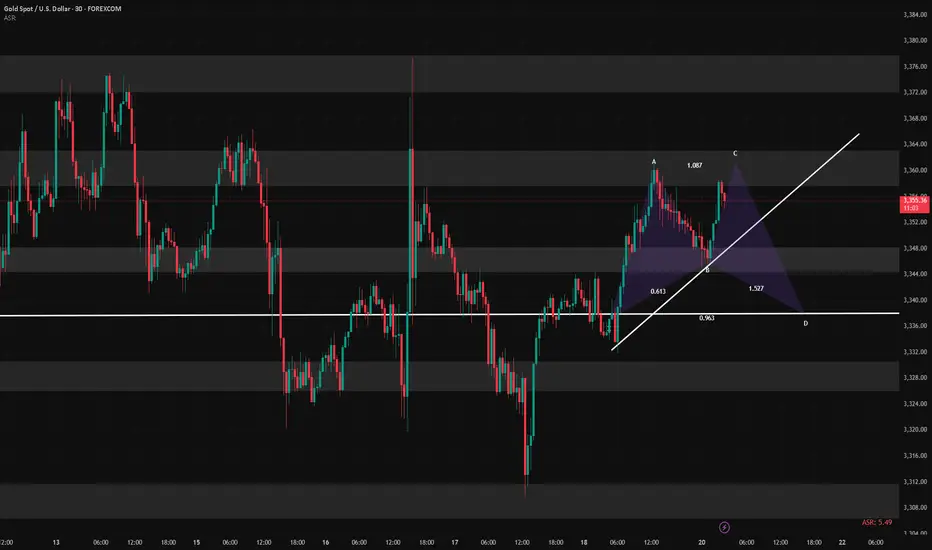
Gold (XAU/USD) 4-Hour Technical Analysis Report - 25 July 2025 📌 Market Context & Sentiment Overview
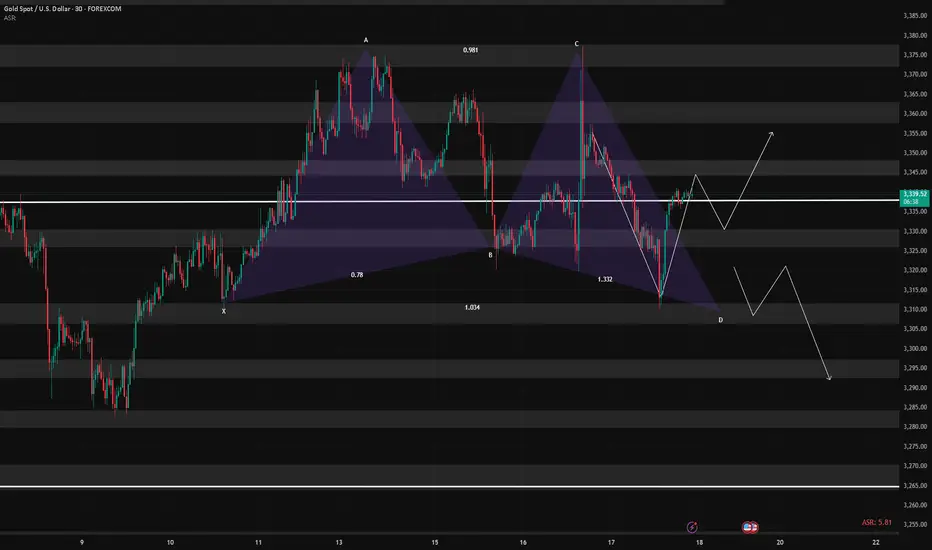
The gold market is currently trading in a state of technical compression, with the price hovering just beneath the mid-3360s. After a significant rally earlier in the month, the recent sessions have seen price action coiling within a tight ascending triangle—a classic pattern known to precede breakouts.
According to recent publications by FXEmpire, FXStreet, and Investing.com, sentiment remains moderately bullish. Analysts point to strong institutional demand near the 3320–3330 zone, while also warning of resistance pressures near the 3380–3390 zone. These insights align with our technical findings, which suggest a developing structure with increasing breakout potential.
📊 Technical Structure Analysis (4-Hour Timeframe)
🔹 Price Action & Structural Patterns
The prevailing structure is a rising triangle anchored between support at 3320 and resistance near 3380–3390. Price has been forming higher lows, indicative of underlying buying pressure, while simultaneously facing resistance at increasingly frequent tests of the upper band. The contraction of candlestick bodies and volume confirms the presence of a coiling market—hinting at an imminent directional move.
The presence of upper-wick rejections near 3380 signals seller interest, while long-tailed candles at 3330 underscore buyer defense of the rising trendline. This dynamic equilibrium is the hallmark of a triangle formation nearing completion.
🔹 Support & Resistance Levels
Our analysis identifies the following zones as technically significant:
Key Support (Buy Zones):
3320–3330: This zone hosts a major bullish order block, 8/21 EMAs, and the lower trendline of the rising triangle. It is further supported by the 61.8% Fibonacci retracement drawn from the 3300 low to the 3390 swing high.
3300–3310: A psychological level and previous 4-hour swing low. Acts as a secondary defense level.
Key Resistance (Sell Zones):
3380–3390: Triangle resistance, aligned with the 50 EMA and a bearish order block.
3440–3450: An upper extension zone if breakout materializes, noted in external institutional outlooks.
🔹 Volume, VWAP & Institutional Concepts
Volume has notably contracted, a classical feature of triangle formations, with most trading volume aggregating at the mid-point (~3345–3355). VWAP sits just below the current price, reflecting mean reversion tendencies. Furthermore, liquidity pockets are observed just beneath 3320, suggesting potential for liquidity grabs before a bullish reversal.
From a Smart Money lens:
A bullish order block has formed near 3320–3330.
A bearish OB and resistance cap prices around 3380.
A small Fair Value Gap (FVG) lies around 3340–3350, acting as a potential price magnet.
🔹 Indicators & Oscillators
Moving Averages: The 8/21 EMA cluster lies just below current price, offering dynamic support.
MACD: Negative but converging—suggesting bearish momentum may be waning.
ADX: Reading ~40, indicating a trending market, though momentum has slightly slowed.
RSI: Hovering near 35–40, close to oversold; signals potential bounce.
Stochastics & CCI: Both deeply negative—supporting the case for a mean-reverting move.
🎯 Strategic Buying & Selling Zones
✅ High-Probability Buy Zones
3320–3330:
Rationale: Confluence of bullish OB, rising trendline, EMAs, and Fib 61.8%.
Confidence: High (★ ★ ★)
3300–3310 (buffer zone):
Rationale: Psychological and historical swing low support.
Confidence: Moderate
❌ High-Probability Sell Zones
3380–3390:
Rationale: Triangle resistance, prior highs, and bearish OB presence.
Confidence: High
3440–3450:
Rationale: Post-breakout measured move target and potential take-profit zone.
Confidence: Moderate
🏆 The Golden Setup: High-Conviction Trade Idea
Direction: Long
Entry: 3325
Stop Loss: 3300
Take Profit: 3390
Confidence Level: ★ ★ ★ (High)
🔍 Justification
This setup takes advantage of the strongest structural support within the triangle—centered around 3325. This level is reinforced by the 61.8% Fibonacci retracement, bullish order block activity, and EMA compression, all coalescing with the triangle’s rising support line.
Indicators are turning from oversold, and the volume profile suggests that institutional players may look to engineer a liquidity sweep under 3330 before a continuation push to test the 3380 resistance. The reward-to-risk ratio is favorable, and the setup offers clear invalidation with a tight stop at 3300.
Should momentum continue post-breakout, a secondary TP could be explored at 3440. However, for the purpose of tactical execution, 3390 is a strategically sound exit point.
🧠 Sentiment Cross-Check & Market Alignment
External sentiment and professional forecasts support the underlying thesis of a bullish breakout, pending confirmation. TradingView’s top technical authors emphasize the breakout of this ascending triangle toward 3440+, while Investing.com’s shorter-term signals reflect bearish pressure that aligns with our buy-the-dip strategy.
This synthesis of internal and external analysis increases our conviction in a long-biased tactical approach from the current support zone.
✅ Summary Table
Buy Zones Sell Zones Golden Setup
3320–3330 (primary) 3380–3390 (primary) Direction: Long
3300–3310 (buffer) 3440–3450 (extension) Entry: 3325
Stop Loss: 3300
Take Profit: 3390
Confidence Level: ★ ★ ★ (High)
🔚 Final Thoughts
Gold’s current price structure presents a rare opportunity—one defined by tight consolidation, structural clarity, and institutional footprints. As the market coils within a classic triangle, the 3320–3330 zone emerges as a high-probability springboard for long positions. With precise risk management and a disciplined approach, this setup offers traders a compelling entry with defined technical boundaries.
The golden rule now: Respect structure. React to confluence. Trade with conviction.

XAU/USD Chart Analysis: Bulls Break Important ResistanceXAU/USD Chart Analysis: Bulls Break Important Resistance
When analysing the XAU/USD chart last week, we:
→ noted that the ADX indicator had reached its lowest level since the beginning of 2025 – a clear sign of declining gold price volatility;
→ highlighted the formation of a large-scale triangle with its axis around the $3,333 level, bounded by a resistance line (marked in red) and the lower boundary of the ascending channel.
Since then, the price has climbed above $3,400 – reaching its highest level since mid-June. According to media reports, the uptick in demand may be driven by escalating geopolitical risks, renewed optimism regarding potential monetary policy easing in the US, and consistent gold buying from central banks.
This suggests that the balance has shifted in favour of the bulls, who have made an attempt to break through the resistance line – an attempt that, so far, appears promising and points towards a potential resumption of the upward trend.
However, today's XAU/USD chart shows that the bulls are now facing a key resistance level at $3,440 – a level that has reversed gold prices downward both in May and June. What will happen in July?
It is possible that, following a prolonged consolidation near the lower boundary of the channel, the bulls have built up sufficient momentum to finally break through this critical level and push gold prices towards line Q, which divides the lower half of the long-term channel into two quarters.
This article represents the opinion of the Companies operating under the FXOpen brand only. It is not to be construed as an offer, solicitation, or recommendation with respect to products and services provided by the Companies operating under the FXOpen brand, nor is it to be considered financial advice.

Bullish Channel in Play Key Trading Zones and Strategy for JulyOn the 1-hour chart, XAUUSD is clearly moving inside a well-defined ascending price channel, with price respecting both the channel boundaries and the midline as dynamic support/resistance. The pair continues to print higher highs and higher lows, confirming short-term bullish structure.
Trend Channel: Since July 18, gold has been steadily climbing within an ascending channel, bouncing off the lower boundary and riding above the midline.
EMA Support: The 10-period EMA (purple) has been acting as a dynamic support. Price has yet to close below it during this bullish swing.
Candle Behavior: Recent bullish candles with strong bodies show that buyers still have control, although price is stalling near the upper boundary of the channel.
Technical Level
3,459 USD. Major Resistance. Top of the channel – potential reversal or take-profit zone
3,423 USD.Immediate Support. EMA10 and current consolidation area
3,400 USD. Mid-Channel Support. Key pullback zone if price rejects near highs
3,360 – 3,365 USD. Major Support. Bottom of the ascending channel – break may invalidate bullish setup
Scenario 1 – Buy the Dip (trend continuation):
Wait for price to retest the 3,400 – 3,410 USD area or EMA10.
Look for bullish confirmation (e.g., pin bar, bullish engulfing).
Target: 3,445 – 3,459 USD
Stop loss: below 3,395 USD
Scenario 2 – Short at Channel Top (mean-reversion setup):
Monitor price behavior near 3,455 – 3,459 USD resistance.
If bearish reversal candles appear (e.g., shooting star, bearish engulfing), consider shorting.
Target: 3,420 – 3,410 USD
Stop loss: above 3,465 USD
As long as price remains inside the rising channel, buying pullbacks is the preferred strategy.
Stay alert to macroeconomic catalysts (Fed comments, PMI data, labor market releases) that could increase volatility.
Gold remains in a strong short-term uptrend on the 1H chart. Trading in the direction of the trend with proper risk management continues to offer the best opportunities for intraday traders.
If you found this analysis useful, don’t forget to follow for more trading strategies and ideas!

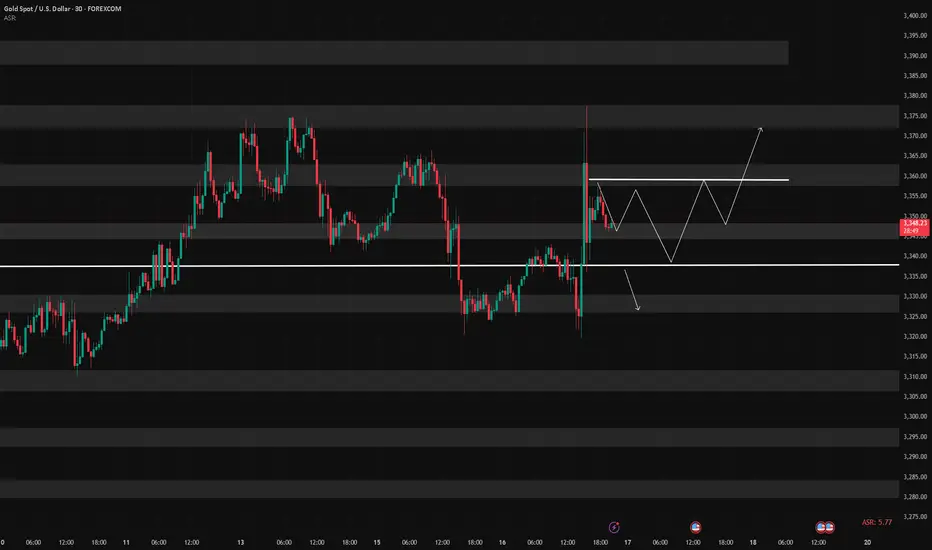
July 21: Key Resistance at 3358–3366, Breakout Targets 3378–3388Good morning, everyone!
Last Friday, gold tested the support around 3332 but did not break below it. The price then rebounded to the 3358 zone, where it encountered selling pressure and pulled back. At today's open, the price retraced to the 3343 level, where support held well, prompting another rally back toward 3358.
It’s important to note that since the 3358 resistance was already tested on Friday, some of the selling pressure has likely been absorbed. As a result, there is a higher probability of a breakout today. If a breakout occurs, the next key resistance lies at 3366/3372–3378. In the case of strong bullish momentum, the price may extend further toward the 3386–3392 resistance zone.
However, if the price continues to be capped below 3358–3366, we may see a consolidation or short-term pullback. In this case, watch support at 3348–3343. Should the price successfully break above 3378, then support on pullbacks will shift higher to 3363 and 3358–3352.
🔺 Key Warning: The 3358 resistance zone is technically crucial. If the price repeatedly fails to break through, watch out for a potential double-top pattern on the 30-minute chart, which could signal a near-term bearish reversal.
Gold (XAU/USD) Technical Outlook — 21 July 20251. Market Overview & Live Price Confirmation
Gold is currently trading around $3,354, with a daily range of approximately $3,345–$3,359. This places it firmly within its broader uptrend, showing resilience amid recent macro uncertainties and consolidating its position above key support zones.
2. Four-Hour Technical Breakdown
Trend & Structure
The 4-hour chart reveals a strong bullish structure, marked by consistent higher highs and lows. A recent Break of Structure occurred near $3,324, reinforcing the upward bias. A minor Change of Character around $3,360–$3,358 reflects a healthy retracement, but the bigger picture remains strong.
Key SMC & ICT Zones
Supply Zone: $3,360–$3,362 — recent peak area likely to attract sellers and sweep above liquidity.
Demand Zone: $3,340–$3,344 — aligns perfectly with the 38.2% Fib from the $3,308–$3,362 swing, forming a prime area to buy from.
Order Block / FVG Zone: $3,336–$3,342 — open imbalance suggesting price may revisit for efficient entry.
Liquidity Context: Order flow patterns indicate stop hunts around established zones — part of classic Smart Money Concepts.
Fibonacci Levels
38.2% retrace at $3,340, offering medium-term confluence support.
Upside projections via Fibonacci:
1.272 extension: $3,378
1.618 extension: $3,389
3. One-Hour Intraday Trading Setups
Aligned with the 4-hour bullish bias, these setups offer scalable, structured entry opportunities.
Strategy Entry Zone Stop-Loss Take-Profit Risk:Reward
Aggressive Long $3,344 $3,338 $3,358 → $3,362 ~2:1
Conservative Long $3,340 $3,330 $3,362 → $3,378 ~2.5:1
Short Opportunity Rejection @ $3,362 $3,368 $3,344 ~2:1
🌟 The Golden Setup
Buy within $3,340–$3,344 (4H demand + Fib zone + FVG)
Stop-Loss: $3,330
Take-Profit 1: $3,362 (range high)
Take-Profit 2: $3,378 (Fib 1.272)
Why It Works: A confluence of structural support, liquidity zones, and retracement levels gives this setup high predictive quality.
4. Analyst Consensus Snapshot
Market commentary from professional analysts shows alignment with dip-buy strategies. Most recognize the $3,340 region as key support and express caution entering $3,360–$3,375 resistance. Weekly forecasts describe tight trading with potential for breakouts or retracements depending on economic data and Fed commentary, but the medium-term trend remains bullish.
5. Summary & Trading Blueprint
Price Range: $3,345–$3,359 (daily); $3,338–$3,378 (targets)
4-Hour Bias: Bullish, with defined demand and supply zones
Golden Trade: Buy $3,340–3,344 → SL $3,330 → TP1 $3,362 / TP2 $3,378
Catalysts to Watch: Federal Reserve speech, tariff developments, USD movements.
6. Final Thoughts
Gold continues to demonstrate bullish resilience, supported by both technical structure and macro tailwinds. The $3,340–3,344 zone offers a clear, high-probability entry confluence, while stop placement and profit targets are well-defined. Profit management around $3,360 ensures disciplined scaling or early exits if risk factors emerge.
By blending price action, Smart Money frameworks, ICT concepts, and Fibonacci confluence—all structured into actionable trade setups—you have a professional-grade playbook ready for deployment.

7/18: Watch 3343 Resistance, Guard Against Break Below 3323Good morning, everyone!
Yesterday, gold broke below the 3337 support after consolidating there, driven lower by bearish data, and eventually reached the 3323–3312 support zone. A rebound followed, and price has now returned above 3323, which also aligns with the daily MA60.
📌 Key Levels to Watch Today:
Resistance: 3343 / 3352–3358
→ A sustained break above 3343 opens the door for a potential move toward 3366 / 3372–3378;
Support: 3323 / 3312
→ If price remains capped below resistance and weekly close is under 3323, it will signal bearish structural pressure for the medium term.
📌 Trading Strategy:
Trade flexibly within the range of 3358–3343–3332–3323–3312
📌 Important Reminder:
If today’s closing price is below 3323, and you're planning to hold positions over the weekend, it’s safer to lean short. While we can’t predict weekend news, technically, bears have the upper hand, so risk control is essential.
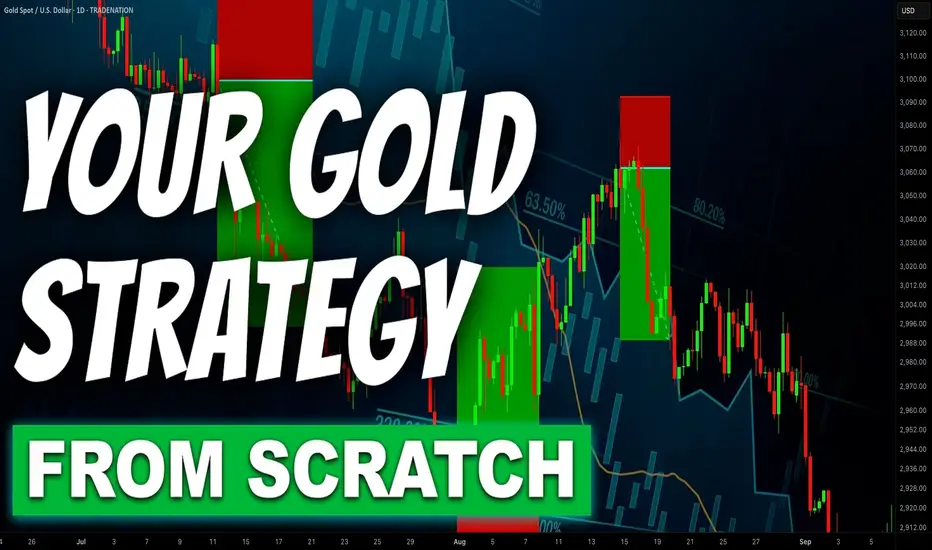
Step-By-Step Guide to Building a Winning Gold Trading Strategy
In the today's article, I will teach you how to create your first profitable gold trading strategy from scratch.
Step 1: Choose the type of analysis
The type of analysis defines your view on the market.
With technical analysis you rely on patterns, statistical data, technical indicators, etc. for making trading decisions.
Fundamental analysis focuses on factors that drive the prices of gold such as micro and macroeconomics, news and geopolitics.
A combination of technical and fundamental analysis implies the application of both methods.
For the sake of the example, we will choose pure technical approach.
Step 2: Specify the area of analysis
Technical and fundamental analysis are complex and multilayered subjects. That is why it is crucially important to choose the exact concepts and techniques that you will apply in gold trading.
For example, with a technical analysis, you can trade harmonic patterns, or apply a combination of key levels and technical indicators.
With fundamental analysis, you can build your trading strategy around trading the economic calendar or important news releases.
Here we will choose support & resistance levels and smart money concepts.
Step 3: Select a trading time frame
Your trading time frame will define your trading style. Focusing on hourly time frame, for example, you will primarily catch the intraday moves, while a daily time frame analysis will help you to spot the swing moves.
You can also apply the combination of several time frames.
We will choose the combination of a daily and an hourly time frames.
Step 4: Define your trading zones
By a trading zone, I mean an area or a level on a price chart from where you will look for trading opportunities.
For example, a technical indicator trader may apply moving average as the trading point.
For the sake of the example, we will choose support and resistance levels on a daily time frame as our trading areas.
Step 5: Choose confirmations
Confirmation is your entry reason . It is the set of conditions that indicates a highly probable projected outcome.
For an economic calendar traders, the increasing CPI (inflation) figures can be a solid reason to open a long position on Gold.
Our confirmation will be a local change of character on an hourly time frame.
Step 6: Define your stop loss placement, entry and target selection and desired reward to risk ratio
You should know exactly where should be your entry point, where will be your stop loss and where should be the target.
We will open a trading position immediately after a confirmed change of character, stop loss will lie below the lows if we buy or above the highs if we sell.
Target will be the next daily structure.
Minimal reward to risk ration should be 1.5.
Step 7: Define Your Lot Size and Risk Per Trade
You should have precise rules for the calculation of a lot size for each trade.
For our example, we will strictly risk 1% of our trading deposit per trade.
Step 8: Set trade management rules
When the trade is active, trade management rules define your action:
for example, whether you strictly wait for tp or sl, or you apply a trailing stop loss.
In our strategy, we will move stop loss to entry 10 minutes ahead of the release of the US news in the economic calendar.
Step 9: Back test your strategy
Study the historical data and back test at least 50 trading setups that meet your strategy criteria.
Make sure that the strategy has a positive win rate.
Step 10: Try a trading strategy on a demo account
Spend at least a month on demo account and make sure that you obtain positive overall results.
If you see consistent profits on a demo account, it is the signal for you that your strategy is ready , and it's time to start trading on a real account.
In case of negative results, modify your trading conditions and back test them again, or build a new strategy from scratch.
❤️Please, support my work with like, thank you!❤️
I am part of Trade Nation's Influencer program and receive a monthly fee for using their TradingView charts in my analysis.
Gold (XAU/USD) Premium Technical Outlook - 18 July 2024As gold continues to trade near record highs, the market’s current price action around $3,336–3,340 demands a sharp, disciplined technical view. This premium analysis combines price action, Fibonacci techniques, institutional concepts (ICT and Smart Money Concepts), and advanced supply–demand dynamics to identify actionable trade opportunities.
We anchor on the 4-hour timeframe for directional bias and zoom into the 1-hour chart for precision intraday setups.
📊 4‑Hour Timeframe: Structure and Directional Bias
Gold remains in a clear bullish structure on the 4-hour chart, as evidenced by sustained higher highs and higher lows. The most recent bullish Break of Structure (BOS) occurred above the $3,320–3,325 level, confirming buyers’ control for now.
Currently, price hovers near equilibrium at the 61.8% Fibonacci retracement, testing prior resistance as potential support. This zone aligns with a small fair value gap (FVG), reinforcing it as an area of interest for smart money participants.
Key 4H Levels to Watch
Level Significance
$3,360–3,365 Major supply zone & bearish OB
$3,350–3,355 Minor resistance
$3,337–3,340 61.8% Fib / equilibrium
$3,330–3,333 BOS retest & key support
$3,300–3,310 Strong demand zone & bullish OB
$3,285–3,295 Secondary demand zone below BOS
The directional bias on 4H remains neutral-to-bullish, contingent on price holding above $3,300. A clean break and close above $3,360 could open a path to $3,400–3,420, while a sustained drop below $3,300 would mark a change of character (CHOCH) and shift bias to bearish.
🪙 Institutional Concepts in Play
Order Blocks (OB): Strong bullish OB sits at $3,300–3,310, while a bearish OB dominates at $3,355–3,365.
Fair Value Gaps (FVG): On the bullish side, $3,300–3,315 remains unfilled; on the bearish side, $3,330–3,345 caps rallies.
Liquidity Grabs: Dips toward $3,295–3,300 appear to sweep sell-side liquidity, while spikes above $3,360 tap into resting buy stops.
The area around $3,330 remains a key battleground where smart money likely accumulates positions before the next impulsive move.
⏳ 1‑Hour Timeframe: Intraday Trade Setups
On the 1-hour chart, the market is compressing between a bullish order block and bearish supply. Price action shows evidence of short-term liquidity sweeps and reactions to imbalances, offering two clear scenarios for intraday traders.
📈 Setup A – Bullish Zone Bounce
Entry: Buy limit at $3,332–3,333
Stop-loss: Below $3,328
Take-Profit 1: $3,345
Take-Profit 2: $3,355
Rationale: Confluence of 4H demand, Fib retracement, BOS retest, and 1H bullish order block.
📉 Setup B – Supply Rejection Short
Entry: Sell limit at $3,355–3,360
Stop-loss: Above $3,365
Take-Profit 1: $3,337
Take-Profit 2: $3,330
Rationale: Price into 4H bearish OB, aligning with supply and stop runs above recent highs.
🌟 The Golden Setup
Among these, the Bullish Zone Bounce at $3,332–3,333 stands out as the highest-probability trade. This level represents maximum confluence:
Retest of 4H BOS.
Bullish OB on 1H.
61.8% Fibonacci support.
Unmitigated fair value gap.
This setup offers a favorable risk–reward profile with clear invalidation and multiple upside targets.
🔎 Summary Table
Bias Key Support Zones Key Resistance Zones
Neutral-to-bullish $3,300–3,310, $3,330–3,333 $3,350–3,355, $3,360–3,365
Intraday Setups Entry Zone Stop-Loss Take-Profit Targets
Bullish Zone Bounce 🌟 $3,332–3,333 < $3,328 $3,345 / $3,355
Supply Rejection Short $3,355–3,360 > $3,365 $3,337 / $3,330
📣 Final Word
Gold maintains a structurally bullish outlook above $3,300, with strong institutional footprints evident in the $3,300–3,333 demand zones. Traders should remain vigilant around $3,360, where sell-side liquidity and supply are concentrated.
The Golden Setup — a bullish bounce from $3,332 — offers the best confluence and statistical edge intraday.

XAU/USD Chart Analysis: Volatility at a Yearly LowXAU/USD Chart Analysis: Volatility at a Yearly Low
The daily chart of XAU/USD shows that the Average Directional Index (ADX) has reached its lowest level since the beginning of 2025, indicating a significant decline in gold price volatility.
Yesterday’s release of the US Producer Price Index (PPI) initially triggered a sharp spike in gold prices, but the gains were short-lived, with the price quickly reverting to previous levels. This price action aligns with a broader market narrative of equilibrium—where supply and demand are in relative balance, and the market appears to be efficiently pricing in key influencing factors, including geopolitical tensions and tariff-related developments.
However, this fragile balance may soon be disrupted.
Technical Analysis of XAU/USD
From a broader technical perspective, gold remains within a long-term ascending channel (highlighted in blue) in 2025. Key observations include:
→ Attempts to rebound from the lower boundary of the channel (marked with arrows) lack conviction. Bulls are not capitalising on these opportunities to reignite the uptrend, suggesting a potential exhaustion of buying interest.
→ A trendline drawn across the major highs of 2025 has proven to be a strong resistance level. All recent breakout attempts have failed at this barrier.
As a result, the XAU/USD chart is showing signs of forming a large-scale triangle pattern, with its axis centred around the $3,333 level. If bulls continue to falter in extending the multi-month rally, it could encourage bears to challenge the lower boundary of the ascending channel, increasing the risk of a downside breakout.
This article represents the opinion of the Companies operating under the FXOpen brand only. It is not to be construed as an offer, solicitation, or recommendation with respect to products and services provided by the Companies operating under the FXOpen brand, nor is it to be considered financial advice.

7/17: Key Support for Gold Bulls at 3343–3337During the Asian session today, gold rose as expected into the 3337–3343 resistance zone. After failing to break through, the price retraced during the European and U.S. sessions, reaching the 3323–3313 support area. A sharp rally followed due to unexpected news, pushing the price into the 3372–3378 resistance zone. Overall, the intraday bullish strategy performed well, yielding solid profits.
After this sharp volatility, price movement has stabilized somewhat. The MA60 support on the daily chart remains intact.
For tomorrow’s trading, key levels to watch are:
🔽 Support: 3343–3337, with secondary support at 3328–3323
🔼 Resistance: 3372–3378
On the 2-hour chart, bullish momentum appears likely to continue as long as price holds above the support zone.
Additionally, upcoming economic data releases and any further developments on the report regarding Trump potentially firing Powell could have a significant impact on market sentiment—these factors should be closely monitored.
In summary, tomorrow’s initial trading focus can remain within the 3337–3358 range, with strategies adjusted as market conditions evolve.
7/16: Will Gold Reclaim 3350 or Fall to 3250?During today’s session, gold briefly broke through the 3352–3358 resistance zone, but due to news-driven pressure during the pullback, bullish momentum weakened, and the price retreated to the MA60 support level on the daily chart.
Given the significant retracement, there is a possibility that a short-term bottom may form during the upcoming Asian session, potentially leading to a retest of the 3337-3343/3352-3358 resistance area:
If the price breaks above this zone and holds above it after a pullback, the bullish trend could resume;
However, if it fails to break through or is rejected again, caution is warranted, as this could signal a larger-scale downtrend on the weekly chart, possibly targeting the 3250 area.
7/15: Watch for Long Opportunities Around 3343 / 3332–3326Good morning, everyone!
Yesterday, gold rose into the resistance zone before pulling back, testing support around 3343. After today’s open, the price continues to consolidate near this support level.
On the 30-minute chart, there is a visible need for a technical rebound, while the 2-hour chart suggests that the broader downward movement may not be fully completed. The MA60 support area remains a key level to watch.
If support holds firm, the price may form a double bottom or a multi-bottom structure, potentially leading to a stronger rebound.
As such, the primary trading strategy for today is to look for long opportunities on pullbacks, with key levels as follows:
🔽 Support: 3343, and 3332–3326 zone
🔼 Resistance: 3352–3358, followed by the 3372–3378 upper resistance band
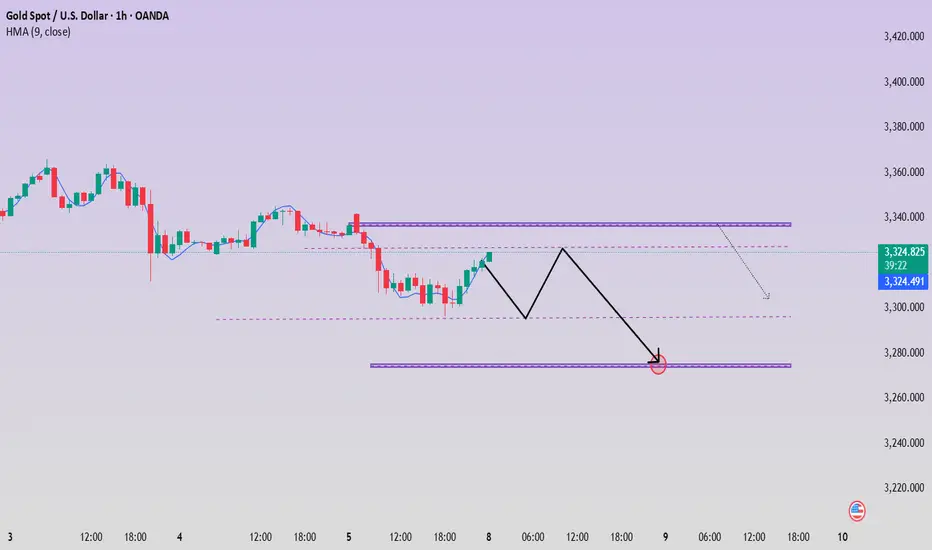
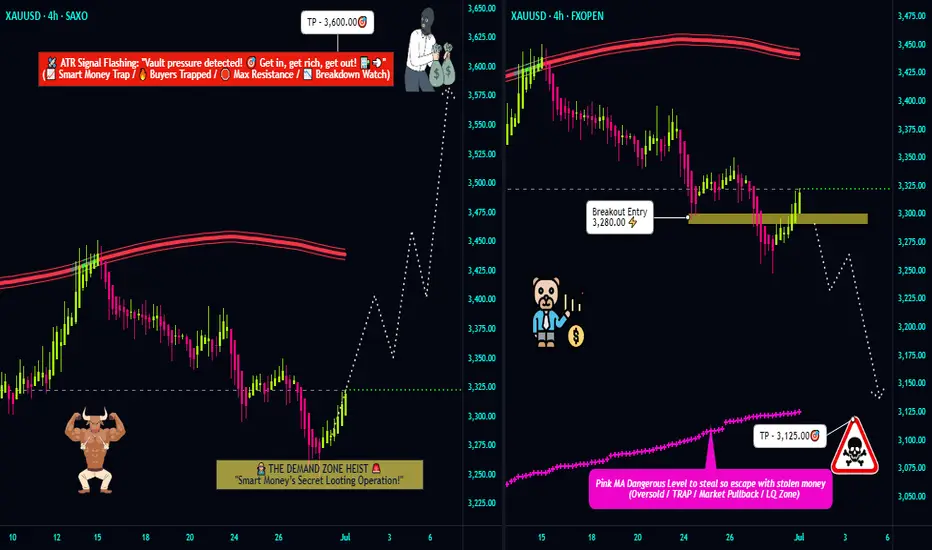
"Gold at a Crossroads! Bullish or Bearish? (Trade Plan)"🦹♂️💰 "Gold Heist Alert: XAU/USD Bullish Raid or Bearish Ambush?" 💰🦹♂️
🌍 Greetings, Market Pirates & Profit Raiders! 🌍
(Hola! Oi! Bonjour! Hallo! Marhaba!)
Based on the 🔥Thief Trading Method🔥, here’s our strategic heist plan for XAU/USD (Gold vs. Dollar). Follow the chart markings for high-probability loot zones—whether you're a bullish bandit or a bearish burglar! 🏴☠️💸
🎯 Entry Strategy (Where to Strike)
"The treasure is ripe for taking! Breakout = GO TIME!"
✅ Long Entry (Bullish Raid): Jump in at current levels if the uptrend holds.
✅ Short Entry (Bearish Ambush): Wait for a break & close below 3280.00 (confirms downtrend).
🛑 Stop Loss (Escape Route)
🚨 For Bulls: Bail out if price hits 3240.00 (SL tightens if trend strengthens).
🚨 For Bears: Retreat if price surges past 3360.00 (only activate SL post-breakout!).
🎯 Take Profit (Loot & Scoot!)
💰 Bullish Thieves: Aim for 3600.00 (or exit early if momentum fades).
💰 Bearish Bandits: Target 3125.00 (or escape before the cops—err, reversal—arrives).
📡 Market Intel (Why This Heist?)
Gold’s in a neutral zone (but bulls have the edge! 🐂📈). Key factors:
Macroeconomic shifts
COT data clues
Sentiment & seasonal trends
(Full breakdown in the chart notes—klick the 🔗! 🔍🌐)
⚠️ Danger Zones (News & Risk Control)
🚨 High-Impact News = NO NEW TRADES!
🚨 Protect open positions: Use trailing stops to lock in profits.
🚨 Adjust SLs if volatility spikes!
💥 Boost the Heist! 💥
Like & Share to fuel our next market robbery! 🚀💰
Follow for more lucrative trade setups—coming soon! 👀🔥
🎯 Trade Smart, Steal Smarter! 🦹♂️💎
Trump's tariff news stimulates gold to explode!
📌 Driving Events
Gold prices rose for the third consecutive day and are expected to close higher this week. The trend turned in favor of gold buyers as tariff tensions intensified. US President Trump announced new tariffs, exacerbating concerns about a trade war.
📊Personal Comments:
Signs of instability in Trump's trade policy have once again hit investor confidence, reviving safe-haven demand for gold. In the absence of any top US economic data, the market will continue to focus on trade headlines. Weekend fund flows may also drive gold price movements.
⭐️Set Gold Price:
🔥Sell Gold Area: 3360-3369 SL 3374
TP1: $3355
TP2: $3342
TP3: $3325
⭐️ Note: Labaron hopes that traders can properly manage their funds
- Choose a lot size that matches your funds
The weekend closed higher to around 3360
📌 Driving Events
Gold prices (XAU/USD) were on track to rise for the third consecutive day on Friday, climbing to the upper limit of this week's trading range as escalating trade tensions fueled safe-haven demand. Amid a significant intensification of global trade disputes, U.S. President Donald Trump this week sent formal notices to multiple trading partners detailing individual tariff rates that will take effect on August 1 if no agreement is reached. This has disrupted investor sentiment, weighed on risk assets, and provided solid support for gold.
Meanwhile, expectations of an imminent rate cut by the Federal Reserve (Fed) have cooled after last week's strong U.S. jobs data. As a result, the U.S. dollar (USD) remained firm, holding near more than two-week highs set on Thursday. A stronger dollar could limit upside for the non-yielding gold in the short term. Therefore, traders could look for a sustained breakout before going further bullish on the XAU/USD pair.
📊Personal comments:
Gold price broke through 3330, maintained good buying pressure, and rebounded over the weekend
⭐️Set gold price:
🔥Sell gold area: 3367-3369 SL 3374
TP1: $3355
TP2: $3342
TP3: $3325
🔥Buy gold area: $3306-$3308 SL $3301
TP1: $3315
TP2: $3325
TP3: $3338
⭐️ Note: Labaron hopes that traders can properly manage their funds
- Choose a lot size that matches your funds
7/9: Focus on Selling Gold on ReboundsGood evening, everyone!
Apologies for the late update today—I had some matters to attend to. I hope your trades are going smoothly.
Yesterday, gold found support around 3284 and continued to rebound during today’s session, reaching as high as 3330. The key resistance at 3321 has now been broken and is currently acting as a short-term support level. However, based on the current price structure, this level is likely to be retested multiple times, and some consolidation may follow.
The next major resistance lies between 3337 and 3343. In the absence of strong bullish momentum, the preferred short-term strategy remains selling on rebounds, especially near resistance zones.
⚠️ Additionally, the U.S. Initial Jobless Claims data will be released during the New York session tonight, which may cause increased volatility and potentially whipsaw price action. Be cautious with position sizing, and avoid emotional trades or chasing price action during news releases. Patience and discipline will be key.
XAUUSD:Stay long
Today's Shock Trading strategy:
Day traders can buy long positions at 3318-23 with a target range of 3340-45
Median traders please refer to the previous thinking unchanged.
More detailed strategies and trading will be notified here ↗↗↗
Keep updated, come to "get" ↗↗↗
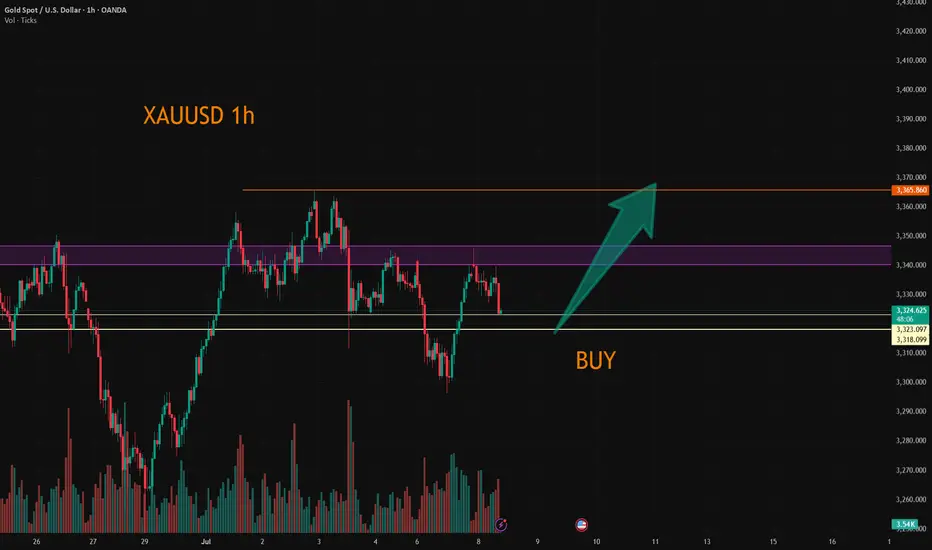
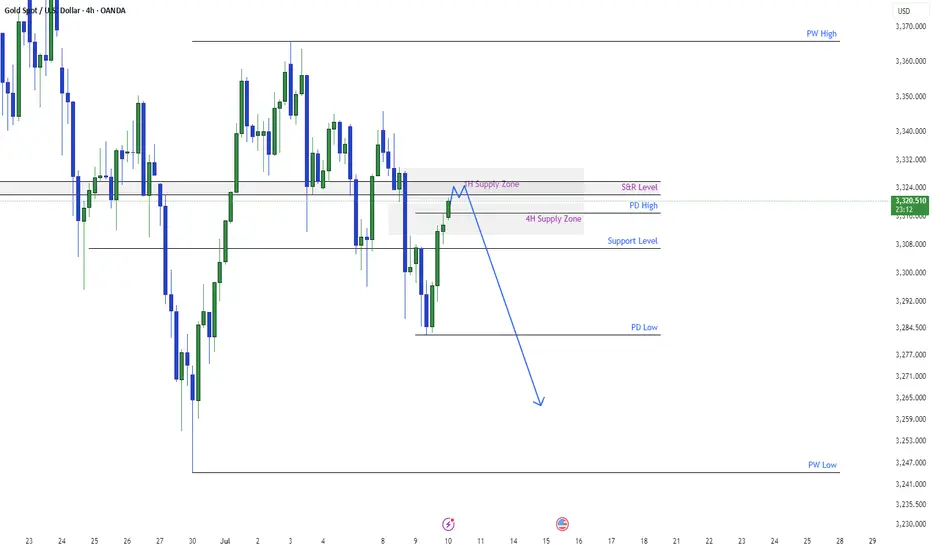
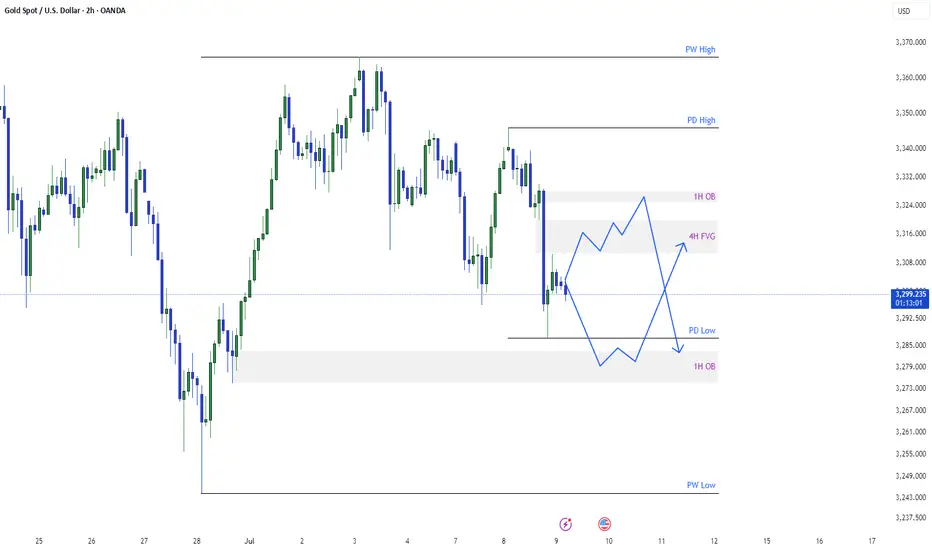
XAUUSD Reaching Supply ZoneXAUUSD is reaching a supply zone. There resides a good S&R level. We can expect gold to hit supply zone and follow the sell trend again. The strength of the gold is saying the same. The other possibility might be gold may break S&R level and go higher. Sellers are in stronger position and we may see higher probability percentage for sell.
Gold Recovery Trade As gold moved around 500 pips on last day. The pull back seems good and this trade's possibility will be good and a good Risk Reward ratio. Keep your risk small if you want to take the trade. This isn't an investment advice this is a probability analysis. Which according to market structure seems good.
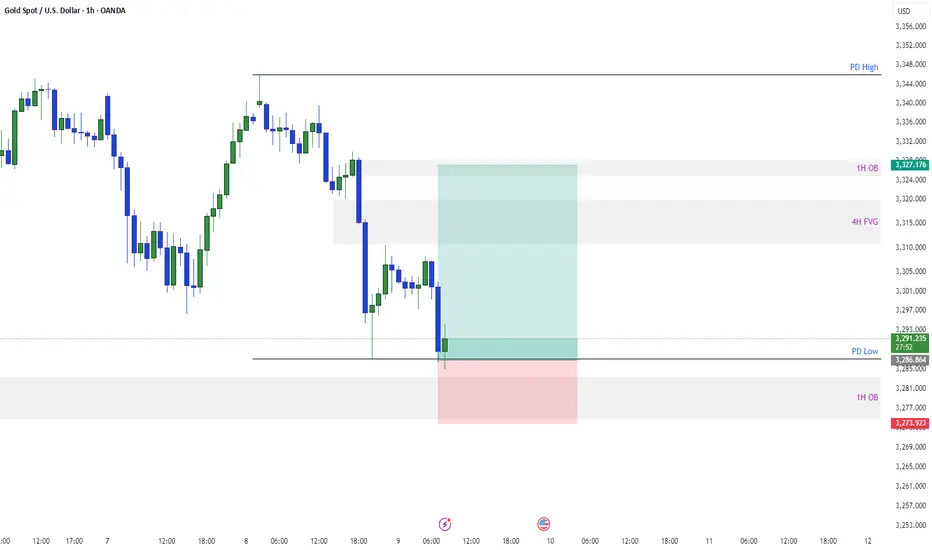
Gold Wants to Go lowerSee my previous analysis for gold I described I will take the low and has taken already. now the daily candle shown good sell. today there are two possibilities. Either gold will have pullback or will go further in sell. I have given both possibilities in my analysis.
For Pull Back: It may take the previous day low and then retraces back to 4 hour FVG or to the order block residing at 3324.
For Further sell : It may pull back to 4 hour FVG and then goes back to take previous day low.
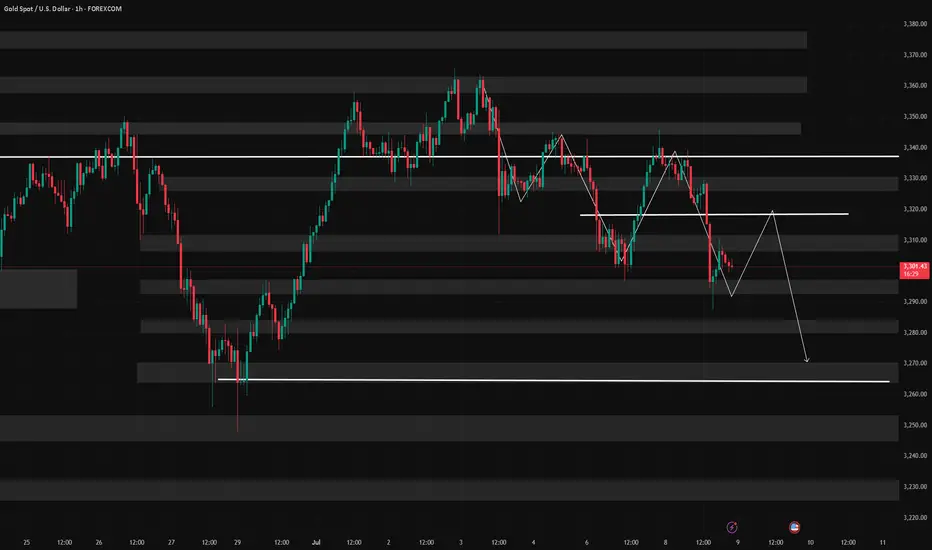
7/9: Failure to Break Above 3321 May Lead to a Drop Toward 3220Good morning, everyone!
Yesterday, gold tested support and attempted a rebound but failed to break through resistance, followed by a second leg down that broke the support zone, invalidating the potential inverse head-and-shoulders pattern and resulting in a drop below the 3300 level.
On the daily (1D) chart, price has now broken below the MA60, signaling a further confirmation of the bearish structure.
However, due to the sharp drop, a double bottom or multi-bottom structure is forming on the 30-minute chart, which may be building momentum for a potential test of the 3321 resistance zone.
📌 Key focus areas:
If 3321 is broken and held, there is room for a short-term rebound to extend;
If 3321 holds as resistance, the current rebound is likely a short-selling opportunity.
Technically speaking, without the support of bullish news, if gold fails to reclaim and sustain above 3321, there is a strong chance of a further move lower—potentially down to 3220, where the weekly MA20 is located. A deeper decline could even test the 3200–3168 support zone.
📉 Therefore, the primary trading bias remains bearish, with sell-on-rebound as the preferred strategy until a stronger bullish signal emerges. Monitor the 3321 zone closely for direction confirmation.
Bearish pressure below 3,300 at the start of the week
📌 Driving Events
Gold prices (XAU/USD) faced renewed selling pressure in early Asian trading on Monday, falling to the $3,320 level. Gold's pullback came as stronger-than-expected U.S. nonfarm payrolls data for June reshaped market expectations for the Federal Reserve's (Fed) policy path. Investors are now turning their attention to the Federal Open Market Committee minutes, which will be released on Wednesday, for further guidance.
The U.S. added 147,000 jobs in June, better than expected and slightly higher than the revised 144,000 in May. Meanwhile, the unemployment rate remained stable at 4.1%. These data reinforce the view that the labor market remains resilient, reducing the likelihood of an imminent rate cut by the Federal Reserve. As a result, the U.S. dollar strengthened, weighing on non-yielding assets such as gold.
📊Comment Analysis
The decline at the beginning of the week, gold prices give up accumulation below 3300
💰Strategy Package
⭐️Set gold price:
🔥Sell gold area: 3337-3339 SL 3344
TP1: $3328
TP2: $3312
TP3: $3300
🔥Buy gold area: $3297-$3295 SL $3290
TP1: $3308
TP2: $3320
TP3: $3330
⭐️ Note: Labaron hopes that traders can properly manage their funds
- Choose the number of lots that matches your funds
- Profit is 4-7% of the fund account
- Stop loss is 1-3% of the fund account