Buy Gold! The short-term bottom may have appeared!Gold continued to retreat yesterday and hit a recent low, reaching around 3287. Then gold gradually rebounded to above 3300. Relatively speaking, the rebound momentum was weak. It is expected that the long and short sides will fight fiercely around 3300. However, from the recent characteristics of gold operation, it can be seen that although the short position of gold is strong, it is difficult to continue in the short term, and I think the short-term decline of gold is basically in place, so at this stage, in terms of short-term trading, I do not advocate shorting gold directly;
As gold did not continue to fall after reaching around 3287, on the contrary, it gradually rebounded to above 3300, which may strengthen the market's consensus on the short-term bottom, thereby attracting the favor of off-site funds; from the current gold structure, if gold can maintain above 3300-3295, it may be combined with the 3287 low to build a "W" double bottom structure, which is conducive to supporting the rebound of gold.
However, as gold fell below 3300 again, the bearish trend is relatively strong, so we need to moderately lower our expectations for a gold rebound. In the short term, gold is under pressure in the 3315-3325 area, so we can temporarily look to this area for the rebound target. Therefore, in short-term trading, I do not advocate shorting gold directly, and you can first consider going long on gold in the 3300-3295 area, TP: 3310-3320-3330.
Xauusdupdates
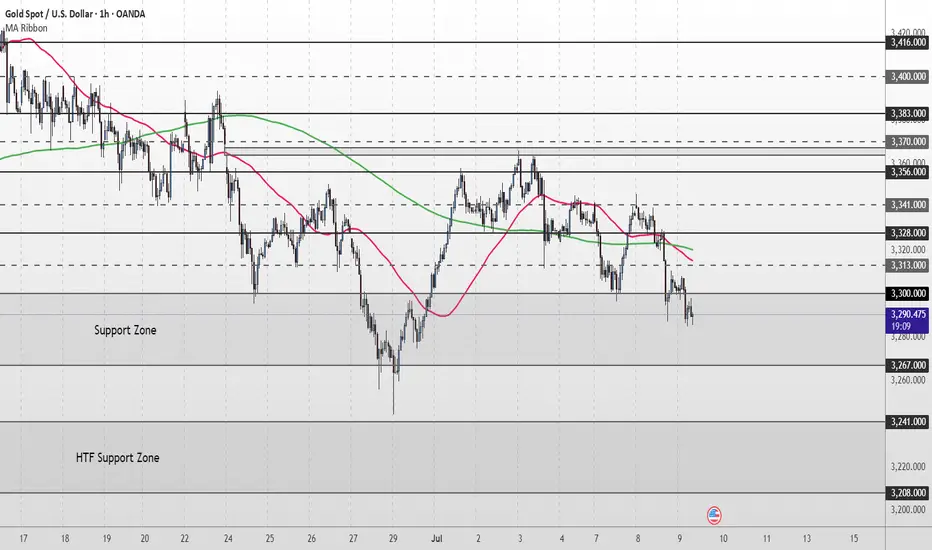
Gold Short Term OutlookYesterday, price failed to break above the minor resistance at $3,341, which led to a sharp sell-off into the Support Zone. The 50MA has now crossed below the 200MA, reinforcing the short-term bearish momentum.
If the Support Zone fails to hold, we could see a move toward the HTF Support Zone, with downside targets at $3,241 and $3,208.
Any short-term recovery may face resistance at $3,300–$3,328. For a more meaningful shift in sentiment, bulls must reclaim $3,328 to open the path back toward higher levels.
📌 Key Levels to Watch
Resistance:
$3,300 ‣ $3,313 ‣ $3,328 ‣ $3,341
Support: $3,267 ‣ $3,241 ‣ $3,208
🔎 Fundamental Focus
Markets are positioning ahead of Wednesday’s FOMC Meeting Minutes, which could give insights into the Fed’s internal sentiment on rate cuts.
⚠️ Stay sharp — manage your risk.
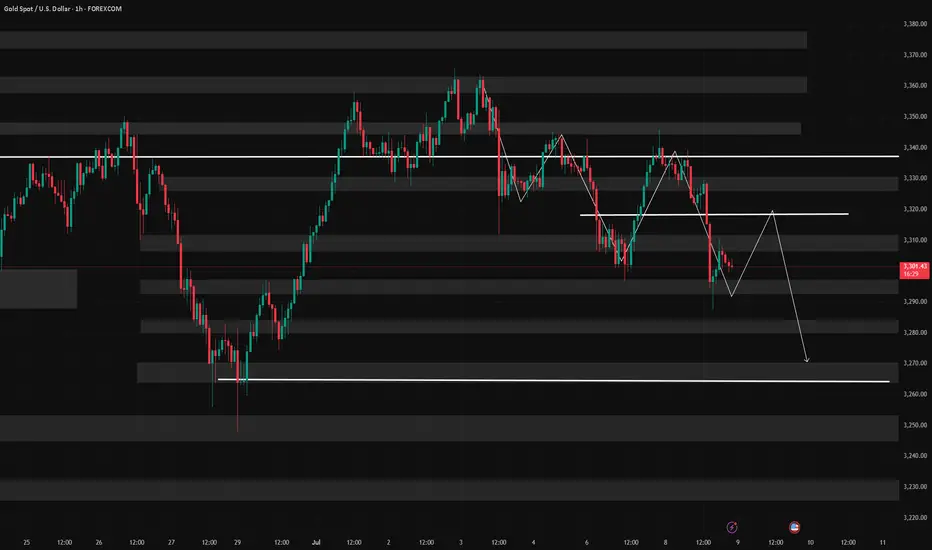
No Bullish Confirmation – Targeting 3250 on XAU/USDIn yesterday’s analysis, I mentioned that due to Monday’s daily Pin Bar, I closed my short trade on Gold around break-even and decided to wait for more confirmation.
Unfortunately, that wasn't the best decision. The price failed to break above resistance for a bullish continuation and instead dropped sharply, closing the day exactly at the 3300 figure. At the time of writing, Gold is trading even lower at 3293, after briefly rebounding from the 3285 support zone—a level I’ve highlighted in the past.
Moving forward, after the failed bullish continuation and yesterday’s bearish move, it’s clear that bears are back in control. A drop toward the 3250 zone is now on the table.
Conclusion: I’m looking to sell rallies, with my invalidation zone set above 3340, aiming for a good risk-to-reward setup.
Disclosure: I am part of TradeNation's Influencer program and receive a monthly fee for using their TradingView charts in my analyses and educational articles.

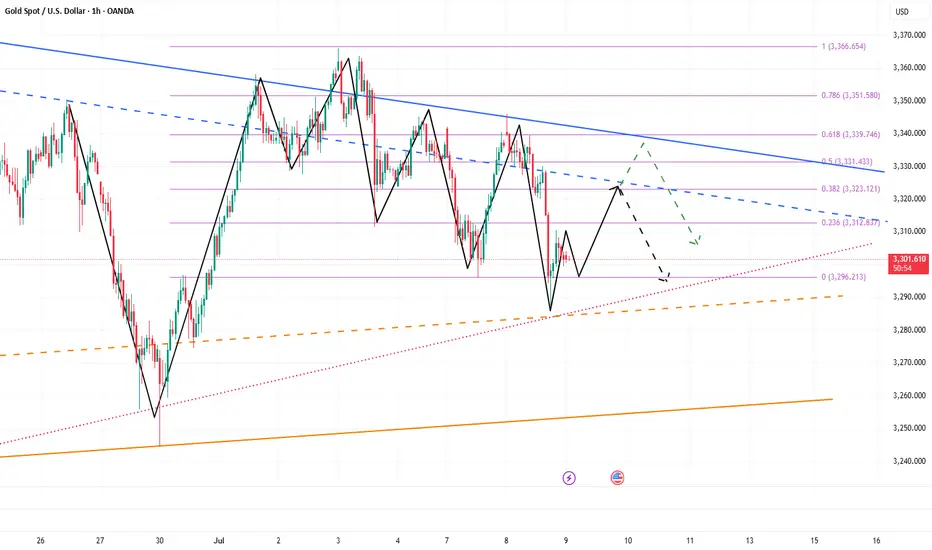
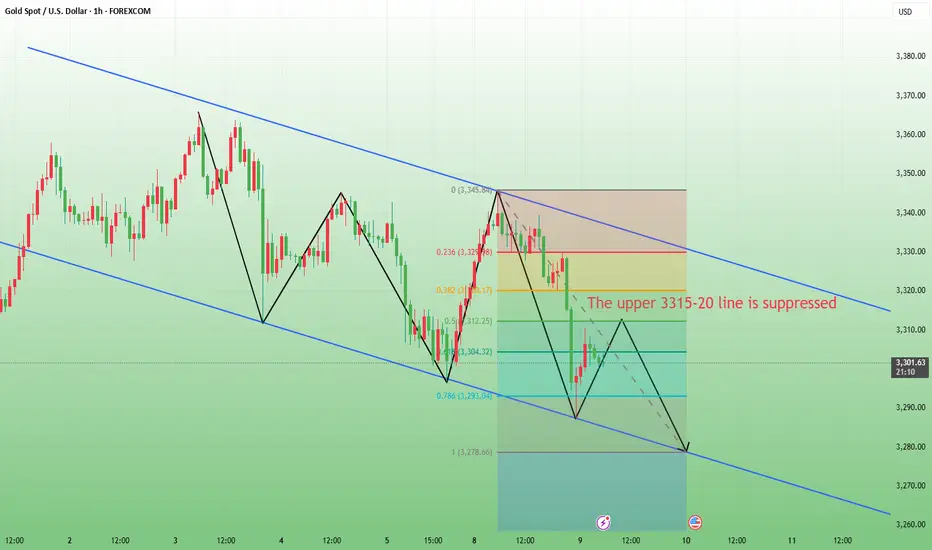
Elliott Wave Analysis – XAUUSD July 9, 2025
🔻 Momentum Analysis
D1 timeframe: Momentum is approaching the oversold zone and may reverse upwards today or tomorrow.
H4 timeframe: Momentum is already in the oversold zone. The two momentum lines are converging, signaling weakening downward pressure and a potential reversal.
🌀 Elliott Wave Structure
The price level around 3318 (previous buy zone) failed to hold, despite a ~100-pip bounce before continuing to decline.
Currently, price is nearing the lower boundary of a contracting triangle – a typical abcde corrective pattern.
Based on the current wave structure:
- Wave d (purple) appears to be complete.
- Price is now likely forming wave e, expected to end near 3279, which coincides with the triangle’s bottom support.
If the pattern holds, a strong breakout above the upper triangle boundary is expected once wave e completes.
However, note: the formation of a triangle during a corrective wave often signals that the uptrend is nearing its end in the longer term.
📌 Trading Plan
Given the complex 3-wave structure typical of triangles, risk is elevated, so:
Trade with reduced position size, or
Preferably wait for a confirmed breakout above the triangle before entering.
Suggested Trade Setup:
✅ Buy Zone: 3280 – 3277
❌ Stop Loss: 3270
🎯 Take Profits:
TP1: 3309
TP2: 3342
TP3: 3390
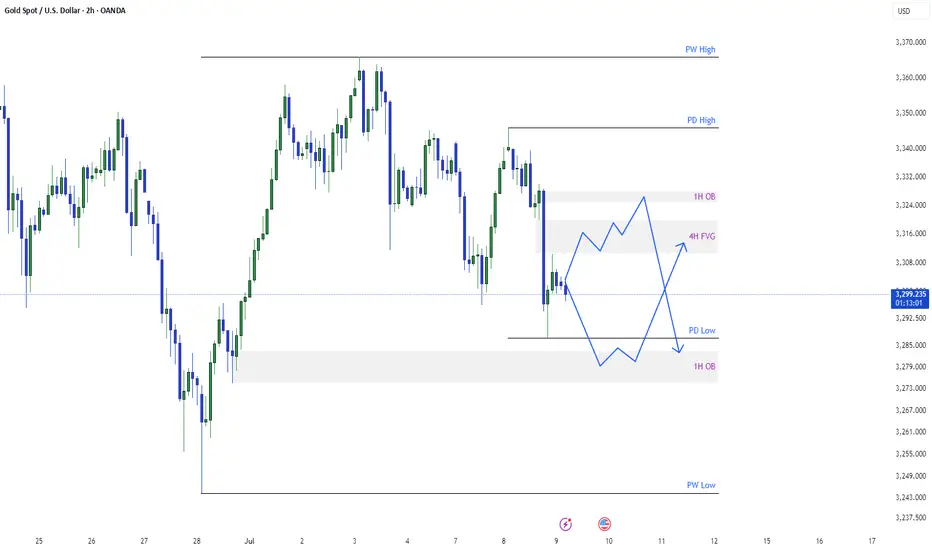
Gold Wants to Go lowerSee my previous analysis for gold I described I will take the low and has taken already. now the daily candle shown good sell. today there are two possibilities. Either gold will have pullback or will go further in sell. I have given both possibilities in my analysis.
For Pull Back: It may take the previous day low and then retraces back to 4 hour FVG or to the order block residing at 3324.
For Further sell : It may pull back to 4 hour FVG and then goes back to take previous day low.
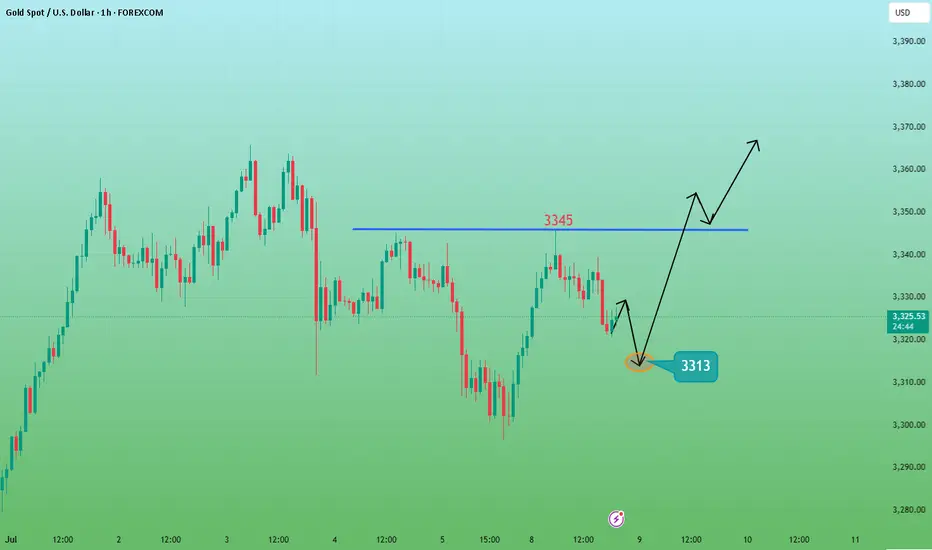
7/9: Failure to Break Above 3321 May Lead to a Drop Toward 3220Good morning, everyone!
Yesterday, gold tested support and attempted a rebound but failed to break through resistance, followed by a second leg down that broke the support zone, invalidating the potential inverse head-and-shoulders pattern and resulting in a drop below the 3300 level.
On the daily (1D) chart, price has now broken below the MA60, signaling a further confirmation of the bearish structure.
However, due to the sharp drop, a double bottom or multi-bottom structure is forming on the 30-minute chart, which may be building momentum for a potential test of the 3321 resistance zone.
📌 Key focus areas:
If 3321 is broken and held, there is room for a short-term rebound to extend;
If 3321 holds as resistance, the current rebound is likely a short-selling opportunity.
Technically speaking, without the support of bullish news, if gold fails to reclaim and sustain above 3321, there is a strong chance of a further move lower—potentially down to 3220, where the weekly MA20 is located. A deeper decline could even test the 3200–3168 support zone.
📉 Therefore, the primary trading bias remains bearish, with sell-on-rebound as the preferred strategy until a stronger bullish signal emerges. Monitor the 3321 zone closely for direction confirmation.
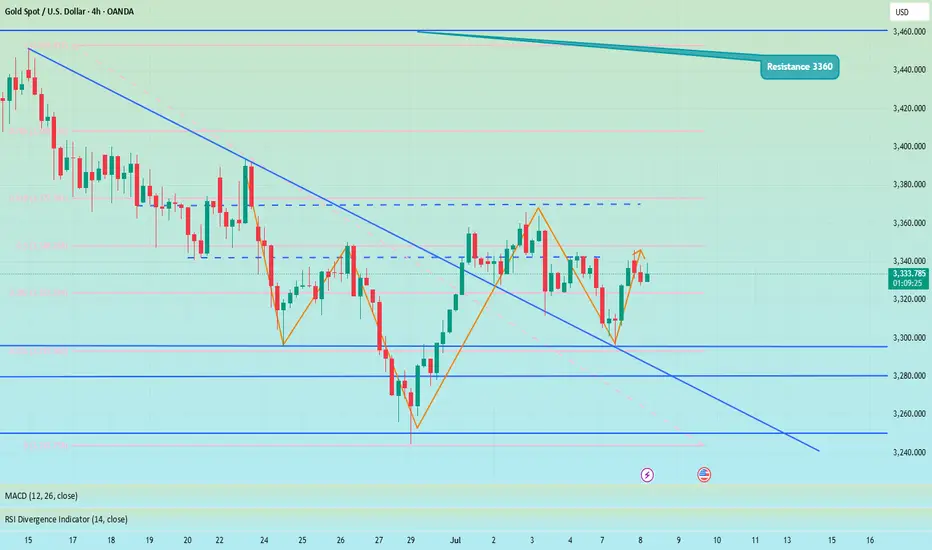
Will gold continue to rise if it accelerates its decline?Technically, we need to focus on the key support of 3260 and the strong resistance range of 3320 above. The hourly chart shows that the short-term moving average diverges downward, and the K-line is under pressure, showing short-term fatigue, suggesting that there is still a need for a correction. The current long-short watershed is at the 3390 mark. If the gold price cannot effectively break through and stand above 3315, the short-term rebound can be regarded as a good opportunity to enter a short position. The 4-hour chart shows that the gold price has received support after touching 3287 and slowly repaired the decline, but it is still in a volatile pattern in the near future. Although the 3287 support is effective, the oscillation range has not been broken. The future direction needs to pay attention to the actual defense strength of the 3260 support level and the direction of the range break. The operation suggestion on Wednesday is to rebound high as the dominant strategy. The upper resistance area focuses on the 3315-3320 range, where short positions can be arranged. The downward targets are 3270 and the key support level 3260. If 3260 is effectively broken, it may open up a larger downward space.
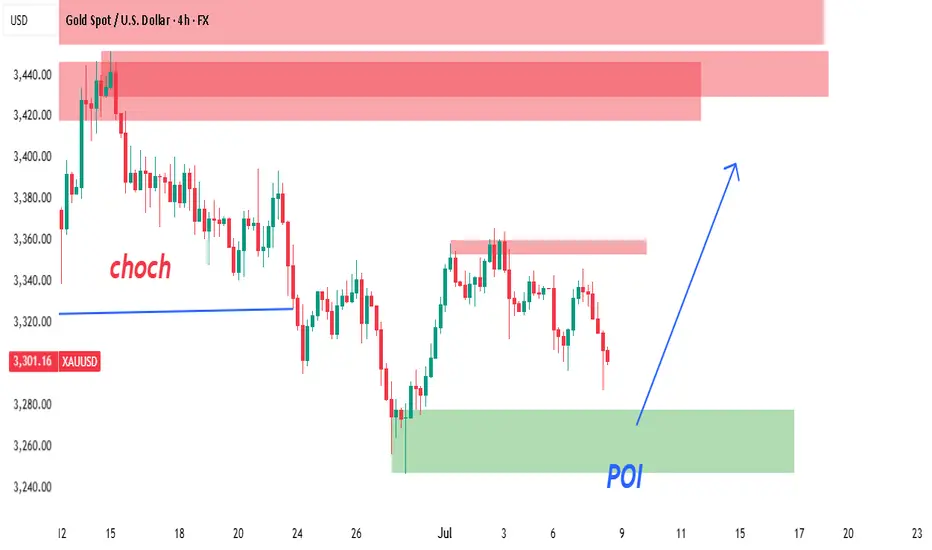
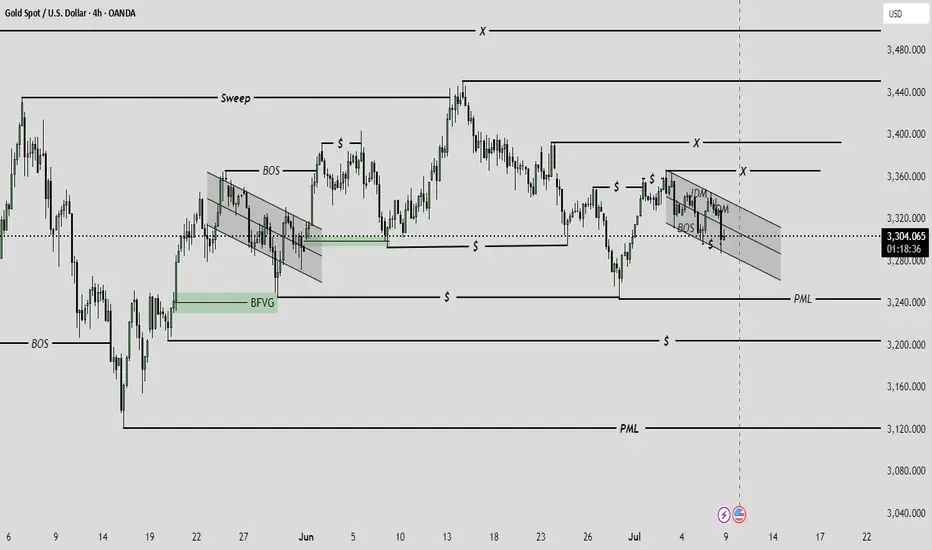
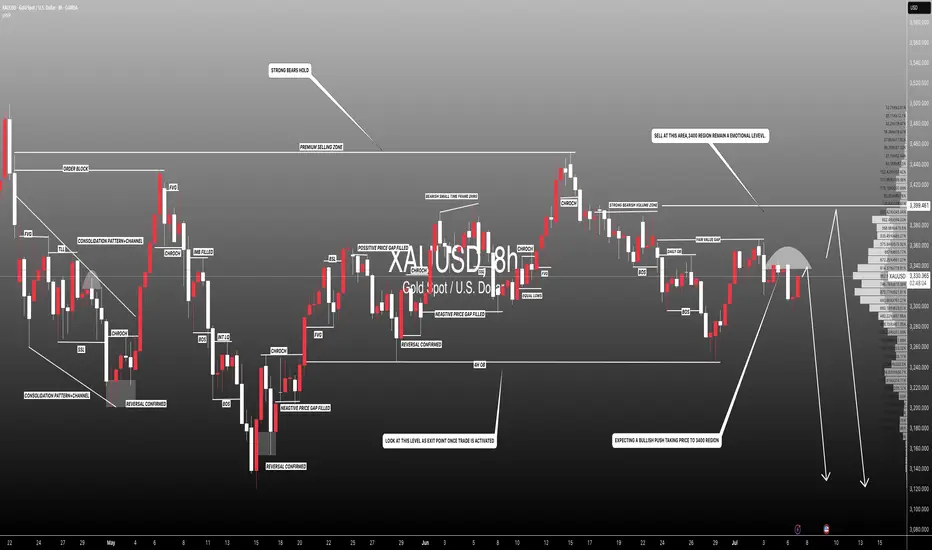
XAUUSD 4H – Smart Money Concept (SMC) SetupPrice action on the 4H chart shows a confirmed Change of Character (CHoCH) at the 3,320 level, marking a shift from a bearish trend into potential bullish order flow. This CHoCH is supported by a strong break of internal structure followed by a pullback.
🧠 Smart Money Insight:
CHoCH Zone (Break of Structure): Price broke the previous lower high, confirming possible bullish intent.
POI (Point of Interest): A refined 4H demand zone sits between 3,280–3,310, aligning with a previous accumulation area. Price is currently approaching this zone with decreasing momentum (potential liquidity sweep below minor lows).
Liquidity Grab: Several equal lows were formed before the POI — prime setup for a liquidity sweep before a bullish push.
Refined Entry Zone: Based on candle wicks and order block imbalance.
🎯 Trade Idea:
🟢 Entry: Wait for bullish reaction or confirmation inside the POI zone (3,295–3,305)
🎯 Target Zones:
TP1: 3,380 (reaction level)
TP2: 3,420–3,440 (major supply zone + inefficiency)
🛡️ Stop Loss: Below 3,270 (invalidates demand zone and structure)
📈 Bias: Bullish unless POI fails
🔍 Confluences:
✅ 4H CHoCH Confirmed
✅ Price approaching refined demand zone
✅ Liquidity resting below recent lows
✅ Previous imbalance not yet filled
✅ Clean supply zone overhead (TP target)
💬 Conclusion:
This is a clean SMC-based long setup. We are waiting for price to tap into demand and show bullish intent before entry. Strong probability of reversal into premium pricing zone if structure holds.
📍Drop a like if you caught this setup or save it to monitor the reaction!
Gold long term analysis #xauusd it is obvious that gold is pushing down side as we have close monthly bearish, and it working in channel which is reputed in past time
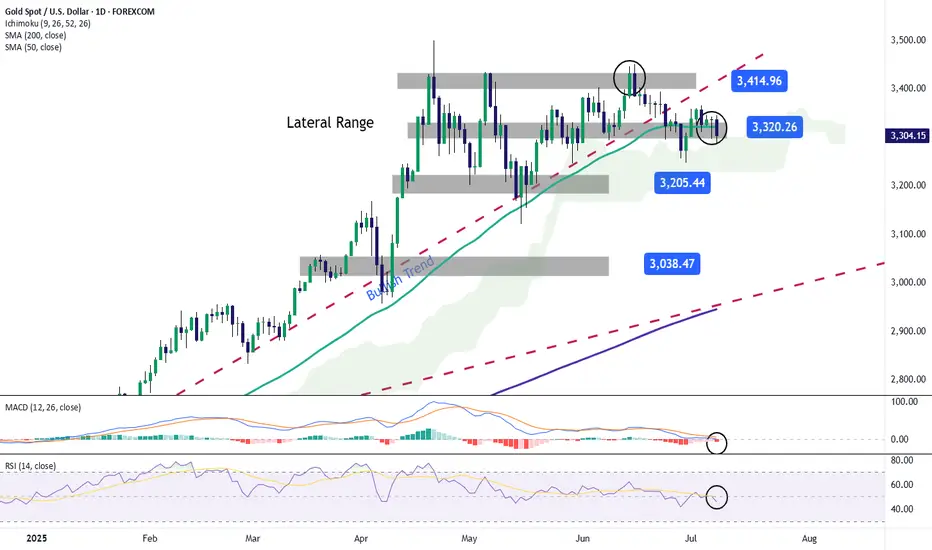
Gold Returns to the $3,300 per Ounce ZoneOver the past two trading sessions, gold has depreciated more than 1.5%, as a consistent bearish bias begins to emerge in price action. For now, selling pressure has remained steady, supported by a temporary decline in global economic uncertainty and a recent rebound in U.S. dollar strength, factors that have led gold’s upward momentum to steadily weaken.
Lateral Range Remains Intact
Recent price action in gold has defined a well-established sideways channel, with resistance near $3,400 and support around $3,200 per ounce. So far, price movement has been insufficient to break out of this range, making it the most relevant technical structure to monitor in the short term. As long as price remains within these boundaries, neutrality may continue to dominate.
Technical Indicators
MACD: The MACD indicator continues to oscillate near the neutral zero line, signaling that momentum from moving averages remains balanced. If this pattern persists, the sideways range could extend further.
RSI: A similar pattern is unfolding with the RSI, which is hovering around the 50 level, indicating a constant balance between buying and selling pressure. Sustained moves at this level could reinforce short-term price neutrality.
Key Levels to Watch:
$3,400 per ounce: This historical high acts as the most significant resistance in the short term. A breakout above this level could trigger a stronger bullish bias and revive the upward trend stalled in recent weeks.
$3,300 per ounce: The current level aligns with the 50-period simple moving average. Price movement around this zone could extend market neutrality.
$3,200 per ounce: A key support level and recent low. A retest of this area could trigger a more decisive bearish bias in the short term.
Written by Julian Pineda, CFA – Market Analyst
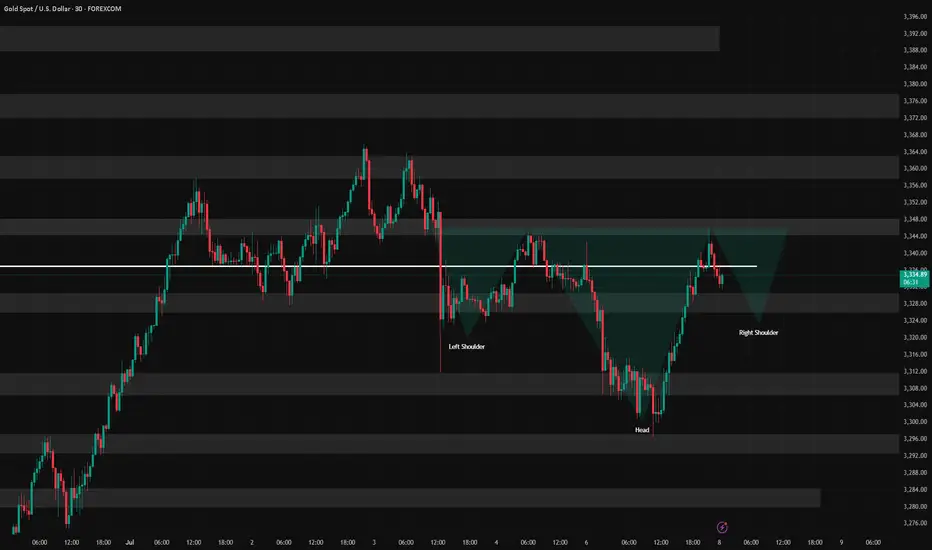
7/8: Inverse Head and Shoulders Pattern, Support at 3321–3312Good morning, everyone!
Yesterday, gold broke below the 3321 support during the session, dropped to around 3296, then staged a strong rebound back toward the opening price—forming a classic deep V-shaped reversal and regaining support above the MA60 on the daily chart.
The market remains in a consolidation phase between the MA20 and MA60 on the 1D chart, with no clear directional breakout yet.
On the 30-minute chart, the previous head-and-shoulders top pattern has been completed with the recent decline. The current structure can be tentatively viewed as the formation of a head-and-shoulders bottom.
If this bullish reversal pattern holds:
The 3321 level must act as valid support during any pullback; deeper confirmation may come from 3312, which corresponds to the previous left shoulder low. Although this was partially driven by a data-related spike, most candle bodies remained around 3321—so 3321 is the primary support, and 3312 is the backup.
If confirmed, the price may advance toward the 3360 target zone.
If the pattern fails, watch for the development of a double bottom formation, with MA60 on the daily chart remaining a key support level.
📌 For today, focus on trading within the 3312–3352 range, using a buy-low/sell-high approach, and stay flexible in response to evolving chart patterns.
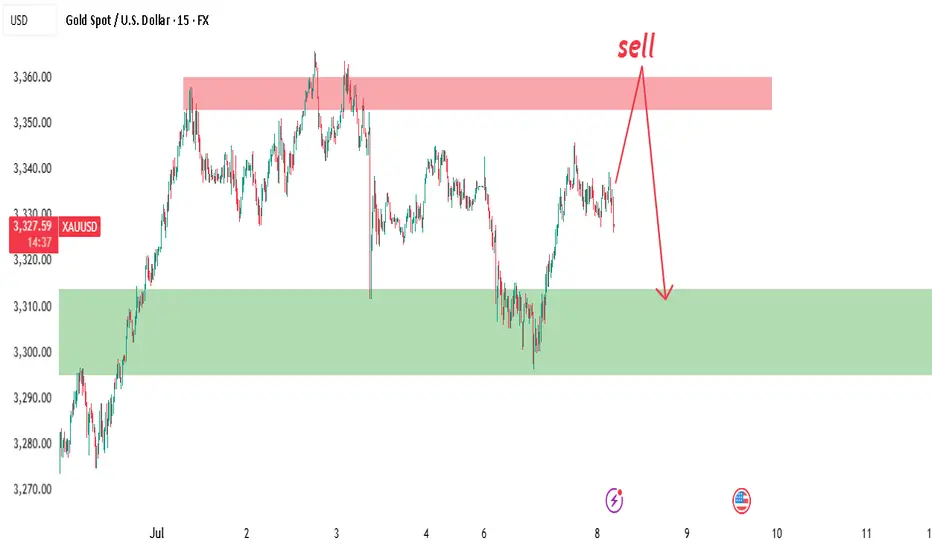
XAUUSD 15M Smart Money Sell SetupGold is showing classic Smart Money Concepts (SMC) behavior with liquidity engineering and premium mitigation.
🧠 SMC Breakdown:
Price swept buy-side liquidity above 3,355 and failed to close above the zone.
Supply zone (red) at 3,350–3,360 was previously unmitigated and now tapped.
Clean mitigation candle formed inside the supply with a sharp rejection.
Sell pressure expected from institutions looking to fill short positions after engineered liquidity.
📌 Sell Idea:
We anticipate a bearish reaction from the 3,350–3,360 zone down to the demand area.
🎯 Trade Plan:
📍 Entry Zone: 3,350–3,360 (inside red supply zone)
🛑 SL: 3,365 (above the liquidity wick)
✅ TP: 3,300 zone (green demand block)
📊 Why This Trade?
Structure is bearish from higher timeframes.
This is a sell in premium after liquidity sweep.
Imbalance left behind during the move up still unfilled.
Expecting internal CHoCH on M1/M5 to confirm entry.
🧲 Liquidity Map:
Engineered highs above 3,355 swept.
Clean equal lows sitting at 3,300 – perfect magnet for price.
⚠️ Note: Patience is key. Let price come into your zone and show a reaction before entering.
#XAUUSD #SmartMoneyConcepts #SupplyAndDemand #GoldSellSetup #SMC #TradingView #InstitutionalTrading #LiquiditySweep #PriceAction #Forex
Short-term gold bulls and bears are anxious,3330 becomes the keyAt present, the market has been fluctuating narrowly in the range of 3330-3320, and both bulls and bears are in a stalemate. However, gold has formed a double-layer head and shoulders bottom pattern, so the short-term bullish trend is definitely unchanged. In the previous post, I also mentioned that if the rebound in the European session is weak and gold continues to be below 3345, then the short-term NY session may usher in a retracement and a second bottom. Therefore, I still hold a long order of 3325-3315, and temporarily modify the TP to the 3335 line. I expect that there may be a retracement here, but there may also be a direct retracement. No matter what the situation is, we need to stabilize before entering the market.
In addition to investment, life also includes poetry, distant places, and Allen. Facing the market is actually facing yourself, correcting your shortcomings, facing your mistakes, and exercising strict self-discipline. I share free trading strategies and analysis ideas every day for reference by brothers. I hope my analysis can help you.
PEPPERSTONE:XAUUSD FOREXCOM:XAUUSD FX:XAUUSD FXOPEN:XAUUSD OANDA:XAUUSD TVC:GOLD
How to solve the problem of order being trapped in a loop📊 Gold Day Trading Strategy (Recommendation index ⭐️⭐️⭐️⭐️⭐️)
📰 News information:
1. The lasting impact of new tariffs
2. The impact of geopolitical conflicts
3. The Fed’s interest rate cut
📈 Technical Analysis:
The recent market conditions have been volatile. Many brothers have reported that they have been trapped recently. They have just been released from short positions, but have fallen into the situation of being trapped by long orders again. I have also encountered such a situation recently. Brothers who follow me must know that I have been trapped, but in the process of being trapped, I still share my trading ideas for the brothers who are trapped to check, so that we can all get out of the trap.
Gold fell as expected and hit the lowest point of 3287 before rebounding. The current 3300-3290 range given at the bottom has certain support. At present, I have answered it. As long as it does not fall below 3285, we can still go long and look for rebound correction. TP can temporarily look at 3305-3310. At present, the short-term upper watershed is near the 3321 line. As time goes by, the medium-term point can be seen at 3345. Only when the price stands above 3345 can the upward momentum continue to touch the 3380 line, or even 3400. In the short term, you can go long if you look at the support below. In the short term, pay attention to the resistance above 3315-3320. If it encounters resistance under pressure, it will fall back. On the contrary, after breaking through the first level of resistance, the upward trend will continue.
🎯 Trading Points:
BUY 3300-3290-3285
TP 3305-3315-3320-3345
SELL 3315-3321
TP 3300-3290
In addition to investment, life also includes poetry, distant places, and Allen. Facing the market is actually facing yourself, correcting your shortcomings, facing your mistakes, and exercising strict self-discipline. I share free trading strategies and analysis ideas every day for reference by brothers. I hope my analysis can help you.
TVC:GOLD OANDA:XAUUSD FXOPEN:XAUUSD FX:XAUUSD FOREXCOM:XAUUSD PEPPERSTONE:XAUUSD

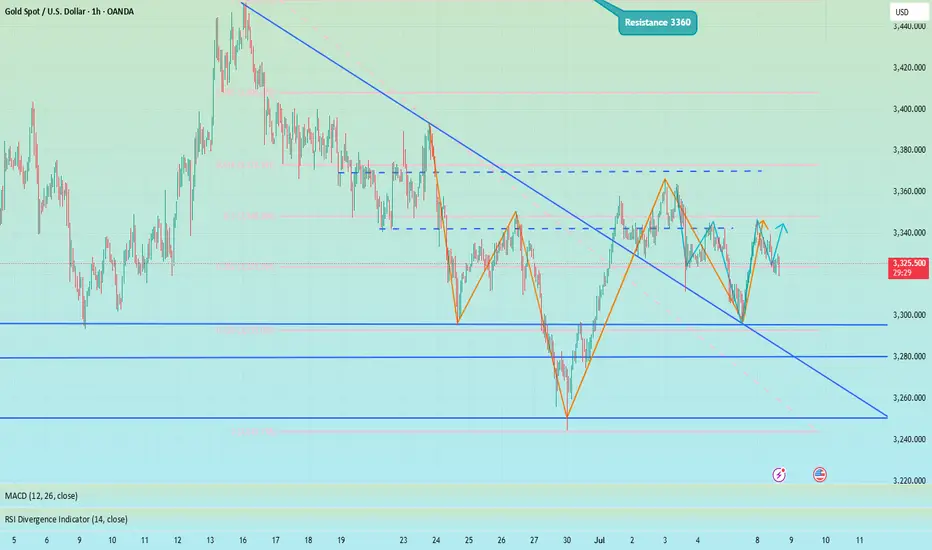
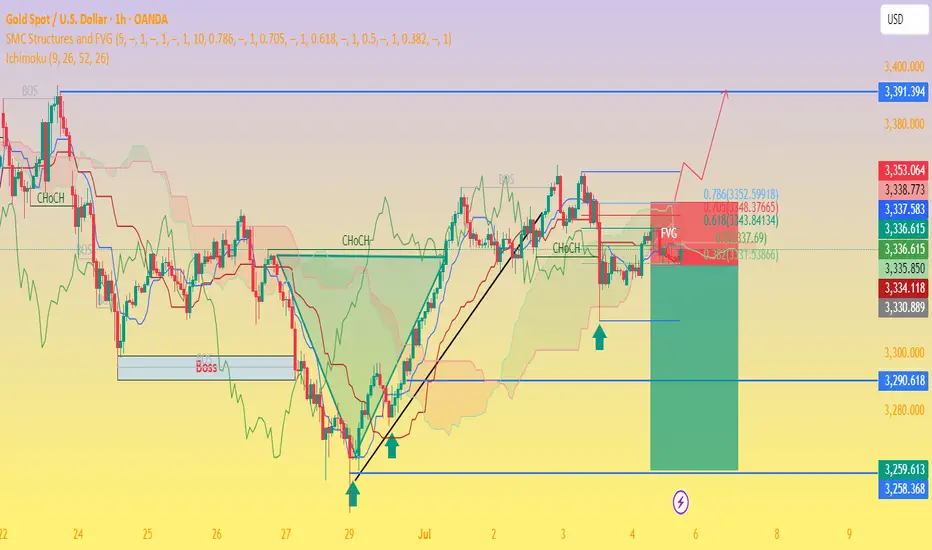
Gold Price Setup: Bullish Continuation or Rejection? 🧠 Chart Analysis (XAU/USD – 1H):
Key Structure Highlights:
CHoCH (Change of Character) zones marked both up and down indicate a battle between bulls and bears.
Recent bullish CHoCH followed by a fair value gap (FVG) retest suggests potential continuation to the upside.
Price recently bounced strongly from demand zone, shown by the green arrows and strong candle reaction.
Ichimoku Cloud:
Price is trying to break back above the Kumo (cloud), a sign of bullish momentum building.
However, resistance is still present with the Kijun and Tenkan lines converging.
FVG (Fair Value Gap):
The current price is attempting to fill and break above the FVG zone.
A successful breakout above this area confirms bullish intention.
Fibonacci Levels:
Price is hovering around the 0.5 - 0.618 retracement zone, often a strong reversal or continuation point.
Upside targets lie near the 0.786 retracement (3352) and ultimate target at 3391, a major resistance level.
Risk Management:
Trade setup shows an excellent Risk:Reward ratio.
Stop-loss placed just below the last structure low.
Potential downside to 3290–3258 if breakout fails.
🟢 Possible Next Move:
Bullish Scenario: If price clears the FVG and breaks above 3353, expect continuation to 3391.
Bearish Rejection: If rejected at FVG/0.618 level, watch for a drop back to 3290 or even 3259.
Gold is bullish and needs more momentum at 3320The buying pressure in the US session pushed the price up and formed a bullish hammer candle on D1. Today's bearish recovery is seen as a buying opportunity to head towards the uptrend again.
3344 is the immediate resistance zone in the European session that Gold faces. Breaking this resistance zone will head towards 3365. According to the wave structure, it would be great to have a retest of 3320 to find some buying momentum and then break 3344.
SUPPORT: 3320-3297
RESISTANCE: 3345-3352-3365
SELL Trigger: Break 3320 ( Trendline & break zone)
Do you have any comments on the trading plan? I would love to hear your views.

The shock continues, and the retracement continues to go long📊 Gold Day Trading Strategy (Recommendation index ⭐️⭐️⭐️⭐️⭐️)
📰 News information:
1. The lasting impact of new tariffs
2. The impact of geopolitical conflicts
3. The Fed’s interest rate cut
📈 Technical Analysis:
From the hourly chart, gold has formed a head and shoulders bottom. At present, 3320 below has formed a certain support in the short term. For now, the daily line still cannot close below 3320. If the daily line closes below 3320, the decline may open further. On the contrary, the current upper suppression position of gold is near 3350. If the daily line stands above 3350 again, it will be a bull-dominated trend and may test 3380-3390 above. In the short term, pay attention to the support line of 3325-3315 below. If it retreats to the support level, you can consider going long. Look to the resistance range of 3340-3350 above, and pay special attention to the suppression line of 3365-3370. At the same time, if the European session is always suppressed below 3345 and sideways, there is no performance, so you should consider selling it, and there may be further retreat in the evening.
🎯 Trading Points:
BUY 3330-3325-3315
TP 3340-3350-3365
In addition to investment, life also includes poetry, distant places, and Allen. Facing the market is actually facing yourself, correcting your shortcomings, facing your mistakes, and exercising strict self-discipline. I share free trading strategies and analysis ideas every day for reference by brothers. I hope my analysis can help you.
TVC:GOLD OANDA:XAUUSD FXOPEN:XAUUSD FX:XAUUSD FOREXCOM:XAUUSD PEPPERSTONE:XAUUSD
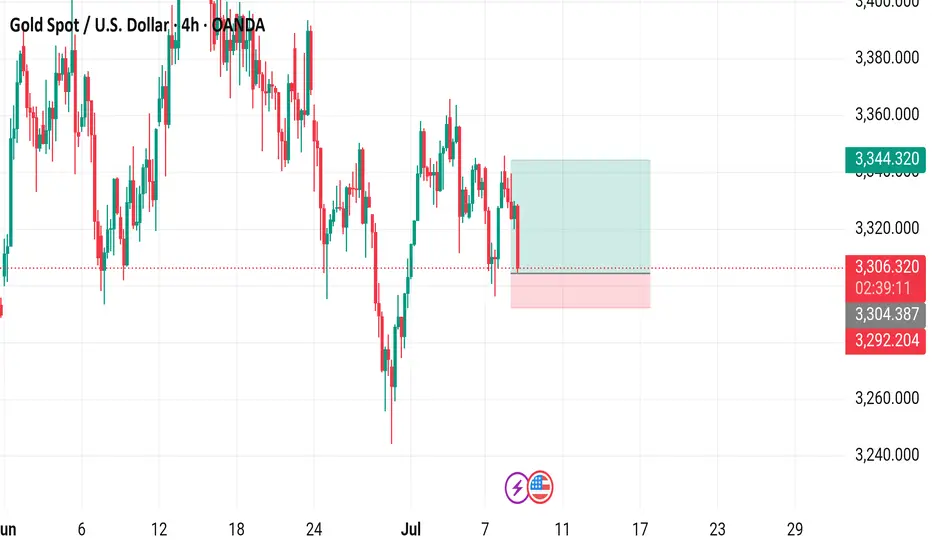
Gold Spot / U.S. Dollar (XAUUSD) 4-Hour Chart - OANDA4-hour chart from OANDA displays the price movement of Gold Spot (XAUUSD) against the U.S. Dollar. The current price is $3,805.780, reflecting a decrease of $30.660 (-0.92%). Key levels include a sell price of $3,305.390 and a buy price of $3,305.940. The chart highlights recent volatility with a shaded area indicating a potential support or resistance zone around $3,344.320. The time frame spans from late June to early July 2025, with the latest data point at 02:41:15 on July 8, 2025.
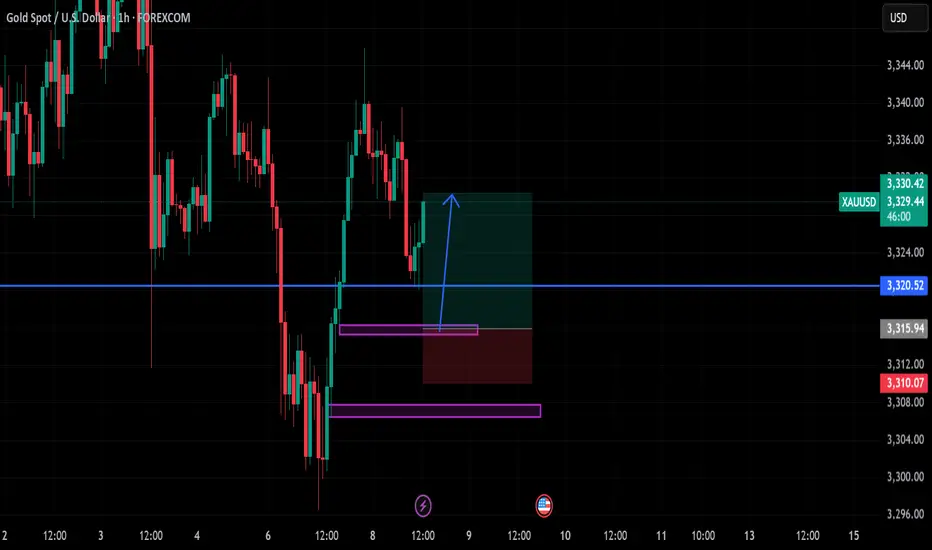
Setupsfx_ | XAUUSD(Gold):07/07/2025 Update | Gold dropped nicely when the market opened last night, dropping around 600 pips. However, it couldn’t hold on to the gains and came right back to the selling zone. There are two entry points and two potential targets.
Good luck and trade safely!
Team Setupsfx_
GOLD ON BUY FROM 3316#XAUUSD price we expect drop till 3316 for bullish range to form.
Buy limit 3316-3315.5, target 3330, stop loss 3310.
Below 3306 holds bearish continuation, target 3290-3280.
Bullish range can form above 3330 on 2 times breakout, target 3345
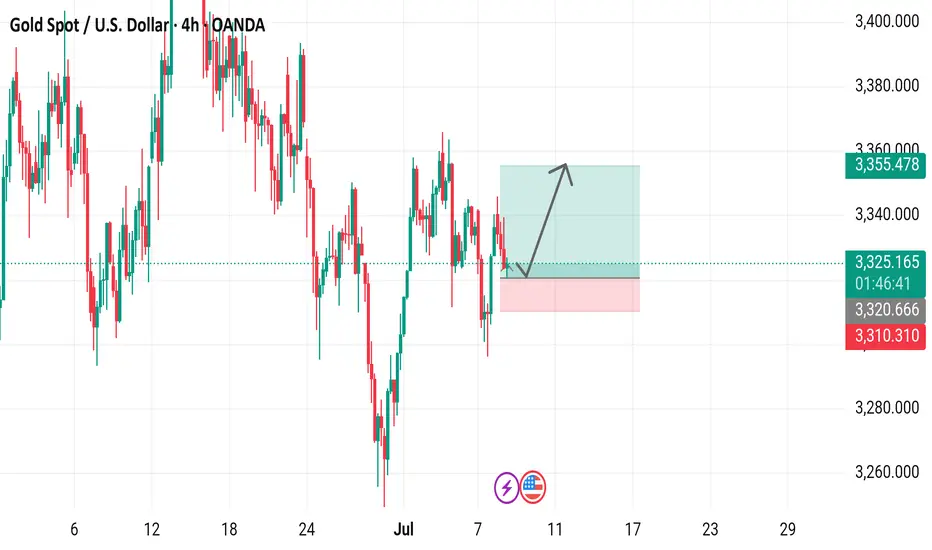
Gold is expected to regain bullish momentum and continue to 3360Yesterday, gold rebounded from 3296 and was able to reach around 3345. Although the process was rather painful, we have to admit that gold bulls still have the energy to wrestle with bears, and the gold market is not one-sidedly dominated by bears. As gold gradually tested and confirmed the effectiveness of support during the retracement process and then rebounded effectively, the short-term structure of gold gradually changed and began to favor bulls.
After gold hit bottom and rebounded yesterday, we can clearly see from the short-term structure that gold has successfully constructed a head and shoulders bottom structure in the three areas of 3295-3244-3296 in the short term, thus playing an absolute supporting role in the structure; and in the process of repeated testing of gold, there are signs of constructing a head and shoulders bottom structure in the three areas of 3310-3296-3325 locally again. Under the effect of the structural support resonance of the head and shoulders bottom, gold may not go below 3320 again, and may even regain the bullish trend and continue to the 3345-3355 area.
So I think there is a lot of profit potential in going long on gold. We can go long on gold with the 3330-3320 area as support and look towards the target area: 3340-3350-3360
Will gold continue to fall?Judging from the current trend of gold, it is weak in the early trading and continues to break lows in the European trading. Then there will be a second bottoming action in the US trading. Pay attention to the 3330 and 3335 areas for short selling before the US trading. Pay attention to the two support levels of 3318-3315 below. The market changes in real time, and it is recommended to operate in real time according to my prompts before the trading!
Gold Spot / U.S. Dollar (XAU/USD) 4-Hour Chart4-hour chart from OANDA displays the recent price movement of Gold Spot (XAU/USD) against the U.S. Dollar. The current price is $3,325.120, reflecting a decrease of $11.320 (-0.34%). The chart highlights a recent upward trend with a buy signal at $3,325.410 and a sell signal at $3,324.830, indicating a potential trading range. A shaded area suggests a possible price target or support/resistance zone around $3,355.478, with historical price levels marked on the right side. The timeframe covers the period around July 7-8, 2025.