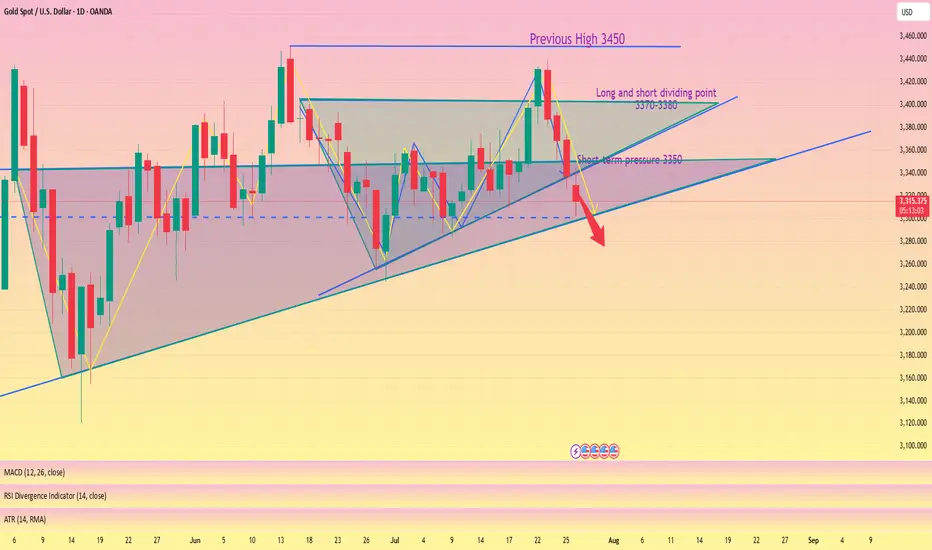
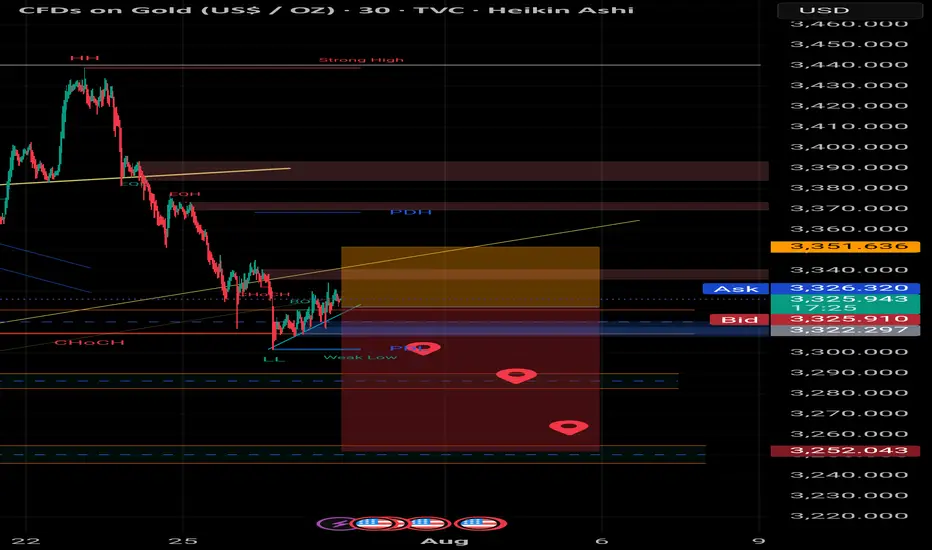
XAU/USD 30 July 2025 Intraday AnalysisH4 Analysis:
-> Swing: Bullish.
-> Internal: Bullish.
You will note that price has targeted weak internal high on three separate occasions which has now formed a triple top, this is a bearish reversal pattern and proving this zone is a strong supply level. This is in-line with HTF bearish pullback phase.
Remainder of analysis and bias remains the same as analysis dated 23 April 2025.
Price has now printed a bearish CHoCH according to my analysis yesterday.
Price is now trading within an established internal range.
Intraday Expectation:
Price to trade down to either discount of internal 50% EQ, or H4 demand zone before targeting weak internal high priced at 3,500.200.
Note:
The Federal Reserve’s sustained dovish stance, coupled with ongoing geopolitical uncertainties, is likely to prolong heightened volatility in the gold market. Given this elevated risk environment, traders should exercise caution and recalibrate risk management strategies to navigate potential price fluctuations effectively.
Additionally, gold pricing remains sensitive to broader macroeconomic developments, including policy decisions under President Trump. Shifts in geopolitical strategy and economic directives could further amplify uncertainty, contributing to market repricing dynamics.
H4: Chart:
M15 Analysis:
-> Swing: Bullish.
-> Internal: Bullish.
H4 Timeframe - Price has failed to target weak internal high, therefore, it would not be unrealistic if price printed a bearish iBOS.
The remainder of my analysis shall remain the same as analysis dated 13 June 2025, apart from target price.
As per my analysis dated 22 May 2025 whereby I mentioned price can be seen to be reacting at discount of 50% EQ on H4 timeframe, therefore, it is a viable alternative that price could potentially print a bullish iBOS on M15 timeframe despite internal structure being bearish.
Price has printed a bullish iBOS followed by a bearish CHoCH, which indicates, but does not confirm, bearish pullback phase initiation. I will however continue to monitor, with respect to depth of pullback.
Intraday Expectation:
Price to continue bearish, react at either M15 supply zone, or discount of 50% internal EQ before targeting weak internal high priced at 3,451.375.
Note:
Gold remains highly volatile amid the Federal Reserve's continued dovish stance, persistent and escalating geopolitical uncertainties. Traders should implement robust risk management strategies and remain vigilant, as price swings may become more pronounced in this elevated volatility environment.
Additionally, President Trump’s recent tariff announcements are expected to further amplify market turbulence, potentially triggering sharp price fluctuations and whipsaws.
M15 Chart:
Xauusdupdates
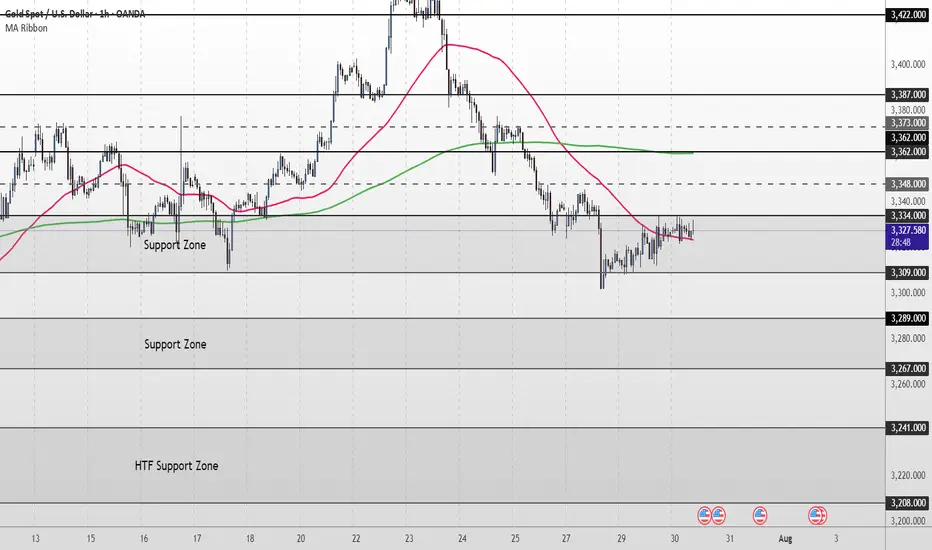
XAU/USD Intraday Plan | Support & Resistance to WatchGold remains in a bearish structure, consolidating in a narrow range after the sharp drop earlier this week. Price is trading around 3,330, testing the 3,334 resistance zone while still below the 200MA (3,362), which may act as dynamic resistance.
As long as price stays below 3,348–3,362, the bias remains to the downside, with a break below 3,309 likely exposing the 3,289–3,267 support zone.
A clean reclaim above 3,334- 3,348 would neutralize the immediate downside pressure and open the path back toward 3,373–3,387.
📌 Key Levels to Watch
Resistance:
‣ 3,334
‣ 3,348
‣ 3,362
‣ 3,373
‣ 3,387
Support:
‣ 3,309
‣ 3,289
‣ 3,267
‣ 3,241
🔎Fundamental Focus – FOMC
The FOMC rate decision and Powell’s press conference later today will be the key driver for gold. Expect sharp volatility and potential whipsaws around the release.
⚠️ Manage risk carefully, avoid chasing initial spikes, and wait for clear direction once the event dust settles.
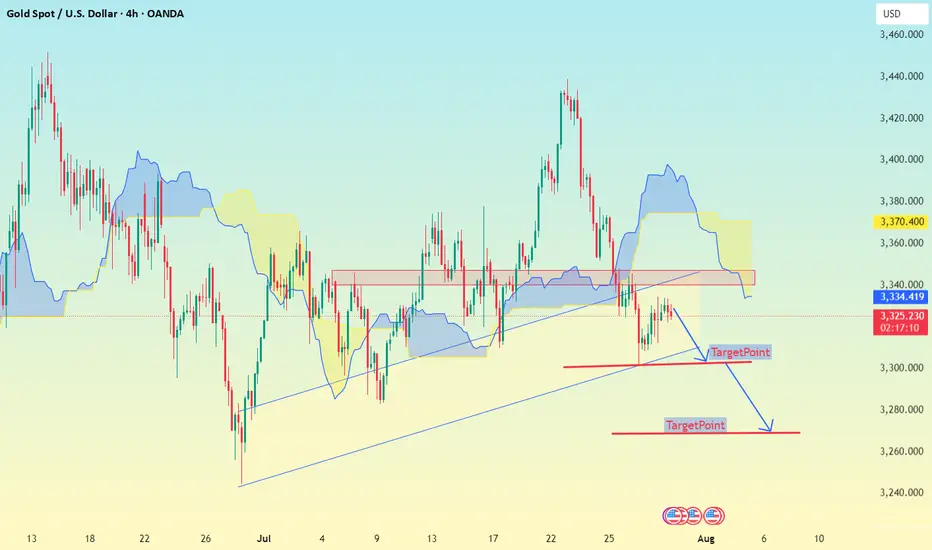
XAU/USD (Gold Spot vs US Dollar) Technical Analysis – 4H Char🔍 XAU/USD (Gold Spot vs US Dollar) Technical Analysis – 4H Chart
Based on my shared image from TradingView, here's a detailed analysis of the current XAU/USD market scenario:
---
🧩 Chart Type & Indicators Used
Timeframe: 4-Hour (H4)
Platform: TradingView
Indicators:
Ichimoku Cloud
Bollinger Bands (BB)
Support/Resistance zones
Trendlines
Price Action with Target Points Marked
---
📉 Current Market Structure
Price: ~$3,324 (Sell/Buy zone shown)
Overall Trend: Turning bearish in the short term.
Price Action:
Price has broken below an ascending trendline, suggesting a shift from bullish to bearish momentum.
The price is trading below the Ichimoku cloud, reinforcing a bearish bias.
Failed retest of the cloud resistance zone (around 3,335–3,340), which now acts as a resistance.
---
🔻 Bearish Signals
1. Trendline Break:
The rising trendline support (mid-July to now) is broken.
This indicates a potential reversal from the previous bullish momentum.
2. Retest & Rejection:
Price attempted to retest the breakdown zone and was rejected from the 3,335–3,340 level.
3. Ichimoku Cloud Bearish Setup:
Price is clearly below the cloud.
Future cloud is bearish (red shaded).
Chikou Span (lagging line) is below price candles and cloud.
---
🎯 Targets
First Target Point: ~3,300
This is the next horizontal support level (near recent lows).
Final Target Point: ~3,270
Stronger support zone and measured move from breakdown.
---
🛡 Resistance Zone
Immediate Resistance: 3,335–3,340
Stronger Resistance: 3,370
---
📌 Conclusion
The XAU/USD 4H chart shows a bearish breakout below the rising channel, with confirmation from Ichimoku and price rejection at cloud resistance. The market is targeting 3,300 as the first support, and if that breaks, 3,270 will likely follow.
---
✅ Strategy Suggestion (if trading):
Bias: Short/Sell
Entry: After a weak pullback or retest near 3,330–3,335
Targets:
TP1: 3,300
TP2: 3,270
Stop Loss: Above 3,345 or near 3,350 zone
Let me know if you'd like this in simpler terms or want me to track the next setup.
XAUUSD analysis - 1H FVG and OB setupsOn the 1H timeframe, price is currently approaching two key supply zones (OB 1H):
🔴 First OB zone: around 3354 – 3360
🔴 Second OB zone: around 3368 – 3370
We're watching these zones for potential short setups, only with confirmation on the lower timeframes (5M or 3M).
If price reacts to one of these OBs, we expect a move down toward the green 1H demand zone around 3280 – 3290, where a long setup may later form.
📌 Key scenarios:
1️⃣ Price hits the first OB → confirmation → short
2️⃣ Price moves to the second OB → confirmation → short
3️⃣ Target for both setups = green OB around 3280
4️⃣ No entry without confirmation from LTF
❗️ Do NOT enter without lower timeframe confirmation.

XAUUSD – Weak Rebound, Bearish Bias RemainsYesterday was a quiet and choppy day for Gold.
Although price managed to recover a small portion of last week’s 1400 pip drop, the rebound remains anemic — price barely reached the 23% Fibonacci retracement.
To make things worse for the bulls, the recovery from around $3300 is starting to take the shape of a bearish flag, a continuation pattern that typically signals further downside ahead.
📌 Resistance Zones to Watch:
- Initial resistance: $3345–3350
- Stronger resistance: $3370, a level already proven and well-defined
As long as the price is under those levels, I remain firmly bearish.
📈 Trading Plan:
I already have a short position open, and I'm still waiting to add more, preferably on a push into higher resistance, ideally above $3345.
No need to force entries — I’d rather scale in on strength, not weakness.
Once the correction is complete, I’m targeting:
- $3280 as the first support
- $3250 as a realistic downside objective
Conclusion:
The rebound lacks power. The structure favors the bears.
Still watching for better entries to add short, with eyes on 3280 and 3250 as likely targets.
Let’s stay patient and let the setup come to us. 🎯
Disclosure: I am part of TradeNation's Influencer program and receive a monthly fee for using their TradingView charts in my analyses and educational articles.

7/30: Watch for Sell Opportunities in the 3352–3363 ZoneGood morning, everyone!
After a period of consolidation and decline, gold has found preliminary support near the 3300 level, and early signs of a bottom formation are emerging. The key technical level now lies around the 3332–3337 resistance zone. Based on current price structure, a breakout is likely, with major resistance seen at 3352–3358, while 3323–3316 serves as the primary support range.
However, caution is warranted as today’s ADP employment data may significantly influence short-term price action. Whether gold can hold above the 3337–3343 level depends on the data's impact.
From a broader perspective:
On the weekly chart, the 20-period moving average (MA20) has climbed to around 3276, yet the overall structure remains bearish for bulls
On the daily chart, gold is still trading below the MA60, facing notable resistance
This week's key events — ADP (Wednesday), jobless claims, and NFP (Thursday and Friday) — will likely shape gold’s medium-term trend
Trading Strategy for Today:
Focus on the 3313–3353 trading range, and be highly responsive to data-driven volatility.
Important note: If gold rises to 3343–3358 before the ADP release, then regardless of whether the data is bullish or bearish, the preferred approach is to sell into strength, as a post-data pullback is a likely scenario.

Sell Analysis – 30M Smart Money Concept Sell Analysis – 30M Smart Money Concept
📊 Chart Context:
Timeframe: 30M
Market: Gold (XAUUSD)
Bias: Bearish – Scalp Sell
---
🔍 Key Observations:
Premium Zone Rejection:
Price tapped into a premium supply zone formed after a clear break of structure (BoS) to the downside. This confirms seller dominance at higher pricing levels.
FVG (Fair Value Gap) Fill:
The price filled a previous FVG imbalance and showed rejection without closing above the origin of the impulse. This shows liquidity grab behavior typical in smart money moves.
Bearish Order Block Confirmation:
A bearish OB was respected and reacted to. The latest candle shows strong rejection with a long upper wick and volume tapering — an early confirmation of potential entry trigger for scalp short.
---
🧨 Entry Strategy (Scalp Sell):
Entry Zone:
Inside the reaction to the OB and FVG (just below the premium zone)
✅ 3325 ~3330
Stop Loss:
Just above the last high or FVG origin
✅ 3340
Take Profit:
TP1: Towards the equilibrium of the recent impulse leg
✅ 3300
TP2: Below the discount zone, targeting liquidity under recent lows
✅ 3280
---
⚠️ Risk Note:
This is a scalping setup, not a swing trade. Higher timeframes still show mixed signals, so risk management is key. Avoid over-leveraging.
---
🏁 Summary:
> A high-probability scalp sell setup confirmed by smart money concepts: BOS → FVG Fill → OB Rejection → Liquidity Grab → Bearish Continuation.
Gold Eyes Rebound Toward $3,438 TargetGold (XAU/USD) is trading near $3,314, approaching support along the rising trend line. A potential bounce could target the $3,438 resistance area, as marked in the chart.

BTC's latest trading strategy and analysis layout#BTCUSD
BTC's current technical signals show a bull-bear tug-of-war situation.If a golden cross is formed near the zero axis, it may indicate a new wave of rise; if it falls below the zero axis, we need to be wary of a deep correction.
There are certain opportunities for both bulls and bears in the current market, but global regulatory policies have not yet been unified. Policies such as the US "GENIUS Act" may affect BTC and require continued attention. BTC is currently facing significant buying support around 117,500, but the hourly chart shows that there is still potential for a continued pullback. The current trend has not yet finished. Pay attention to the support level of 116,000 below. If it falls below, it may fall into the consolidation range of 116,000-114,000. For aggressive traders, consider going long at 117,500-116,500, with a target of 118,500-119,500. A break above this level could lead to 120,000.
🚀 117500-116500
🚀 118500-119500

XAUUSD idea 29/07/25We are waiting for our asset to reach our action zone, and based on the reaction, we’ll decide on our next moves.ALWAYS WAIT FOR A CONFIRMATION TO SEE IF THE PRICE VALIDATES THE ZONE.and you what is your vision of the EURUSD its interests me! i wait you in the commentary

XAUUSD – Bears in Control, but Watch for a Rebound FirstYesterday, after a small bounce from the ascending trendline, Gold broke down and printed an intraday low around $3300.
Right now, the market appears bear-dominated, and further downside continuation is likely in the coming days.
________________________________________
📉 But there’s a catch:
From last week's top, Gold has dropped over 1400 pips without any meaningful correction.
That opens the door for a possible short-term rebound, which could be just a setup for new short entries.
________________________________________
📌 Key levels to watch:
• First resistance: $3350
• Major resistance: $3375 – Only a daily close above this level would shift control back to the bulls
🎯 Until then, any bounce is an opportunity to sell into strength.
A break below $3300 opens the path to $3280, with a likely extension toward $3250.
________________________________________
Conclusion:
The trend is bearish, but don’t chase.
Wait for a corrective rally, then look to sell the rip—unless bulls reclaim $3375, it’s still a bear market.
Let’s see if Gold gives us the setup. 🎯
Disclosure: I am part of TradeNation's Influencer program and receive a monthly fee for using their TradingView charts in my analyses and educational articles.
GOLD: Time for massive drop? +3000 pips move! Gold has failed to breakthrough the previous resistance indicating a strong sellers hold around $3440 region. Now since the price has stared dropping we can see it dropping around $2800 in long term. In order for this to happen we need strong confirmation, which will help us understand the possible volume.
Agree with our idea?
Like and comment!

gold on sideways#XAUUSD price await double breakout above 3328.6 for bullish to take place. But now we await for any breakout to take trade.
Below 3314 holds sell continuation, target 3296, stop loss 3324.
Above 3328.6 on 2 times breakout will start bullish till 3340.
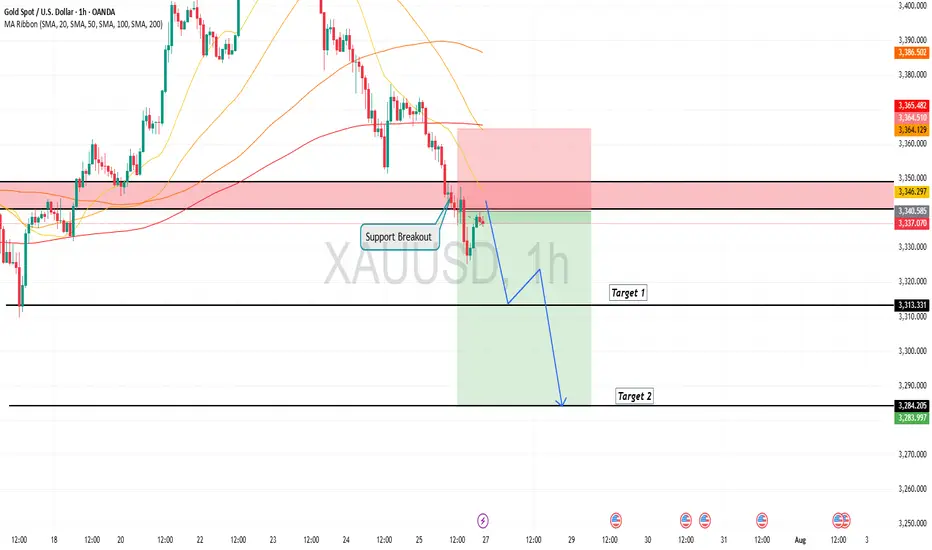
Gold is in the Bearish Direction after Breaking SupportHello Traders
In This Chart GOLD HOURLY Forex Forecast By FOREX PLANET
today Gold analysis 👆
🟢This Chart includes_ (GOLD market update)
🟢What is The Next Opportunity on GOLD Market
🟢how to Enter to the Valid Entry With Assurance Profit
This CHART is For Trader's that Want to Improve Their Technical Analysis Skills and Their Trading By Understanding How To Analyze The Market Using Multiple Timeframes and Understanding The Bigger Picture on the Charts
The latest trend analysis and layout of the day,flexible adoptio#XAUUSD
⚠️News focus on the Sino-US trade talks, which may affect the gold trend.
Since the opening of the market today, gold has been fluctuating in a narrow range in the short term, without giving a clear trading direction🤔, and the short-term trend has not changed much.📊
🚦It remains constrained by resistance and a downward trend. In the short term, we need to pay attention to the 3300 mark below and the support of 3295-3285📈. On the upside, we should pay attention to the short-term suppression level of 3321-3333 and yesterday's high of 3345-3350.📉
In the short term, as long as it does not break through yesterday's high point, the volatile downward trend will not change. 🐂Once it breaks through, the short-term decline will stop, and the market will continue the bull rebound to test 3370~3380 or even 3400 before falling again.
Therefore, short-term trading focuses on the 3300 mark below and the long trading opportunities at 3295-3285. On the upside, defend the 3345-3350 highs and establish short positions.🎯
🚀 BUY 3310-3330
🚀 TP 3321-3333
🚀 BUY 3295-3285
🚀 TP 3310-3330
🚀 SELL 3320-3330
🚀 TP 3310-3300
🚀 SELL 3345-3350
🚀 TP 3330-3285

GOLD: Bottoming Out or Just the Calm Before the Storm? – GOLD: Bottoming Out or Just the Calm Before the Storm?
Gold has dropped nearly $50 over the last 4 sessions, showing clear bearish momentum. But is this just a liquidity grab before a reversal — or are we simply pausing before another leg down?
🔍 Market Context:
Recent US–EU defence and trade agreements may have weakened gold’s short-term appeal as a safe haven.
The US dollar and equities have both gained on strong macroeconomic data, redirecting capital flows away from metals.
Overall market sentiment has tilted risk-on, putting additional pressure on gold prices.
📊 Technical Overview (12H Chart):
Price has broken below the 3342 key support zone and rejected the retest — turning it into short-term resistance.
Current range sits between:
Sell-side liquidity zone: 3301–3292
Major demand/FVG zone: 3272–3270
Above price:
Resistance at 3342, and a broader sell zone at 3370–3388 (OB + FVG + Fib 0.5–0.618)
🔧 Trade Plan (Reaction-Based — Not Predictive):
🟢 Scenario 1 – Buy (Scalp Reaction)
Entry: 3292 – 3290
Stop Loss: 3285
Targets: 3296 → 3300 → 3305 → 3310 → 3315 → 3320 → 3325 → 3330
📍 Intraday bounce play from a high-liquidity zone
🟢 Scenario 2 – Buy (Deeper Reversal Swing)
Entry: 3272 – 3270
Stop Loss: 3265
Targets: 3276 → 3280 → 3284 → 3288 → 3292 → 3294 → 3300 → Trail
📍 Potential mid-term bottom setup if liquidity is fully swept
🔴 Scenario 3 – Sell (Short-Term Rejection)
Entry: 3340 – 3342
Stop Loss: 3346
Targets: 3335 → 3330 → 3325 → 3320 → 3310
📍 Clean rejection setup if price fails to reclaim key resistance
🔴 Scenario 4 – Sell (Higher Supply Zone)
Entry: 3370 – 3372
Stop Loss: 3376
Targets: 3365 → 3360 → 3355 → 3350 → 3345 → 3340 → 3330 → 3320
⚠️ Higher risk; only valid with strong confirmation
⚠️ Risk Notes:
Be mindful of fakeouts around London and NY opens, as liquidity sweeps are common.
Wait for price to enter your zone, then react — don’t anticipate.
Strict risk management is key in a volatile environment like this.
🧭 I’ll continue monitoring how price reacts around these zones.
If this kind of structured planning resonates with your approach,
feel free to stay connected — or share your perspective in the comments.

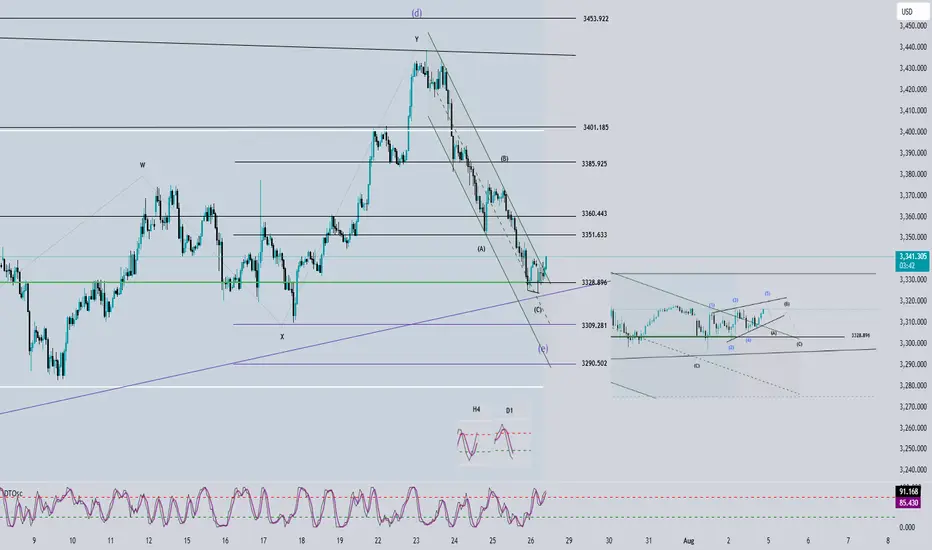
Elliott Wave Analysis – XAUUSD – July 28, 2025📊
________________________________________
🔍 Momentum Analysis:
• D1 Timeframe: Momentum has entered the oversold zone. This strongly suggests a potential bullish reversal today, which could lead to a rally or sideways movement lasting around 4–5 days.
• H4 Timeframe: Momentum is reversing upward. This indicates a likely bullish or sideways move in the short term, at least until momentum reaches the overbought zone (estimated within the next 2 H4 candles).
• H1 Timeframe: Momentum is currently overbought, so we may first see a pullback or sideways movement until a clearer reversal signal appears.
________________________________________
🌀 Wave Structure Analysis:
• On the H4 chart, as noted in previous plans, the assumption that price is forming a contracting triangle (abcde) is still valid. Price is currently in the final leg (wave e) of this triangle.
• On the H1 chart, we can observe a channel structure, within which an abc corrective pattern is unfolding.
• The lower boundary of the triangle (marked by the green trendline) combined with support zones will be critical areas to monitor for the end of wave e.
🔺 Note: Wave e does not necessarily end precisely at the triangle boundary – it can slightly overshoot. Hence, we’ll rely on smaller wave structures to identify potential reversal zones.
________________________________________
🎯 Key Price Zones to Watch:
• Target 1: 3329
• Target 2: 3309
• Target 3: 3290
________________________________________
🔎 Lower Timeframe Structure (M10):
From the current price action (as shown in the chart), we can see a leading diagonal triangle structure forming. This is a pattern commonly seen in wave 1. If this pattern is confirmed, a sharp and steep decline toward the 3329 zone is likely.
________________________________________
⚖️ Combining Momentum & Wave Structure:
• D1: Signals a potential reversal → favors Buy setups.
• H4: Momentum is rising, but price hasn’t confirmed a new bullish trend → need to stay alert and tighten Stop Loss.
• H1: Overbought + possible leading diagonal → Expecting a pullback for wave 2 toward 3329 → this would be the optimal Buy zone.
________________________________________
🧭 Trade Plan:
• For experienced traders:
→ Wait for price to reach key levels and watch for reversal signals before entering.
• For beginners:
→ Use the following Limit Buy setup:
✅ Setup 1:
• Buy zone: 3330 – 3328
• Stop Loss: 3320
• TP1: 3351
• TP2: 3370
• TP3: 3385
✅ Setup 2:
• Buy zone: 3310 – 3308
• Stop Loss: 3300
• TP1: 3328
• TP2: 3351
• TP3: 3370
GOLD H2 Intraday Chart Update For 29 July 2025Hello Traders, Welcome to new day
we have US JOLTS high impact news today, for market sustains above 3300 psychological level
if market successfully break 3280 level then it will move towards 3280 or even 3270
if market crosses 3330 level successfully then it will move towards 3345 or even 3360
All eyes on FOMC & NFP news for the week
Disclaimer: Forex is Risky

Gold Spot / U.S. Dollar (XAUUSD) 4-Hour Chart4-hour chart from OANDA shows the price movement of Gold Spot (XAUUSD) from mid-July to late August 2025. The current price is 3,425.000, with a slight increase of +0.03% (0.880) to 3,315.325. Key levels include a sell price of 3,315.070 and a buy price of 3,315.590. The chart highlights a recent downward trend with a support zone around 3,313.855 and resistance near 3,350.823, as indicated by the shaded areas.

Gold: This Week's Analysis & StrategyThis week, the fluctuations have clearly moderated📉. Focus on a strategy of buying at lows and selling at highs as much as possible📈. Currently, the resistance around 3350 is prominent🚧, and 3300 acts as support below🛡️. If the decline continues, it may reach around 3285👇
We successfully took short positions last week 📉, and this week I recommend going long at lower levels 📈. Over the long term, gold remains in a bull market 🐂, but it will not repeat the frenzy seen in April; instead, it will maintain a steady upward pace ⬆️.
Market expectations for Fed rate cuts have been volatile so far this year 📊. At the start of the year, as Trump-related developments unfolded, market optimism faded 😐. Meanwhile, the de-dollarization trend fueled growing expectations of Fed rate cuts 💹. By early April, Trump’s reciprocal tariff measures—far more aggressive than expected—roiled global financial markets 🌍, triggering a surge in concerns about a U.S. recession ⚠️. Markets thus anticipated that the Fed would cut rates quickly to shore up the economy, with expectations for rate cuts within the year once exceeding 100 basis points 📉. However, shortly after, Trump announced a 90-day extension of the reciprocal tariffs, easing market pessimism 😌 and driving a strong rebound in U.S. stocks 📈. At this point, markets began worrying that his tariff policies could spark an inflation rebound 🔥, leading to a steady decline in rate cut expectations—currently, expectations for rate cuts this year have dropped to fewer than two 🔄.
Risk Warning ⚠️
Event Sensitivity: Outcomes of China-U.S. trade talks 🤝, the Fed’s statements , and nonfarm payroll data 📊 may trigger one-sided volatility. Positions should be adjusted promptly to avoid risks 🛡️
⚡️⚡️⚡️ XAUUSD ⚡️⚡️⚡️
🚀 Buy@ 3300 -3310
🚀 TP 3320 - 3330 - 3340
🚀 Sell@ 3350 -3340
🚀 TP 3330 - 3320 - 3310
Daily updates bring you precise trading signals 📊 When you hit a snag in trading, these signals stand as your trustworthy compass 🧭 Don’t hesitate to take a look—sincerely hoping they’ll be a huge help to you 🌟 👇
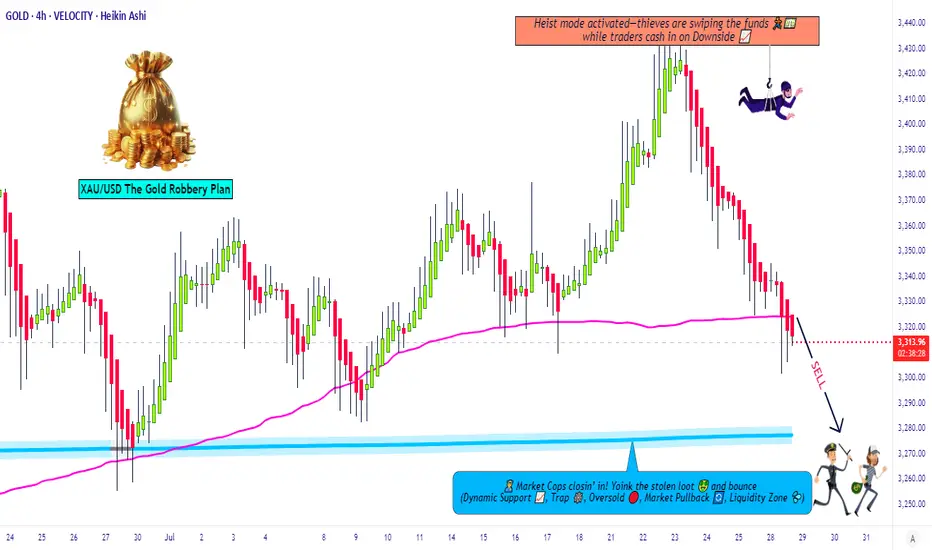
Gold Robbery Blueprint: Smart Bears on the Move Now!💣 XAU/USD GOLD HEIST PLAN: Robbery Begins at Resistance Zone! 🔐💰
🌟Hi! Hola! Ola! Bonjour! Hallo! Marhaba!🌟
Dear Money Makers & Market Robbers, 🕵️♂️💸🚀
Welcome to another strategic strike by Thief Trading Style™—where smart analysis meets bold execution. We're targeting XAU/USD (Gold) in this scalping/day-trade opportunity, primed with fundamentals, technicals, and pure robbery logic.
🔍 THE GAME PLAN
We're looking at a neutral zone turning bearish, and here’s how the robbery unfolds:
🔑 ENTRY POINTS
🎯 “Vault wide open” signal!
Initiate short orders at current price zones or set layered SELL LIMITS near swing highs on 15M/30M charts. We're running a DCA-style pullback entry for max loot.
🕵️♀️ Entry isn't about one shot—it's about precision raids.
🛑 STOP LOSS: THE ALARM SYSTEM
Set SL just above the nearest swing high (4H timeframe preferred).
Use candle wick tips as your defense line (Example: 3350.00).
Adjust SL based on risk appetite and number of orders stacked.
🎯 TARGET: THE GETAWAY PLAN
💸 First Vault: 3280.00
💨 Or escape earlier if price action signals reversal. Protect your gains. Professional thieves don't get greedy.
📊 WHY WE’RE ROBBING HERE
This level is a high-risk barricade zone—police aka "market makers" are strong here.
We spotted consolidation, oversold signals, trend reversal setups, and a bullish trap disguised as support. A perfect time to strike. 🧠🔍
📰 FUNDAMENTAL & SENTIMENTAL CHECKPOINTS
🔎 Stay updated with:
Global news drivers
Macro & Intermarket analysis
COT reports & future trend targets
👉 Check the 🔗🔗🔗
⚠️ TRADING ALERT - STAY SAFE DURING NEWS BOMBS!
Avoid entries during major economic data releases.
Use trailing SL to protect running profits.
Monitor volatility spikes & price anomalies.
💖 JOIN THE CREW, BOOST THE HEIST!
If this plan adds value to your trades, hit that Boost Button 💥
Support the Robberhood and help grow the gang of smart money snipers 🕶️💼💣
Every boost = more ammo for next mission. Let's rob the market—not each other. 🚀🤑
📌 Remember: Market is fluid. Stay sharp, adapt quick, and trade like a shadow.
Catch you soon in the next grand heist 🎭💼
#XAUUSD #GoldTrade #ScalpingStrategy #DayTrading #ThiefTrader #RobTheMarket #BoostForMore #NoChaseNoCase
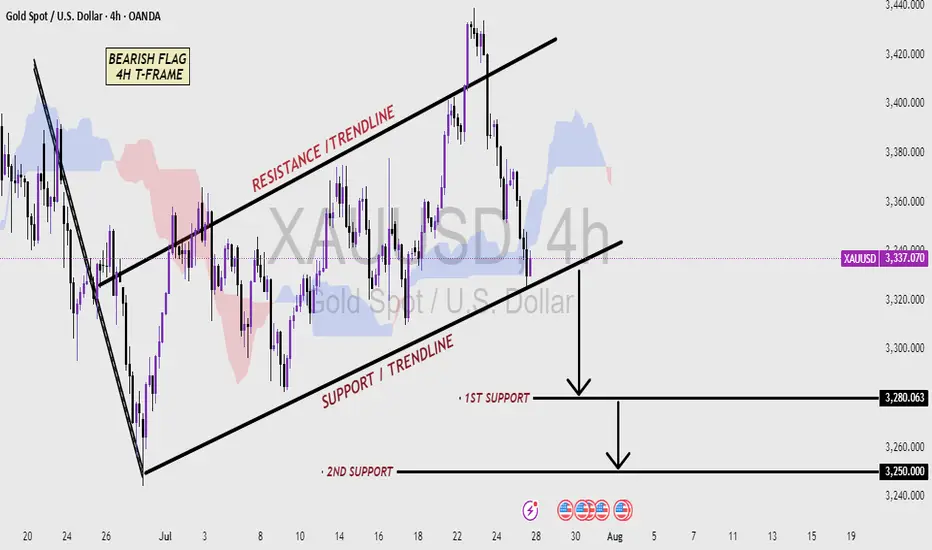
XAUUSD 4H CHART - Bearish pattern Analysis (read the caption)📉 XAUUSD 4H Chart – Bearish Flag Pattern Analysis
This 4-hour chart of Gold (XAUUSD) shows a classic Bearish Flag pattern, which is typically a continuation signal in a downtrend. After a strong bearish move, price entered a consolidation phase inside a rising channel, forming higher highs and higher lows—this creates the flag structure.
The price is currently trading within the Resistance and Support Trendlines of the flag. A break below the Support Trendline would confirm the bearish flag breakout, suggesting a continuation of the downtrend.
Key support levels to watch:
🔻 First Support: 3280.063 – Initial target after breakout
🔻 Second Support: 3250.000 – Extended target if bearish momentum continues
Traders should monitor for a confirmed breakdown with volume and bearish candlestick confirmation to validate short entries. This setup favors sellers if the support breaks decisively.
3300 may fall below, possibly setting a new low#XAUUSD
From the daily chart perspective, gold has a tendency to form a converging triangle, and observing the technical indicators of the daily chart, the downward trend may have just begun📉.
So, how should we plan for the evening?📊 Now there are certainly many outside buyers who will continue to increase their positions and try to recover their losses💰. So, should we continue to be long?📈 My opinion is to wait and see.👀 If the daily chart does not fall below 3300 points, it will consolidate between 3300 and 3350 points in the future. If it falls below 3300 points, we will next focus on the support level of 3295-3285 points, and then consider whether to go long🤔.
If you are more aggressive, you can consider going long near 3305 points and exit after earning $10-20. All opinions have been informed and everyone can choose to adopt them according to their own circumstances.😄