XAUUSD:Buy or SellRegarding the trend of XAUUSD (gold against the US dollar), it is completely in line with my expectations yesterday. The current price has reached the watershed of 3345. If it breaks through, continue to be bullish. If it does not break through. Then wait for the market to fall.
### Key analysis points
1. Confirmation of resistance breakthrough
- The importance of the 3345 level: If this position is a resistance that has been tested many times recently (such as previous highs, Fibonacci retracement levels or trend line suppression), it may trigger short-covering or new buying after the breakthrough, pushing the price further up.
- Verify the effectiveness of the breakthrough: It is necessary to observe the momentum at the time of the breakthrough (such as accompanied by a large positive line, increased trading volume) and whether the closing price can stand above 3345 to avoid false breakthroughs.
2. Upward target
- First target: If the breakthrough is established, the next resistance may look at the 3360-3380 area (previous high or extended Fibonacci level).
- Medium-term potential: If the trend reversal is confirmed, it may even challenge the 3400 psychological level.
3. Pullback risk management
- Support level: If it fails to break through 3345 or falls back after a false breakout, you need to pay attention to the support below (such as 3320-3300), which is the short-term long-short watershed.
- Stop loss reference: The stop loss of long positions can be set below 3300 to protect the safety of funds.
Trading strategy suggestions
- Aggressive strategy (breakthrough trading):
- Entry: Go long when the price breaks through 3345 and then confirms the pullback.
- Stop loss: Below 3320 (adjusted according to volatility).
- Take profit: Close orders in batches (3360, 3380).
- Conservative strategy (retracement trading):
- Wait for the pullback to the 3320-3300 support area to stabilize and then go long, stop loss 3280.
- The target is the same as the breakthrough strategy.
- Short warning:
If the 3345 resistance continues to suppress and a bearish pattern appears, consider shorting with a stop loss above 3360.
Variables to be added
1. Time frame: Is the above analysis based on the daily or 4-hour chart? Short-term trading requires a smaller cycle to confirm the signal.
2. Driving factors: Pay attention to the Fed's policy expectations, the US dollar index, the geopolitical situation, etc., which may suddenly change the technical pattern.
Summary
Whether the current rebound can continue depends on the effectiveness of the breakthrough of 3345. If successful, it can be bullish, but a strict stop loss is required.
If you need a more detailed entry point analysis or position management plan, please feel free to let me know your trading cycle and risk preference, and I will provide you with a customized strategy.
Xauusdupdates

XAUUSD: Buy or sell now?Continuously update good transactions. Let members make rich profits. How to trade XAUUSD today?
Reference suggestions are as follows:
If it retreats to the range of 3318-3328, consider buying. Target 3345-3360
If it falls below 3310, chase the shorts and choose to sell. Target 3280-3265
For reference only. Do not trade independently.
If you need a more detailed entry point analysis or position management solution, please feel free to tell me your trading cycle and risk appetite, and I will provide you with a customized strategy.
XAUUSD: Buy or sell now?The price of XAUUSD has come to the position near 3345 again. The pressure at this position is very controversial. We need to observe. If this position is stable. Then we need to pay attention to the target of 3360-3385. If it is unstable, we will short and wait for the TP of 3320, which still needs to be emphasized. If you are not sure how to trade. Remember to leave us a message. We will lead you to make better and more accurate transactions, expand profits or recover losses. Do not trade independently. Create greater losses.
Remember to continue to pay attention to the core trading strategy updates of swing trading.
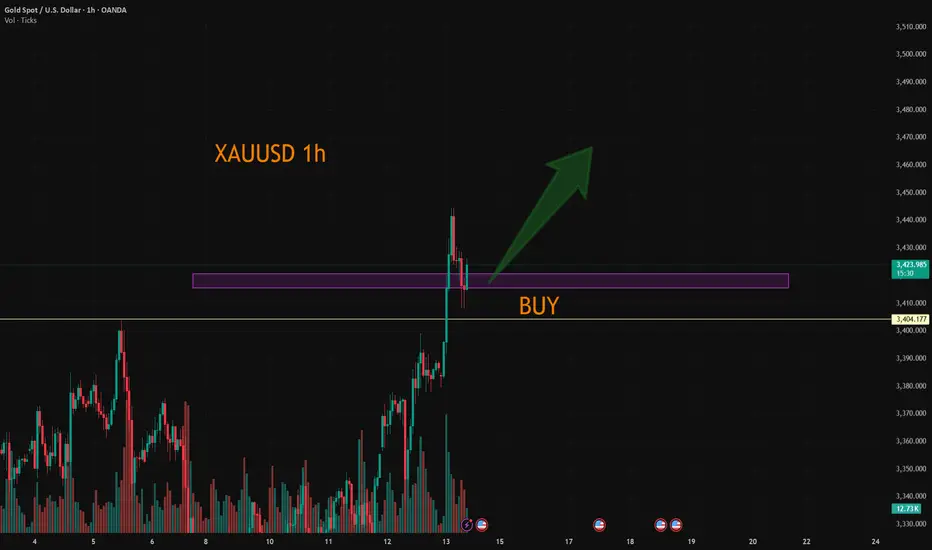
XAUUSD:Go long, go long
"Israel announced a strike on Iran" broke out the news, gold and crude oil in the Asian session soared. Again help us recently do long ideas, too late to explain so much, the follow-up trading ideas are still long after the pullback.
After 3403 broke through has been converted into strong support, short - term to 3415-20 to do more.
Trading Strategy:
BUY@3415-20
TP:3440-50
↓↓↓ More detailed strategies and trading will be notified here ↗↗↗
↓↓↓ Keep updated, come to "get" ↗↗↗
As conflict escalates, gold is cautiously long📰 Impact of news:
1. The geopolitical situation between Israel and Iran deteriorates
📈 Market analysis:
The worsening geopolitical situation caused a surge in gold prices. The intraday short-term support points of 3420, 3402, and 3380 will all become key support for testing bulls. If the European session is strong, 3420 cannot be lost. If it falls back and loses, it will move closer to the top and bottom conversion position of 3402. If you go long later, you must pay attention to the weakening of the upward momentum. If the European session continues to break the high of 3440, then the US session can be seen around 3468-3493. If the upward momentum in the European session weakens, we need to watch out for a short-selling counterattack and a sharp decline. The geopolitical situation is unstable. Bros must strictly control SL when trading independently.
🏅 Trading strategies:
BUY 3420-3402-3380
TP 3390-3400-3420-3460-3490
If you agree with this view, or have a better idea, please leave a message in the comment area. I look forward to hearing different voices.
OANDA:XAUUSD FX:XAUUSD FOREXCOM:XAUUSD FXOPEN:XAUUSD TVC:GOLD
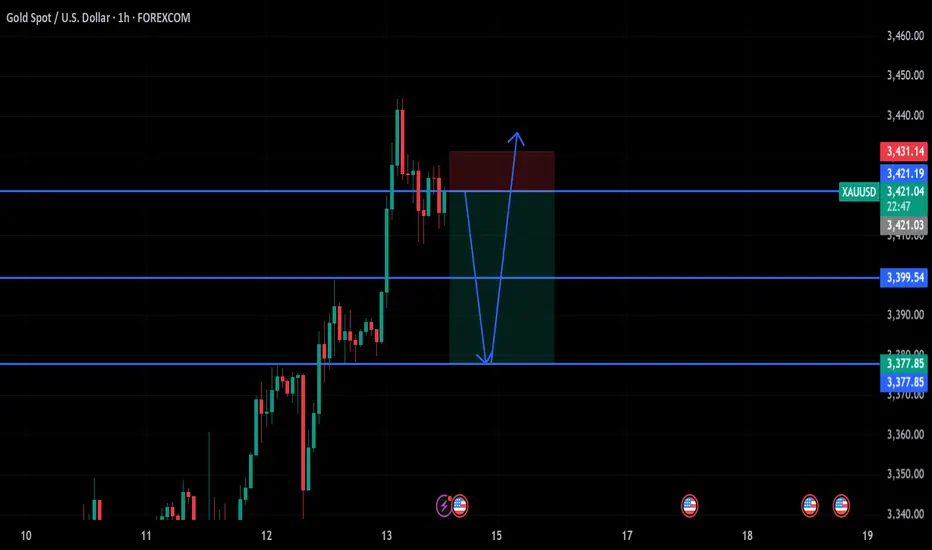
gold on sell retest#XAUUSD on price reverse, possible expect price to drop below those bearish zone before buying.
Entry on sell 3421, SL 3431, TP 3399-3378.
Below 3378 holds bullish reverse, if H1 and next H1 closes long above 3433 then bullish will reach 3470.
6/13 Gold Analysis and Trading SignalsGood morning, everyone!
Gold rallied to around $3399 during yesterday’s session, accurately reaching our preset sell zone at 3385–3403. Since then, the market has started pulling back, and today’s opening shows signs of accelerated downside movement. However, there are several strong support zones below, with immediate focus on 3378–3368, and further support around 3352–3343.
📉 Technical Outlook:
The current price action suggests the potential formation of a Head and Shoulders pattern. If confirmed, this could trigger a deeper correction towards 3340–3330. A break of these levels would significantly weaken the current bullish structure and open further downside risk.
🌍 Fundamental Drivers:
Today’s inflation-related data releases may add significant volatility;
Additionally, stay alert to any developments in the Middle East geopolitical situation, which could quickly shift market sentiment toward risk-off if escalations occur.
📌 Today’s Trading Recommendations:
✅ Sell Zone: 3410–3420
✅ Buy Zone: 3338–3326
🔄 Intraday Key Reaction Levels:
3403 / 3378 / 3362 / 3355 / 3343
🔒 Recommendation: Market is at a technically sensitive zone. Consider entering positions in batches and maintain strict risk control.

Watch Out for Weekly-Level ResistanceAs news of Israel's strike on Iran’s nuclear facility continues to spread, a surge in risk-off sentiment has driven noticeable gains across safe-haven assets. The escalation of tensions in the Middle East has clearly become a key trigger for current market sentiment. Should the conflict intensify further, oil and other safe-haven assets may see continued upside; conversely, if tensions ease, the retreat of risk aversion could lead to price corrections.
From a technical perspective, gold is currently facing downward pressure from the weekly trendline. If geopolitical tensions persist, gold may potentially rally toward the 3500–3550 range. However, without stronger fundamental support, a significant correction could follow once that level is reached.
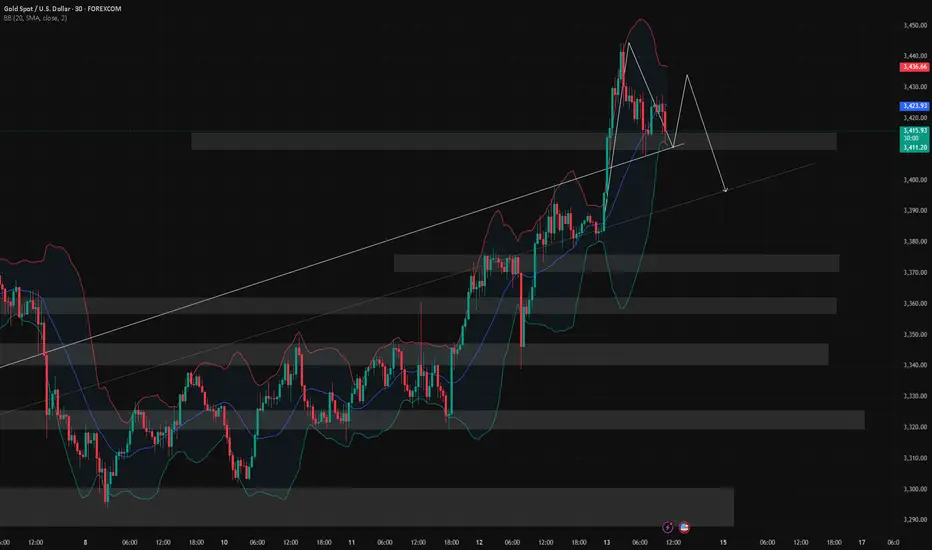
On the intraday chart, the price has now broken below the middle Bollinger Band on the 30-minute timeframe and is near lower band support around 3413. MACD and moving average alignment suggest there may still be room to test the 3396–3388 trend support zone. The 1-hour chart remains in a consolidation phase, and while a short-term rebound is possible, selling at higher levels appears to be the safer strategy for today.
As it is Friday and given the geopolitical uncertainties, the potential for weekend risk is significantly higher. It is recommended to reduce exposure before the market closes. If you choose to hold positions over the weekend, be sure to set appropriate stop-losses to mitigate unexpected developments.
GOLD Intraday Chart Update For 13 June 25Hello Traders,
First of all congratulations to all of you as 3430-40 zone GAP filled today but sad new is war scenarios resume
so advise for you is take limited risks
all eyes on 3450 Psychological level breakout, intraday expected range is 3400-3450 if markets break 3450 then it will move towards 3480
if market breaks 3400 successfully then it will move back towards 3370 or even 3355
Disclaimer: Forex is Risky

Fakeout or Takeoff? Gold Retakes 3350 Before NY Close1. Recap of Yesterday's Move
Yesterday was a volatile day for Gold. Price initially broke above the key 3340–3350 resistance zone, only to drop back below it—but intriguingly, it closed above it on the New York session. That close is the detail that changes everything.
2. Key Question: Will Gold Stay Above 3400 and Push Toward New ATHs?
Let’s split this into two scenarios:
________________________________________
🟢 Bullish Scenario – Buy the Dip?
• The short-term structure is undeniably bullish.
• The reclaim of 3340–3350 is not a fakeout, but a clean signal of strength.
• If momentum holds, we can expect price to push toward 3405 and then 3435.
• As such, the strategy remains: buy dips, targeting those key levels.
________________________________________
🟡 Long-Term Breakout? Not So Fast
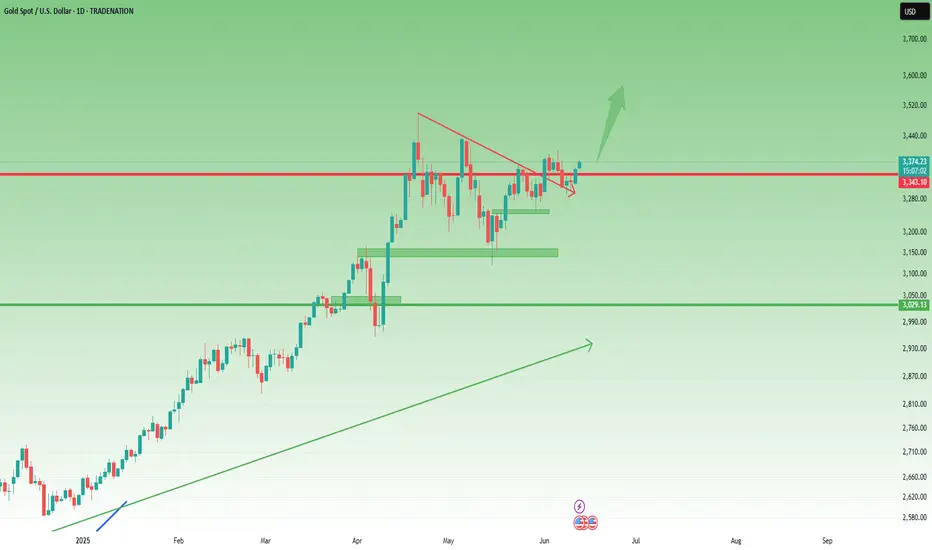
• Yes, the higher lows at 3120, 3250, and 3295 suggest that the correction from 3500 may be over.
• A clean breakout and stabilization above 3400, ideally near 3430, could signal a path toward a new all-time high.
• ❗ However, volatility remains wild, and if geopolitical tensions de-escalate or trade tariffs get resolved, Gold could see a sharp drop of 1500–2000 pips, as part of a broader risk-off unwind. Peace and stability could hurt safe-haven demand.
________________________________________
📌 Trading Plan
• Short-term: Buy dips while above 3340-3350 (ideally on a re-test), aiming for 3405 and 3435.
• Long-term: Stay flexible. Wait for confirmation above 3430 before going for the ATH narrative.
________________________________________
💡 Conclusion
Technically, Gold is bullish in both the short and long term. But with global uncertainty in play, don't ignore the fundamentals. Trade the chart, but respect the world around it. 🚀
Disclosure: I am part of TradeNation's Influencer program and receive a monthly fee for using their TradingView charts in my analyses and educational articles.
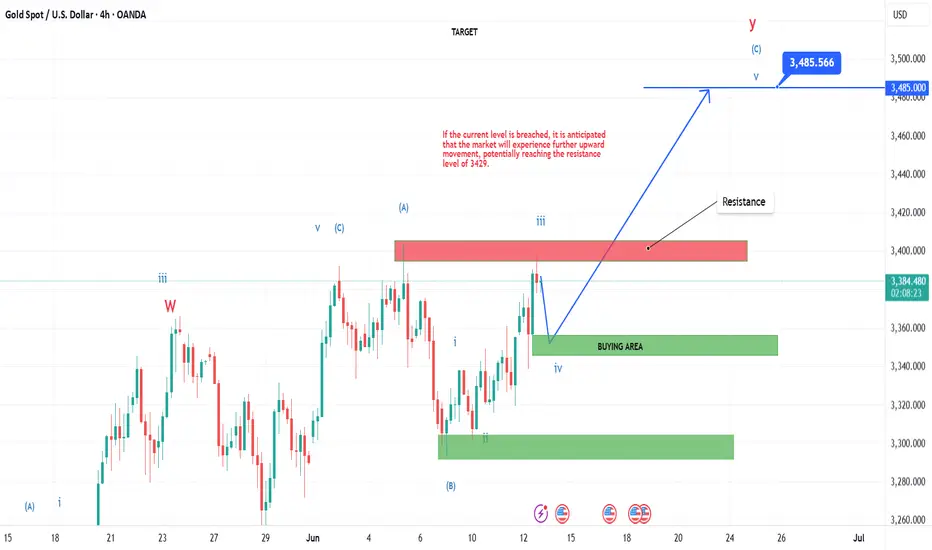
ELLIOT WAVEOANDA:XAUUSD 4 HOUR
**According to the Elliott Wave theory, the ongoing pattern appears to be a double correction. Wave 3 of {Y} has been completed, and Wave 4 is currently in progress. A potential buying opportunity may arise between the levels of 3360 and 3350. **
**However, if gold breaks below the 3350 level, further downside movement is expected, with the next support zone likely between 3315 and 3297. **
**Furthermore, if gold breaks the critical level of 3250, it may extend its decline toward the 3215–3197 range.**
Short gold ,it is expected to retreatToday, we accurately seized the trading opportunity of long gold at 3350 according to the trading plan, and hit TP: 3380 in the process of rebounding. We firmly grasped the profit of 300pips in the short-term long trading. At present, gold maintains the trend of continued rise! Now I definitely do not advocate chasing gold in short-term trading. On the contrary, I will actively look for good opportunities for short-term short trading to earn profits from short-term retracement.
In the short term, the suppression area I focus on is the 3390-3395 area, because the gold trend is relatively strong during the European session, and the US session should continue. If gold cannot break through this area in the short term, gold will likely usher in a wave of retracement. I think it should not be difficult to test the 3370-3360 area downward; secondly, we must pay attention to the same suppression area as the short-term high of 3402: 3405-3415; if gold touches this area and stagflation occurs, then it may form a secondary high in the short term, thereby hitting the firmness of the bulls' confidence and ushering in a retracement.
So next, I will test the gold short trade around the two areas of 3390-3395 and 3405-3415. Relatively speaking, the profit and loss ratio is still very favorable to us! But in the process of trading, we must strictly set up protection, after all, it is a counter-trend trade in the short term!

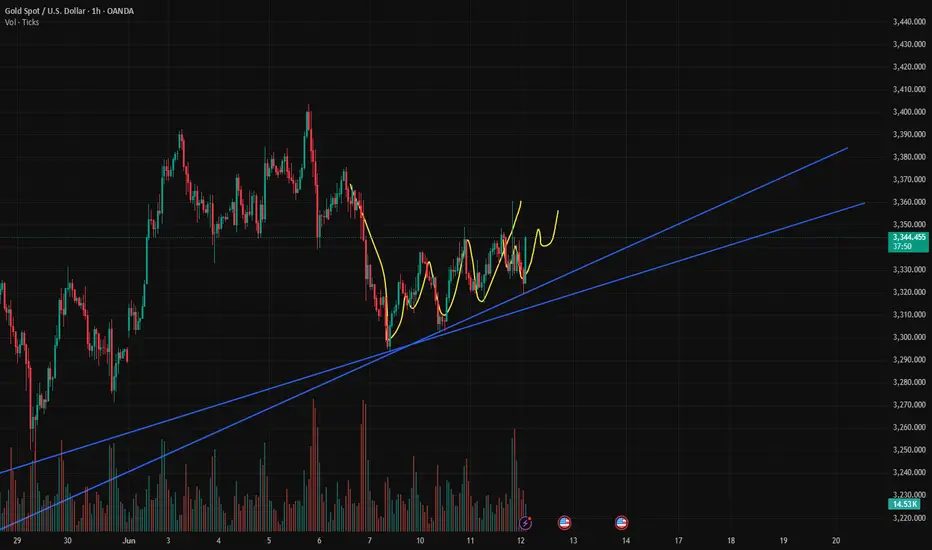
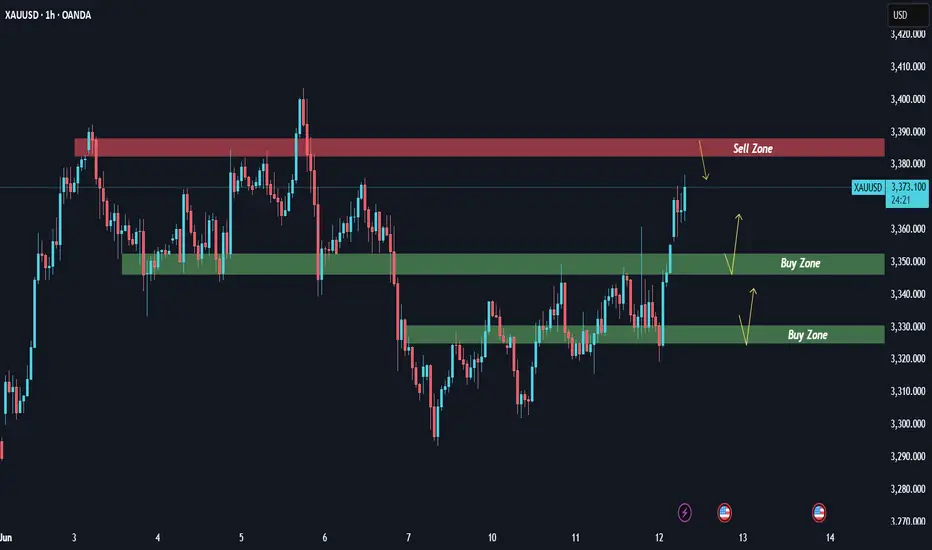
XAUUSD: Analysis June 12XAUUSD is trading within a short-term rising channel.
The market structure remains slightly bullish, with continuous corrections to support zones and then rebounds.
The RSI and MACD indicators have not entered the overbought zone, indicating that there is still room for growth if important support zones are held.
Buy Zone:
1. 3346 – 3350: If the price does not go deep, this is the "retest MA/trendline" zone in the uptrend channel. You can Buy when there is a clear price reaction in this zone.
2. 3330 – 3325: This is a very clear H1 technical support zone. Price may retrace here before bouncing back.
Sell Zone:
3385 - 3390: This is a strong resistance zone on the H1 chart, coinciding with the “Order Block” zone of the sellers. The price may touch and react strongly if there is no breakout momentum.
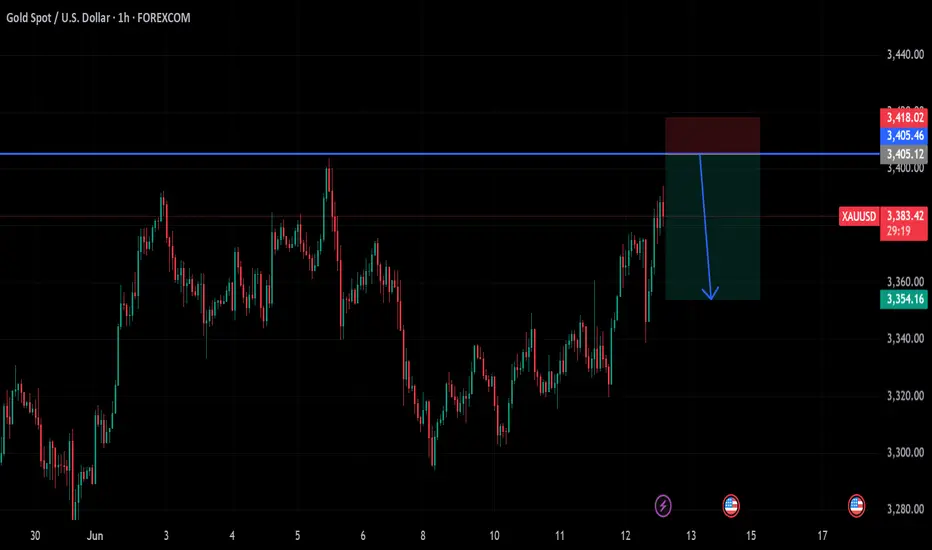
gold on selling#XAUUSD price expect to break 3405 for bearish formation.
Sell limit at 3405, take profit 3354, stop loss 3418
Bullish range can be consider if the H1 closes above 3410.
6/12 Gold Analysis and Trading SignalsGood morning, everyone!
Gold rebounded after dipping to around $3320 yesterday, following a pullback from our previously defined sell zone (3358–3373). Early today, price broke above 3360, reaching a high of 3373, exactly within the resistance zone we expected. The initial rejection from this level aligns well with our plan.
📈 Technical Analysis:
Watch closely whether 3373 can be broken with strong volume. If so, the next key resistance lies around 3385.
However, if price reaches this level without first testing the 3352–3346 support, a rejection is likely. In such case, 3385 may serve as a temporary top and a potential short entry point.
🧭 Trend Structure:
On the 4H timeframe, the bullish momentum remains intact. The last two candles suggest strong buying pressure. If today's fundamentals are supportive, a test of 3400 or higher is possible.
On the 1D chart, the market is still in a technical correction phase. The bounce near 3300 was supported by the long-term trendline. However, if price drops back below 3340 and stays there, a trend reversal becomes more likely.
Focus on the 3314–3296 support zone. If that breaks, a deeper drop is likely, possibly $100 or more, pushing price toward 3200–3190. The decline may unfold as a slow grind or sharp breakdown.
📊 Fundamental Watch:
Today’s Initial Jobless Claims data could have greater-than-usual impact due to the recent CPI release.
The Federal Reserve's Quarterly Financial Accounts Report is also due today and may affect broader market sentiment.
📌 Today’s Trading Recommendations:
✅ Sell Zone: 3385–3403
✅ Buy Zone: 3331–3321
🔄 Intraday Scalping Levels:
3376 / 3358 / 3346 / 3334

Beware of Bear Traps — Avoid Chasing Prices Blindly!Today, gold rallied up to 3380, then retraced to retest the 1H MA60 (around 3340),
before making another strong upward breakout, surpassing the earlier Asian session high.
📌 This upward move was driven by a combination of key factors:
🔸 Trump’s announcement of new tariffs to be imposed within two weeks
🔸 Rising geopolitical tensions in the Middle East, fueling safe-haven demand
🔸 A weaker-than-expected CPI yesterday
🔸 And an upcoming PPI release later today
📉 Current Price Outlook:
🔺 Strong resistance at 3392, closely watched
🔺 Next resistance zone: 3403–3414
🔻 Key support zones: 3360–3350
⚠️ Also note: the 3289 price gap remains unfilled,
which means downside risks haven’t been fully eliminated — avoid chasing rallies blindly!
✅ Trading Strategy:
Stick with the approach:
📌 Buy near key support, sell near known resistance
📌 Stay alert for news-driven bull traps, and manage risk wisely
Long profit-taking,how to position gold before unemployment data📰 Impact of news:
1. Pay attention to the initial unemployment claims data
📈 Market analysis:
After being pulled down, the gold price quickly rebounded to around 3385, and the RSI showed a V-shaped reversal. It is not recommended to chase the rise at present. In the short term, pay attention to the upper resistance area of 3385-3395. If the gold price effectively breaks through this resistance area, it is expected to touch the 3400-3410 line. On the contrary, it encounters resistance and pressure at the 3385-3395 line, and may retreat to the 3370-3360 line in the short term.
🏅 Trading strategies:
SELL 3385-3395
TP 3370-3360
If you agree with this view, or have a better idea, please leave a message in the comment area. I look forward to hearing different voices.
OANDA:XAUUSD FX:XAUUSD FOREXCOM:XAUUSD FXOPEN:XAUUSD TVC:GOLD

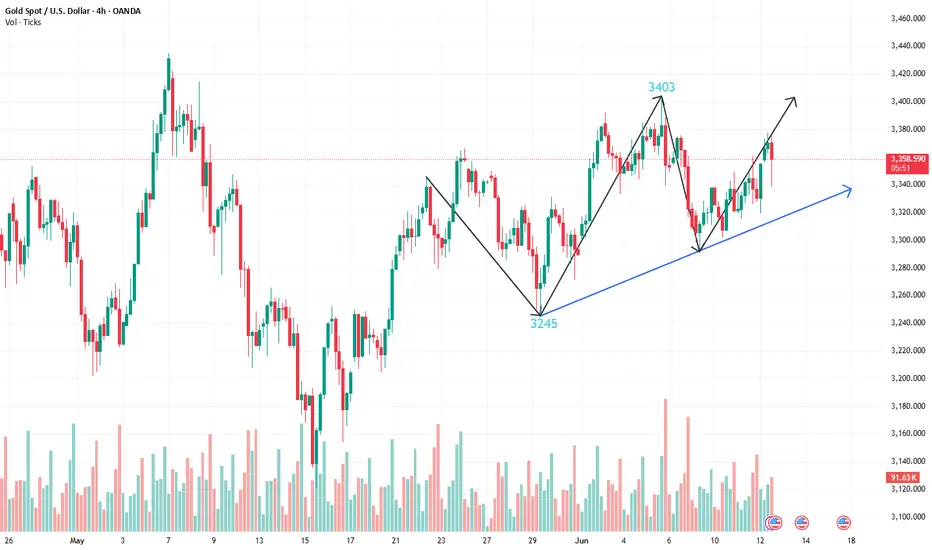
XAU/USD 4H Updated Technical Analysis 06/12/20254H Market Structure & Trend
Gold (XAU/USD) is trading around $3,383, showing a generally bullish market structure on the 4-hour chart. The price has been making higher highs (HH) and higher lows (HL) – a classic uptrend pattern
Recently, bulls broke above a notable resistance level (a Break of Structure, or BOS), confirming continued upside momentum
So far no Change of Character (CHOCH) signal (which would require a lower low to hint at a trend reversal, meaning the uptrend remains intact. Gold is also trading above its daily pivot point (3370), reflecting a bullish intraday bias
Overall, sentiment on the 4H timeframe is positive unless key support levels give way.
Key Support & Resistance Zones (Demand vs. Supply)
Support (Demand Zones): Immediate support lies in the 3355 – 3340 region (marked by S1 and S2). This zone lines up with prior price congestion and is viewed as a demand zone, where buyers have historically stepped in
In fact, multiple support levels cluster here (e.g. previous lows and trendline intersection), creating a broad buy zone. The idea is that as price dips into this area, buy orders are likely waiting, and the deeper it goes into the zone, the more attractive it becomes for bulls
If 3340 fails, the next support is around 3325 (S3), another potential demand area where gold found a footing earlier. Traders will watch these support zones for bullish reversal signals (like a strong bounce or candlestick patterns) to confirm that demand is indeed active. Resistance (Supply Zones): On the upside, initial resistance is seen at 3385 (R1), with a stronger supply zone around 3400 (roughly the R2 3402 level). Here, multiple technical levels overlap – including a recent swing high and a psychological round number. This convergence of resistances creates a supply zone where sellers may be waiting.
As gold approaches 3385–3402, it’s likely to encounter profit-taking or new short positions. If price does punch through 3400, the next resistance is around 3415 (R3), which could attract even more selling interest. Within the 3385–3415 zone, expect price to possibly stall or reverse, unless bulls muster a strong breakout. Traders should be cautious about bullish positions as price nears this supply area, and watch for any bearish reversal clues (like wicks or a double-top) indicating that sellers are active
Fibonacci Retracement Confluence
Recent price swings show Fibonacci retracement levels aligning with the above zones, adding confidence to those areas. For instance, the rally from the last 4H swing low (around 3325) up to the recent high (~3385) has a 50%–61.8% Fibonacci retracement roughly in the 3340–3355 range. Fibonacci levels often pinpoint where price might stall or reverse during a pullback, and indeed this $3,340-$3,355 support zone corresponds to the popular 50%–61.8% retracement band – a prime spot where bargain-hunting buyers could step in.
In an uptrend, a pullback to these Fib levels is considered a healthy correction rather than a trend change. Thus, if gold dips to that area, many bulls will be watching for a bounce. On the flip side, if gold extends higher, Fibonacci extension levels suggest the 3400+ region might be a measured move target (for example, 100% extension of the last pullback lands near 3400). This reinforces that the 3385–3415 supply zone is a critical hurdle. In summary, Fibonacci analysis supports the idea that mid-$3300s is a value zone for buyers, while around $3400 is a potential exhaustion area for the current upswing.
Smart Money Concepts (SMC) Insights
From a Smart Money Concepts perspective, institutional footprints are visible on the chart. The ongoing bullish structure (higher lows, no lower low yet) means no CHOCH (trend change) has occurred
Smart money likely continues to favor longs until a key low breaks. We can identify a possible bullish Order Block in the 3340 area, which is essentially the last small bearish candle on 4H before the strong push up
This order block (an institutional buy zone) overlaps with our demand zone, suggesting big players placed buy orders around 3340. If price revisits that zone, it could ignite another rally as those orders get filled. There are also liquidity considerations in play: Above $3,400, there may be clusters of buy stop orders (from breakout traders or short stops) – what SMC traders call buy-side liquidity.
It wouldn’t be surprising to see gold spike above 3400 to grab that liquidity (stop-loss hunt) before either accelerating higher or sharply reversing. Conversely, below $3,340, many bulls likely have stop-losses (sell orders) – sell-side liquidity resting under support.
A quick dip under S2 (liquidity grab) followed by a recovery would actually be a bullish signature (a bear trap by smart money). However, if price breaks significantly below 3325 and holds, that would mark a bearish CHOCH (first real trend change signal) and indicate the smart money possibly switching to selling rallies. Until then, the path of least resistance is still up. Any fair value gaps (imbalances) left from the rapid rise may exist around 3360 (for example), but so far gold has been backfilling these moves, keeping the trend steady.
Potential Trading Setups (4H Outlook)
Given the above analysis, here are two possible trade ideas on the 4H timeframe – one bullish and one bearish – with high-conviction zones in focus:
Bullish Buy Setup (Buy the Dip):
A pullback into the 3355–3340 support demand zone could offer a buying opportunity. This area has multiple factors of confluence: pivot S1/S2 supports, a Fibonacci 50–61.8% retracement, and an order block. If gold’s price action shows a clear reversal here (for example, a bullish engulfing candle or double bottom on 1H/4H), buyers can consider going long. The upside targets would be a return to 3385 (R1), with stretch targets near 3400–3415 (R2/R3). A prudent stop-loss could be placed just below 3325 (just under S3 and below the demand zone) to avoid a deeper reversal. This setup aligns with the prevailing uptrend (trading with the trend) and aims to “buy low” in the value zone.
Bearish Sell Setup (Sell the Rally):
If gold surges into the 3385–3402 resistance supply zone without slowing, traders should watch for signs of buyer exhaustion. In a still-range-bound market or if momentum wanes near the top, one might consider a short position in this zone if bearish signals emerge (e.g. a 4H shooting star candle, bearish divergence, or a minor BOS downward on lower timeframe). The idea is that smart money could use the liquidity above 3385/3400 to sell into. Initial downside targets could be the pivot area around 3370 and then the 3355 support. A stop-loss would ideally be just above 3415 (clear of the R3 level), in case gold breaks out to new highs. This counter-trend style trade is riskier since the 4H trend is up, so it’s crucial to wait for confirmation of a reversal before selling. Essentially, you’d be selling high at known resistance, but only if the market shows it can’t push further.
Both setups hinge on patience and confirmation. Rather than blindly picking tops or bottoms, let the price action confirm that the zone is holding. Remember that support and resistance levels are zones, not exact lines – price can wick through slightly before reversing. Always manage risk carefully.
Key Levels Snapshot
Pivot: 3370
R1: 3385 – R2: 3402 – R3: 3415
S1: 3355 – S2: 3340 – S3: 3325 These levels are derived from the classic pivot point formul, using recent price data. The pivot point at 3370 is the average of the previous session’s high, low, and close.
Trading above this pivot supports a bullish bias, while below it turns the bias bearish.
The R1/R2/R3 levels mark successive resistance hurdles above the pivot, and S1/S2/S3 mark support floors below it. Traders often use these as guideposts for intraday moves.
Takeaway:
Gold’s 4H chart shows bullish momentum with key support in the mid-$3300s and resistance near $3400. It’s wise to trade the reaction at these zones – buy dips near support in an uptrend, or sell rallies at resistance if momentum fades. In all cases, wait for price to confirm direction and stick to your trading plan. Happy trading!
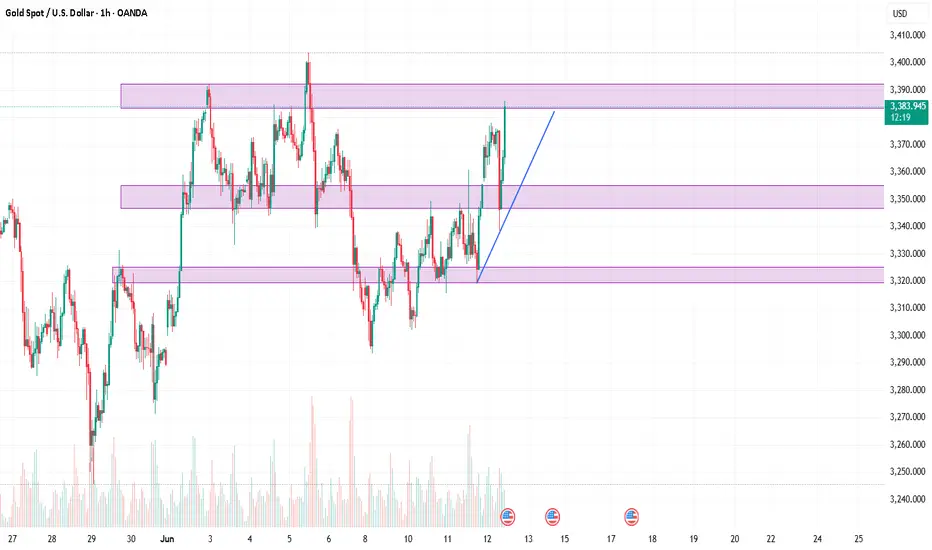
Gold 200% Trading SignalsI'm provided, here’s a breakdown of the buy trade setup and potential Take Profit (TP) levels for XAU/USD (Gold) on the 1-hour timeframe:
🟢 Buy Setup Summary:
Pattern Identified: Bullish wedge (indicates potential breakout upward).
Support Trend Line: Clearly marked under price, showing consistent higher lows.
Breakout Zone: Around 3,378.463 (current resistance area).
Setup Trigger: Buy after bullish breakout above resistance (3,378 area).
📌 Buy Entry:
Entry Price: After confirmed breakout and retest of resistance around 3,378.
🎯 Take Profit (TP) Levels:
1. TP1: 3,390 (psychological round number + minor resistance zone
2. TP2: 3,410 (intermediate resistance)
3. TP3 (Final Target): 3,450 (as per chart label: ~1000 pips move
🔒 Stop Loss (SL):
Below the wedge pattern, possibly at 3,295–3,305, depending on your risk tolerance.
🔁 Trade Management:
Consider trailing SL once TP1 is hit.
Watch for price action around TP1 and TP2 for partial profits or exit signs.
Be cautious around news events that could impact Gold prices (e.g., FOMC, CPI, etc.).
Let me know if you want this translated into a MetaTrader or TradingView script, or help setting alerts for each TP.

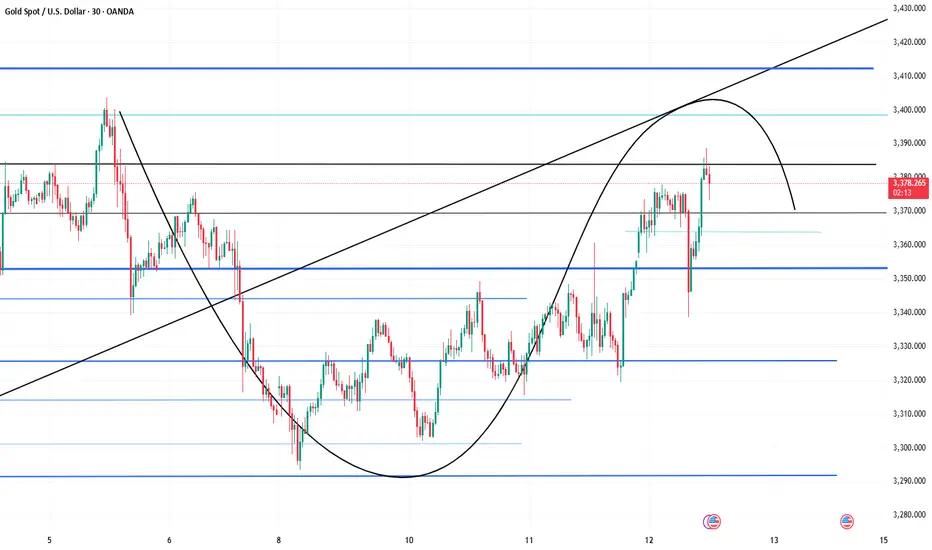
Gold 100% Trading SignalsAfter the changes in the first four trading days of this week, everyone is convinced that gold will rise after adjustment. Now that the trend has been strengthened, today we will discuss where the strength of this bullish trend can reach this week. This week, it has been emphasized that the expected rising space within the week will be 3370-3400. It has almost reached 3375. The target of the next wave of gold rise is 3400.
From a technical point of view, the daily line appeared on Wednesday, standing firmly above the middle track of Bollinger, and the moving average system diverged upward. In the 4-hour chart, the golden cross of the random indicator MA5-MA10 continued, which was good for intraday fluctuations and rises; MACD continued to hit the red kinetic energy column. In terms of form, it continued to rise slowly, which was a bullish signal; then it is expected to rise to the upper track high of Bollinger near 3400 under strong pressure. After this round of rising and pulling up, Bollinger opened in the 4-hour chart. Today may be a one-sided trend, and the intraday support is near 3342. After adjusting to 3342 during the day, you can go long and see today's rising space.
Gold operation strategy: It is recommended to go long at 3345-3350, stop loss at 3340, target at 3360-3370; it is recommended to go short at 3400, stop loss at 3410, target at 3380-3370.
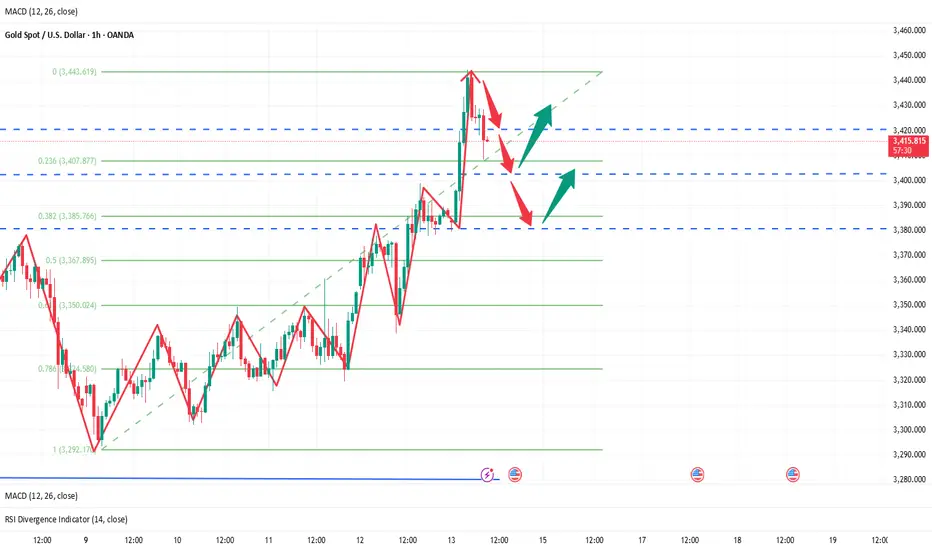
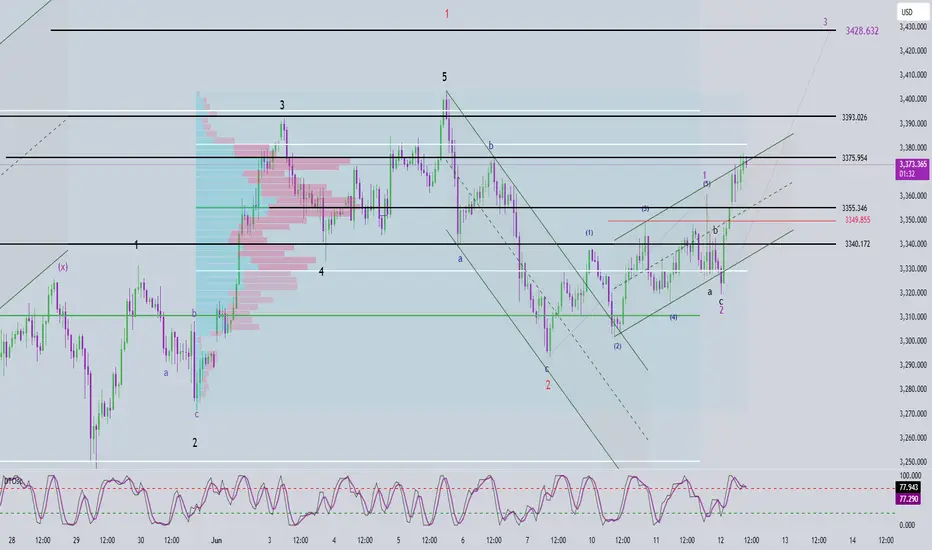
Elliott Wave Analysis – XAUUSD (June 12, 2025)🌀 Wave Structure
According to yesterday's plan, the green abc corrective wave likely completed around the 3293 level. The subsequent bullish move is considered Wave 1 in a triangle form, and last night’s news helped Wave 5 hit the target, yielding over 200 pips in profit.
After that, price corrected in a black abc structure. Although the CPI release printed a sharp H1 wick (alongside overlapping waves supporting sellers), the price reversed sharply to the upside — further reinforcing the idea that the correction phase has ended.
Currently, price is testing the previous green Wave b high at 3375.954. A break and close above this level could strengthen the bullish wave scenario. If Wave 1 is indeed a triangle, Wave 3 may extend strongly, with a potential upside target near 3428.
In the short term, price may be forming Wave 1 within Wave 3, and we are watching two key zones:
3358 – 3355
3390 – 3393
⚠️ If price breaks and closes below 3350, the current wave count will be invalidated, and we will shift to a deeper corrective scenario. I will update accordingly to avoid confusion.
🔍 Momentum Outlook
D1: Momentum is rising, supporting the continuation of Wave 3 into next week.
H4: Still bullish; needs 1–2 more candles to reach the overbought zone.
H1: Currently overbought → possible pullback if price hits the 3390–3393 resistance.
⏱️ Bearish momentum reversal at 3390–3393 → confluence zone for a SELL setup
⏱️ Bullish momentum reversal at 3358–3355 → confluence zone for a BUY setup
🎯 Trading Plan
BUY ZONE: 3358 – 3355
SL: 3348
TP1: 3375 | TP2: 3389
SELL ZONE: 3390 – 3393
SL: 3404
TP1: 3375 | TP2: 3358
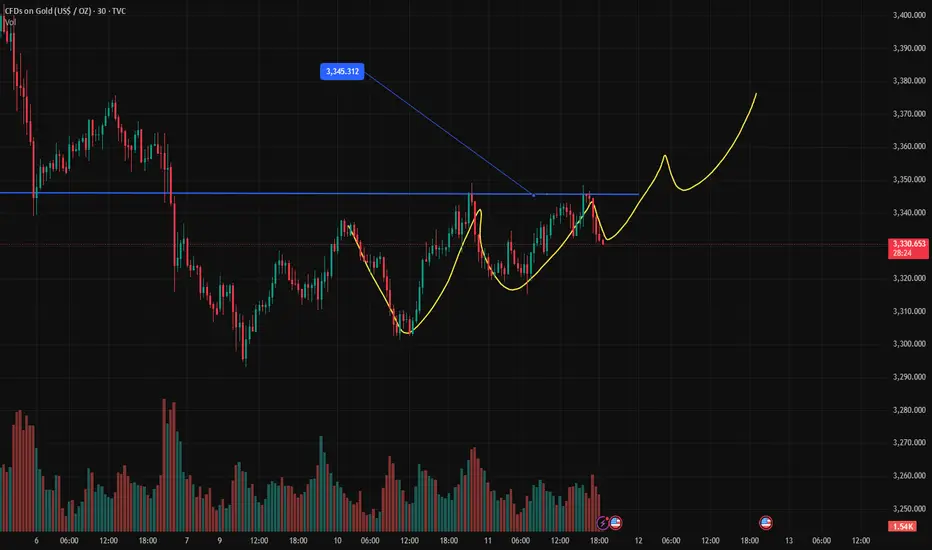
Repeated sweeps, gold trend analysis and operation layout📰 Impact of news:
1. Pay attention to the initial unemployment claims data
📈 Market analysis:
Gold price jumped higher in Asian session. The short-term upper pressure is at 3375. Once it breaks, the upward route of bulls will be opened. The RSI indicator in the 1H chart began to retreat after touching the overbought area. Last night's high of 3360 is now a breakthrough, and the previous strong suppression is at 3350. This morning's Asian session was also broken and stabilized. Then 3360-3350 has changed from a suppression position to a support position. Therefore, the next position we should pay close attention to should be around 3360-3350. If it can fall back to 3360-3350 in the future, it is possible to enter the market to do more, but at the same time, it is also necessary to defend 3345. Independent trading requires a SL.
🏅 Trading strategies:
BUY 3360-3350
TP 3370-3380-3400
If you agree with this view, or have a better idea, please leave a message in the comment area. I look forward to hearing different voices.
TVC:GOLD FXOPEN:XAUUSD FOREXCOM:XAUUSD FX:XAUUSD OANDA:XAUUSD
