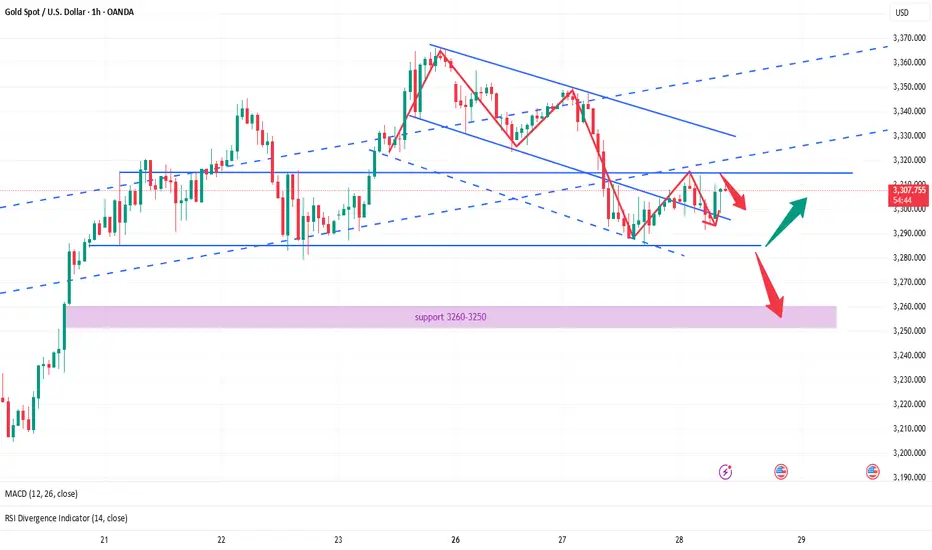
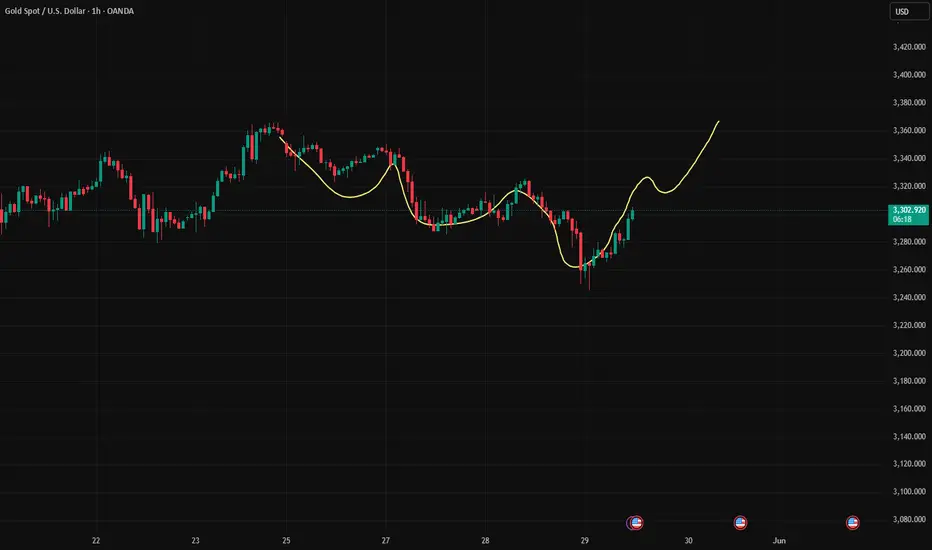
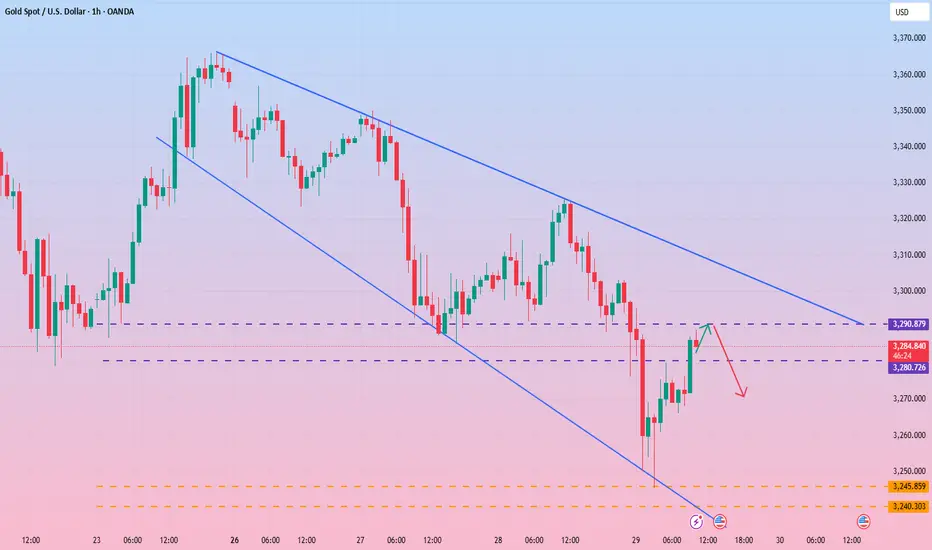
GOLD Intraday Chart For H1 30 May 2025Good Morning Traders,
As you can see that there are some strong zones mentioned on chart,
For Intraday all eyes between 3280-3300 zone,
If market clearly goes below 3280 then it will move towards 3250 else market sustains above 3280 it will move towards 3300 and after clear breakout of 3300 then move towards 3325 initially
Furthermore you can read the chart details carefully, Remember, Always Trade with SL
Today US PCE PRICE INDEX due today
Monthly Closing Due Today as well
Disclaimer: Forex in Risky
Xauusdupdates
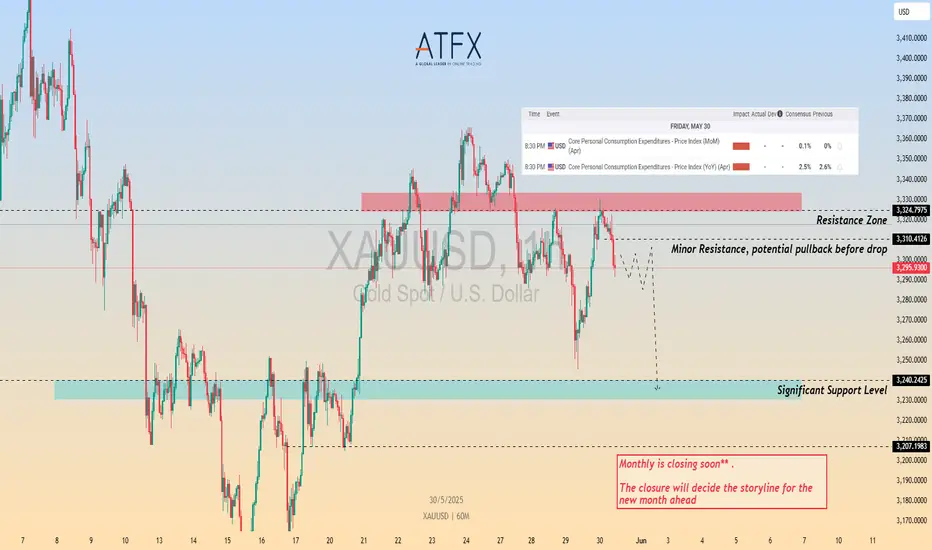
XAU/USD Awaits PCE Catalyst – Rejection or Breakout?Gold prices are trading around $3,297 after rejecting the $3,324 resistance zone. The market is currently showing signs of exhaustion near a minor resistance, and price action suggests a potential short-term pullback. Attention now shifts to today's U.S. Core PCE data, a key inflation metric for the Fed, which may dictate near-term direction and shape the monthly close.
OANDA:XAUUSD TVC:GOLD Gold tested the $3,324 resistance area but failed to break higher, forming a lower high. A potential bearish setup is developing as price reacts to minor resistance around $3,310. If bears regain control, a drop toward the key support level at $3,240 is likely. A break below this level could open the door to further downside in the upcoming sessions. Conversely, if bulls manage to reclaim $3,324 and establish a strong daily close above, we could see a retest of $3,350 and higher.
Key Event Today:
At 8:30 PM GMT+8, the U.S. will release April's Core PCE Price Index – the Fed’s preferred inflation gauge:
MoM: Expected at 0.1%
YoY: Expected at 2.5% (Previous 2.6%)
A softer-than-expected reading could increase rate cut expectations and offer bullish momentum to gold. Stronger data, however, may renew USD strength and pressure XAU/USD lower.
Resistance: $3,310 , $3,324
Support: $3,240 , $3,207
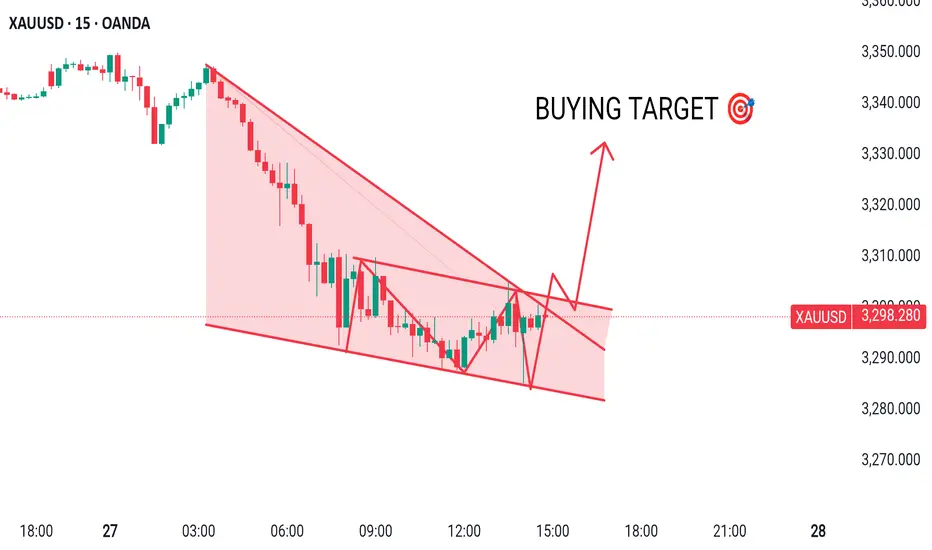
XAUUSD MADE FALLING WEDGE & DESCENDING PATTERNHere I Created This XAUUSD Chart Analysis
Pair : XAUUSD (Gold)
Timeframe: 15 - Minutes
Pattern: FALLING WEDGE
Momentum: BULLISH/ BUY
Entry Level : BUY 3297
SUPPORT zone : 3285
Target Will Be : 3330
Disclaimer : This signal is based on personal analysis for learning purposes. Trade at your own risk and always use proper risk management.
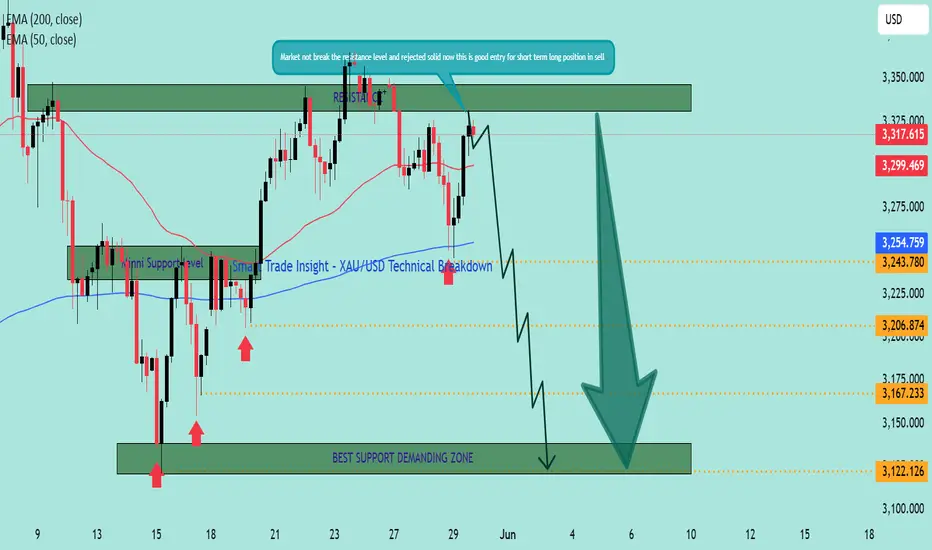
Smart Trade Insight – XAU/USD Technical BreakdownKey Levels & Technical Zones:
🔹 Resistance Zone (🔼 SELL Area):
📌 3,315 – 3,340
This area has been tested and rejected multiple times, as highlighted by the strong bearish wicks. The recent price action failed to break above it, triggering short interest.
🔹 Minor Support Zone:
📌 Around 3,243
Acted as intraday bounce area previously, now likely to offer weak support in the coming move down.
🔹 Major Demand Zone (💚 BUY Interest Zone):
📌 3,120 – 3,140
Labelled as "BEST SUPPORT DEMANDING ZONE" – historical demand visible with strong bounce history. Ideal for monitoring bullish reversal opportunities.
📈 EMA Levels:
🔴 50 EMA: 3,299
🔵 200 EMA: 3,254
Current price action is hovering near the EMAs. The rejection at the resistance while below the 50 EMA indicates weakening bullish momentum.
🔍 Market Structure Overview:
The double-top formation near the resistance shows exhaustion in buying.
Lower highs forming → structure turning bearish short-term.
Solid rejection confirms that this is a valid zone to initiate short positions 🛑📉.
📉 Forecast Path:
🔮 Projected Move:
Price is expected to break below minor support at 3,243.
Intermediate target: 3,206, then 3,167 🟠.
Final destination: Demand Zone at 3,120 – 3,140 🟩 for potential bounce 📈.
💬 "Market not break the resistance level and rejected solid — this is a good entry for short-term sell trades." ✅
✅ Trade Idea Summary:
🟥 Bias: Short
🎯 TP Targets: 3,206 → 3,167 → 3,122
📉 SL Suggestion: Above 3,340 resistance zone
🧭 Risk-Reward Setup: Favorable for short-term traders
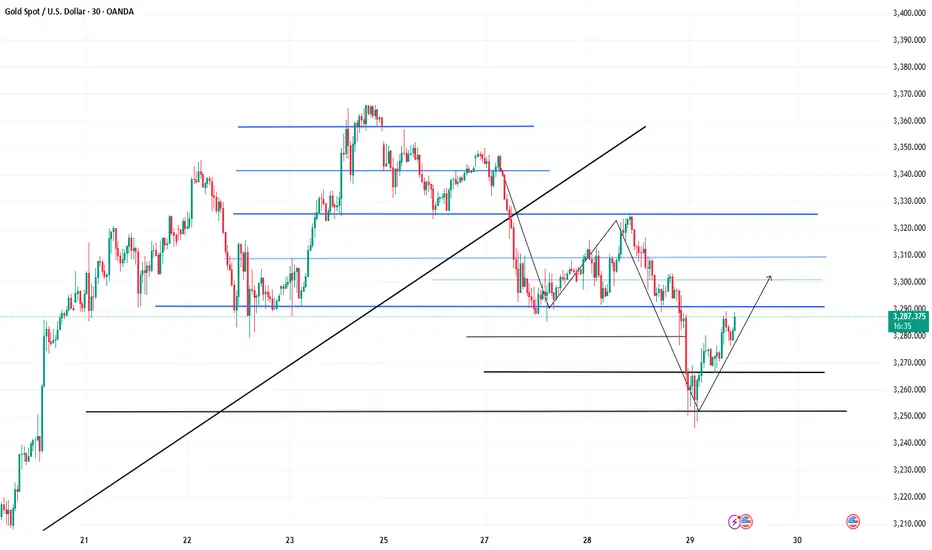
Gold Price Action Update – Smart Dip Buy Pays Off!Yesterday, gold dipped to around 3290, followed by a minor rebound.
Today, as expected, it broke down through the 3280 level decisively—just as we discussed:
🔻 A break below 3280 likely means a gap fill toward 3259.
✅ For those who followed the plan and went long below 3266, the trade worked beautifully—
Gold dropped to a low of 3245, effectively filling the gap, and has since rebounded back to the 3280 area.
📈 What’s next?
Now that the gap is filled, gold is likely to retest the $3300 zone in the short term.
With price currently around 3280, there is still room to the upside.
➡️ If you're holding long positions, you can consider holding a bit longer for potential further gains.
🚨 BUT—this was only a single bottom test.
That means there's still a chance of a second dip before the trend fully reverses. So:
🛡 Risk management remains crucial.
If you're okay with some profit pullback, it's fine to stay in.
If not, consider securing partial profits and setting trailing stops.
🎯 Key levels to watch:
🔼 3300 – Main resistance zone; focus on whether it breaks or rejects;
🔽 3276–3263 – Support range on any pullback; good zones to watch for fresh entries if support holds.
📌 Trading Strategy Outlook:
For now, continue to buy on dips as long as support holds, and monitor 3300 resistance closely.
If price fails to break above, we may see a pullback—but as always, with proper planning, we stay profitable.
Gold drops to support then rebounds; 3325-3330 key bull-bear levAnalysis of Today's Gold Volatility 🔥
The ruling on Trump's tariff overreach and the Fed's cautious stance on rate cuts have delivered a double blow 💥, instantly "freezing" market risk aversion 🧊! Gold prices plunged to a low of 3245 intraday, with the 3245-3250 zone acting as a "safety air cushion" 🛡️ that firmly halted the decline. The price is now rebounding to test resistance near yesterday's high, where the 3325-3330 level has become a "life-or-death line" ⚔️ for bulls and bears, with a showdown imminent!
Trading Strategies (Emoji Signal Guide 📌)
1. Short on Rebound 🚀➡️📉
Entry: Lightly short in the 3325-3330 range (Bearish "sniper zone" 🎯)
Stop Loss: 3335 (Break above resistance? Run 🏃♂️!)
Targets:
First target: 3280 (Bearish "first charging station" 🔋)
Second target: 3250 (Test support validity 🔍)
2. Long at Support 📉➡️📈
Entry: Lightly long after stabilizing above 3250 (Bullish "rally call" 📢)
Stop Loss: 3240 (Break below support? Retreat fast 🚑!)
Targets:
First target: 3280 (Rebound "mini-peak" ⛰️)
Second target: 3300 (Challenge "mid-fortress" 🏰)
Risk Warning ⚠️: Beware of volatile swings from Fed speeches! Exit immediately if prices break above 3330 or below 3240. Control positions and avoid emotional trading 🚗💨!
Professional trading strategies are pushed daily 📊
Lock in precise signals amid market fluctuations 🚀
Confused about market trends? Stuck in strategy bottlenecks?
Real-time strategies serve as your "trading compass" 🌐
From trend analysis to entry/exit points, dissect market logic comprehensively
Refer now 📲
Help you move steadily forward in investments ✨
👇👇👇
XAUUSD trading plan for the London market.After buying at a low level yesterday, the market rebounded and continued to fall. Today, the Asian market hit a low of 3208.
At present, geopolitical uncertainties are increasing. I think buying is still a reasonable choice. Buy near 3210-3200. The target is 3235-3248. It is necessary to observe whether the target is stabilized.
Remember to control trading risks when trading independently.
XAUUSD buying opportunitiesToday, I am adapting to low buy operation again. Yesterday, the lowest price in New York market reached 3278, and today the lowest price in Asian market hit the low near 3245. But with the addition of buy orders, the profit has expanded a lot again.
XAUUSD market quotation is 3298. This position can still be arranged for buying. Do not trade independently. Remember to leave me a message. Pay attention to the subsequent precise trading opportunities.
Gold Drops to 3250 – Sell-the-Spike Strategy Still in Play🕰️ What Happened Yesterday
In yesterday’s analysis, I argued that the 3320–3330 zone should act as a strong sell zone, with a target down at the 3250 support.
Gold respected the plan perfectly: it dropped from the 3325 area straight into 3250 during the Asia session, hitting the target with precision(700+ pips)
At the time of writing, Gold is now bouncing, which is normal, trading around 3280.
❓ Correction Done or More to Come?
While the bounce to 3280 may look promising for bulls, my opinion remains unchanged: this is still a market to sell rallies, not to buy dips.
🔎 Why I Still Expect a Deeper Drop
- Old support becomes resistance – The 3280–3285 zone, once support, is now acting as resistance. That zone is currently being tested.
- Double resistance near 3300 – Just above, we have the psychological 3300 level, reinforced by the falling trendline coming from recent highs.
- Momentum still favors the downside – Unless bulls can reclaim and hold above 3300, this rebound is nothing more than a dead-cat bounce.
📉 Trading Plan
I remain in sell-the-spike mode. Any move into 3285 or 3300 is an opportunity to enter short, with stops above the trend line or yesterday's high.
If price breaks back below 3265, the probability increases for a new local low under 3250, probably to the next one around 3215.
✅ Final Thoughts
Yesterday’s setup worked perfectly — and the plan doesn’t change just because of a small bounce.
The market needs to prove it can break key resistance before shifting bias.
Until then, this remains a sell-on-strength market. Let the trades come to you. 🚀
Disclosure: I am part of TradeNation 's Influencer program and receive a monthly fee for using their TradingView charts in my analyses and educational articles.

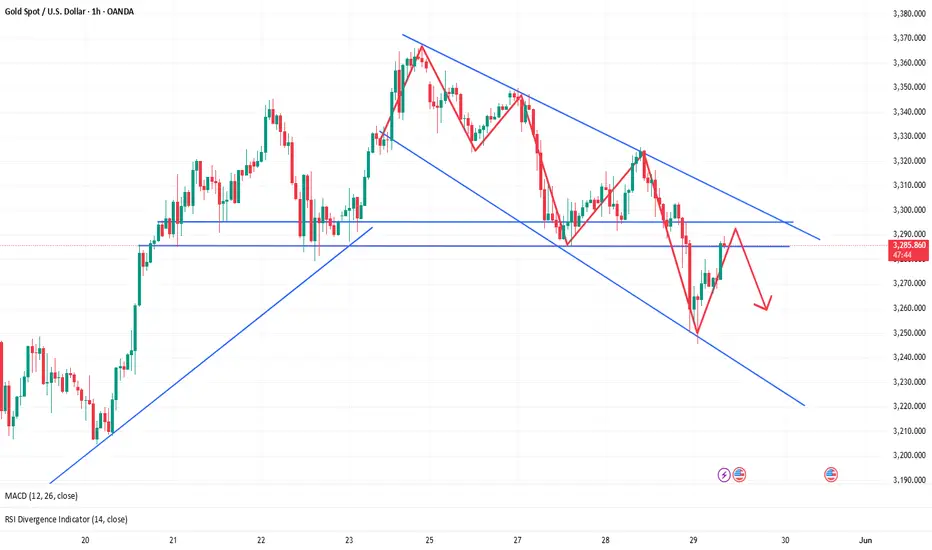
Top and bottom conversion, short position continues?📰 Impact of news:
1. The International Trade Court ruled that Trump exceeded his authority, and the previous tariffs may be suspended
2. Ukraine submitted a ceasefire document to Russia
3. Pay attention to the initial jobless claims data during the US trading session
📈 Market analysis:
The U.S. Court of International Trade in Manhattan blocked Trump’s “Liberation Day” trade measures, ruling that Trump had overstepped his authority by imposing sweeping tariffs on countries that export more to the United States than they import without authorization from Congress. This means that most of Trump's tariffs will be suspended. But at the same time, the recent geopolitical impact cannot be ignored. In addition, the initial jobless claims data will be released during the U.S. trading session today. Independent traders must set stop losses.
From a technical point of view, the 1H level chart of gold shows that the Bollinger Bands open downward, and the gold price is near the lower track, showing a weak pattern in the short term. Considering that 3285 is the previous low point, there is also a possibility of suppression at 3285. Therefore, we should pay close attention to the resistance range of 3285-3295. If the gold price in the Asian and European sessions can stabilize below 3295, then we can rely on the 3285-3295 range to enter the market and short. On the contrary, if the pullback today stands above 3300, then we should not chase the short easily.
🏅 Trading strategies:
SELL 3285-3295
TP 3270-3260-3250
If you agree with this view, or have a better idea, please leave a message in the comment area. I look forward to hearing different voices.
OANDA:XAUUSD FX:XAUUSD FOREXCOM:XAUUSD FOREXCOM:XAUUSD FXOPEN:XAUUSD TVC:GOLD
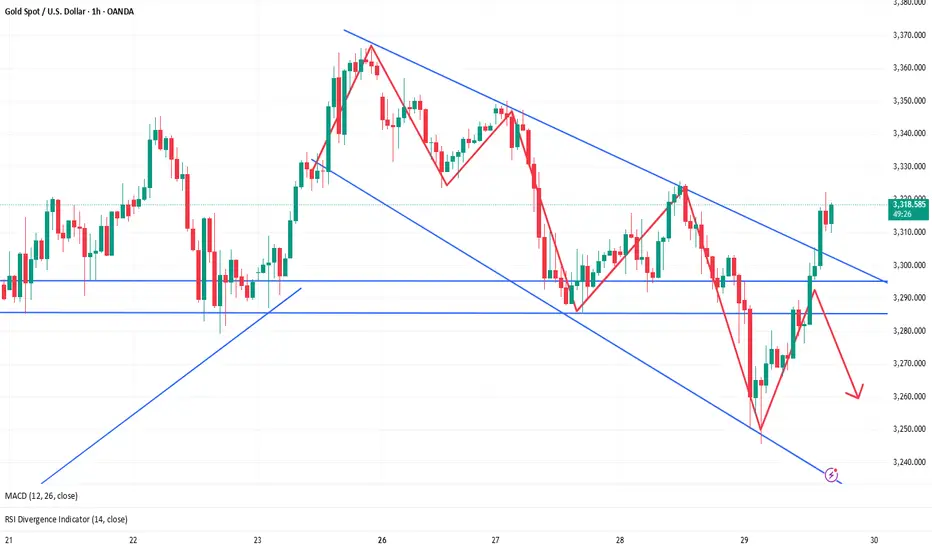
Analysis and layout of gold trend in the US market📰 Impact of news:
1. Initial jobless claims data is positive
2. The White House is tough on the court ruling: Trump will win! Three trade agreements are close to being reached
📈 Market analysis:
I think the current rebound should not be directly judged as a unilateral trend. From a technical point of view, in the 4H cycle, the upper 3320-3325 line has a certain suppression force in the short term. If the gold price runs below 3325, we need to be alert to the risk of a high rebound. We can try to arrange short orders based on the 3320-3325 range, and bet on the high selling opportunities in the volatile market. Independent trading with a good stop loss. However, it should be noted that if the price quickly breaks through the 3330 line in the short term and stands above it, it is expected to rise to the 3340-3350 area. At the same time, I think the support below can first look at the 3300 line, with a focus on the 3290-3285 line support.
🏅 Trading strategies:
SELL 3320-3325
TP 3310-3300
BUY 3295-3285
TP 3300-3310-3320
If you agree with this view, or have a better idea, please leave a message in the comment area. I look forward to hearing different voices.
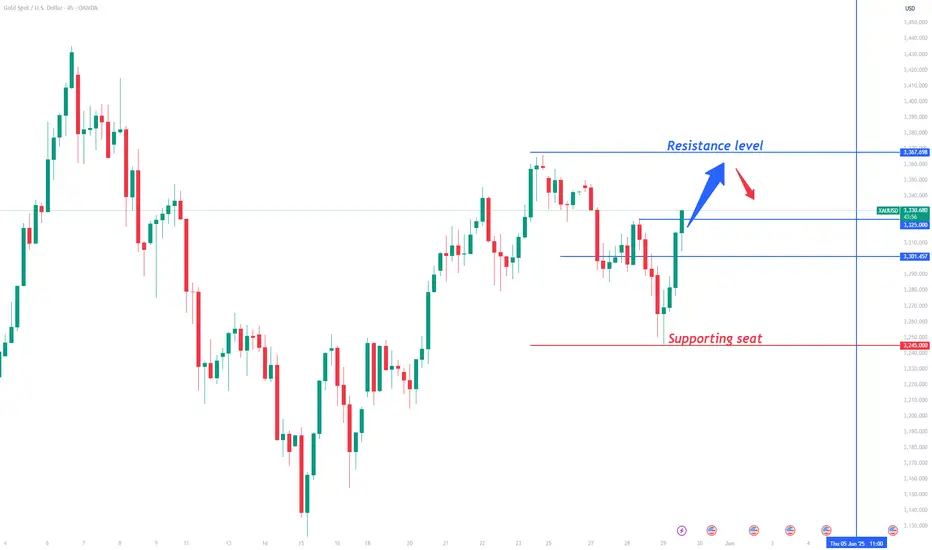
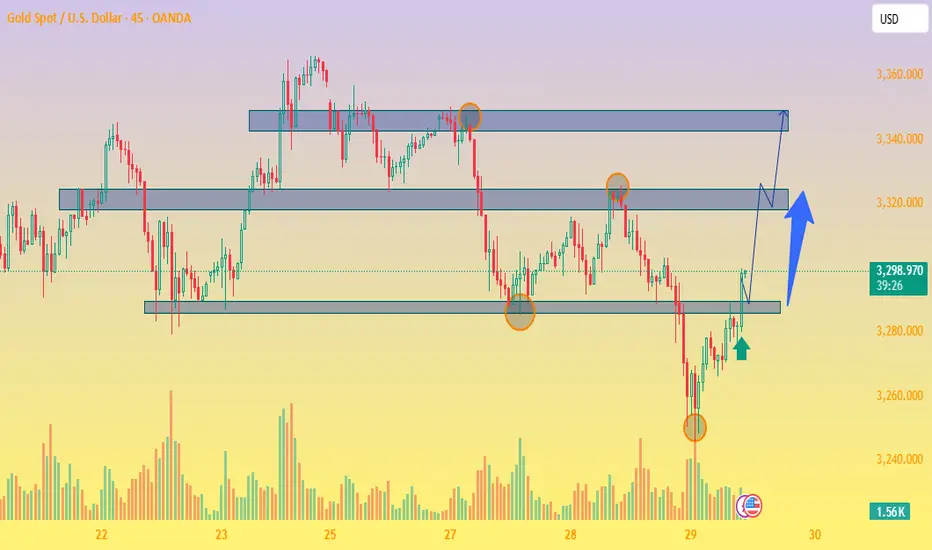
XAU/USD on the 45-minute timeframeSupport Zone Rejection (around 3,250 USD):
Price sharply reversed after testing a key support area (highlighted with a circle).
Volume increased at the reversal point, signaling strong buyer interest.
Break Above Minor Resistance (~3,280 USD):
Price has broken above the immediate resistance level with strong bullish momentum.
A bullish candle has closed above this zone, indicating a potential continuation.
Next Target Resistance Zones:
First Target: Around 3,320 USD, which aligns with a previous structural high and supply zone.
Final Target: Around 3,345–3,350 USD, representing a major resistance zone and previous swing high.
Trade Plan:
Entry: Above 3,280 (already in motion).
Target 1: 3,320
Target 2: 3,345–3,350
Stop Loss: Below 3,260 (below recent low and support zone)
Bullish Structure:
Higher low has been established.
Momentum is supported by volume confirmation
Gold's rebound is weak and the bearish trend is dominant.The 1-hour gold chart shows that the Bollinger Bands open downward, and the gold price is running near the lower track, with a weak short-term trend. If it fails to rebound effectively and break through the 3290 line, the support below will focus on the 3240-3230 area. Overall, the gold price fluctuates downward, the moving average system is in a short position, and the downward pressure is further revealed. It is currently recommended to continue to maintain a high-altitude thinking and focus on short-selling opportunities after the rebound.
In the short-term operation of gold during the day, rebound short-selling is the main focus. Pay attention to the pressure level of the 3290-3280 area above, and the support level of the 3240-3230 area below. In terms of operation strategy, it is recommended to arrange short orders when the gold price rebounds to the 3280-3290 range. This is a key pressure area, and it is necessary to pay attention to the market reaction in this range.
XAUUSD Analysis todayHello traders, this is a complete multiple timeframe analysis of this pair. We see could find significant trading opportunities as per analysis upon price action confirmation we may take this trade. Smash the like button if you find value in this analysis and drop a comment if you have any questions or let me know which pair to cover in my next analysis.

5/29 Gold Analysis and Trading SignalsGood morning everyone!
Yesterday, gold rose first and then declined. Our long positions targeting 3318–3326 were completed successfully, and we timely shifted to short positions, resulting in another round of solid profits.
📉 Technical Outlook:
Gold remains in a bearish trend, and is now very close to the 3275 support level. Based on the current price structure, a break below this level is highly probable.
If $3275 is breached, focus on key support at 3258–3238
Resistance levels to watch: 3298–3318
The daily (1D) chart is currently in an indicator correction phase, so today's trading bias is selling from higher levels
🗞 News Focus:
Watch for U.S. initial jobless claims data today. It may offer short-term support for gold, but is unlikely to reverse the broader bearish trend.
📈 Today’s Trade Plan:
📉 Sell in the 3316–3328 zone (resistance zone)
📈 Buy in the 3245–3232 zone (key support area)
🔁 Scalp/flexible trading levels:
3303 / 3288 / 3276 / 3258 / 3247
Stay adaptive and combine news with price action at key levels for best results.
Wishing everyone a successful and profitable trading day!

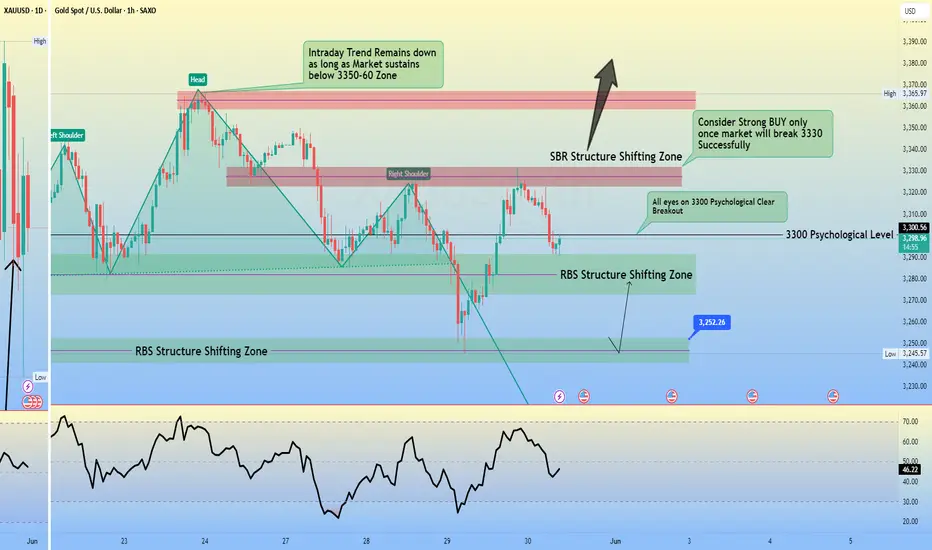
GOLD H1 Intraday Chart Update For 29 May 2025As you can see that there are some strong zones mentioned in chart
Intraday Trend remains down because market sustains below 3300 Psychological level
once market will break 3300 psychological level successfully then move towards 3335
Scalping Range is 3250-3280
if Market breaks 3250 level it will move towards 3200
Disclaimer: Forex is Risky

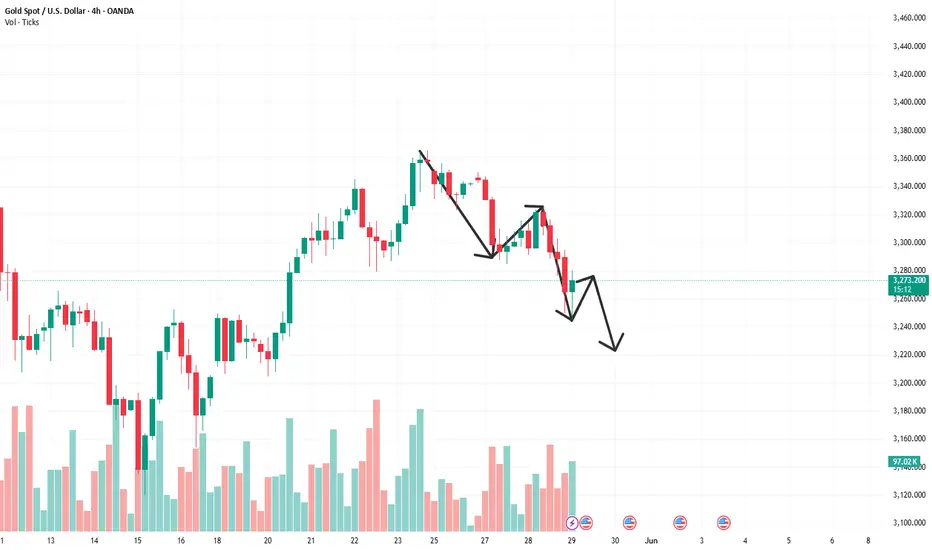
Gold 100% Trading SignalsFrom the 4-hour analysis, today's upper resistance is around 3288-95, the short-term short-term weak dividing line is 3300-10, and the short-term support below is 3240-45, maintaining the main tone of participating in the trend unchanged.
Gold falls back to 3258-3264, buy more when it falls back to 3240-45, stop loss at 3233, target at 3280-3285, break to 3300-05

Gold bears will dominate the marketFrom the market point of view, the delay of the Fed's policy shift and the mitigation of geopolitical risks have a double-kill effect: on the one hand, high interest rates limit the attractiveness of gold; on the other hand, the retreat of safe-haven buying has intensified selling pressure. In the short term, pay attention to the support of the 3240-3250 range. If it fails, it may drop to the psychological level of 3200; but after oversold, be wary of technical rebounds. The 3280-3300 line above will become a key resistance. Be cautious in chasing orders, and the trend is mainly rebound shorting.
Gold recommendation: short near the rebound of 3282-3287, stop loss 3295, target 3253
Fed Uncertainty and Rejected Trendline ResistanceOANDA:XAUUSD TVC:GOLD Gold trades around $3,270 after rebounding from the $3,240 support zone, but remains capped below the $3,287–$3,290 resistance zone, which now acts as resistance after the breakdown. Technically, the price is struggling under a descending trendline (TL2), and the $3,287 zone also aligns with previous support turned resistance.
Fundamentally, the rejection of Trump's “Liberation Day” tariffs by the U.S. trade court helped ease risk sentiment, reducing safe-haven demand and pressuring gold. At the same time, market focus shifts to today’s U.S. GDP data and Friday’s Core PCE inflation report—both of which may sway Fed expectations and drive short-term volatility.
If XAU/USD fails to break back above $3,287, a renewed test of the $3,240 breakout zone is likely. Sustained downside may open the path to $3,207 or lower. On the upside, reclaiming $3,290 would weaken the bearish bias and challenge the TL2 trendline.
Resistance : $3,287 , $3,302
Support : $3,240, $3,207

Gold Bull vs. Bear Battle: Trading Guide Between Support at 32804-hour chart bullish trend, support at 3280-3285, resistance at 3360 ⭐️.
Long Positions:
Go long on pullback to 3280-3290 📊🎯.
Stop loss: 3270
Targets: 3320 → 3330
Add positions if price holds above 3330 🌟.
Targets: 3350 → 3360
Short Positions:
Short on rally to 3350-3360 ⚠️📉.
Stop loss: 3370
Targets: 3330 → 3320
Risk Control:
Always use stop loss and take profits in batches ✨.
Professional trading strategies are pushed daily 📊
Lock in precise signals amid market fluctuations 🚀
Confused about market trends? Stuck in strategy bottlenecks?
Real-time strategies serve as your "trading compass" 🌐
From trend analysis to entry/exit points, dissect market logic comprehensively
Refer now 📲
Help you move steadily forward in investments ✨
👇👇👇

5/28 Gold Analysis and Trading SignalsGood morning everyone!
Yesterday, gold saw a sharp downward move, and we profited well by trading short based on the double-top pattern.
Yesterday, gold has reached the 3287 support area, and by the end of the U.S. session it rebounded slightly above 3300. Although the rebound lacks strong momentum, it does show that the support zone held on the first test. Whether the bulls can take back control depends heavily on today's follow-up strength.
📊 Key Technical Levels:
If bulls break above and hold 3323–3336, a bullish reversal is likely;
If the bounce is weak, short positions remain the preferred strategy;
4H support: 3268
Daily support: 3172
Before that, 3301–3275 also forms an important support zone;
If price breaks below 3301–3275, especially under negative news impact, a drop to 3150 or even 3100 is not out of the question.
🗞 Key News Focus Today:
Watch for May FOMC-related remarks during the U.S. session, which could become a catalyst for major market movement.
📈 Today’s Trading Plan:
📉 Sell in the 3342–3362 zone (strong resistance)
📈 Buy in the 3258–3248 zone (strong support)
🔁 Flexible intraday levels to monitor:
3336 / 3328 / 3319 / 3306 / 3295 / 3286 / 3274 / 3266
Stay sharp and combine technicals with key news events to make informed trades. Feel free to reach out if you need support — wishing you a profitable day ahead!

Elliott Wave Analysis – XAUUSD Trading Plan | May 28, 2025
🔍 Current Wave Structure
Following yesterday’s sharp decline, price has made a mild recovery and is currently consolidating around the 3314 area. The drop has nearly reached the projected wave C (green) target, but the current rebound — with overlapping small H1 candles — suggests the bullish structure is still unconvincing.
We’re now monitoring two potential scenarios:
✅ Scenario 1 – Correction Completed
Wave C appears to be complete, and the market may be entering a new bullish trend.
However, the overlapping candles on H1 hint that this could be a leading diagonal (wave 1).
In this case, a deeper pullback (wave 2) is expected — likely forming a zigzag or flat correction.
📌 Strategy:
Wait for wave 2 to complete before looking for a better Buy entry.
🌀 Scenario 2 – Ongoing Correction
If price continues to move sideways, we may be in wave b of a double zigzag correction (wave Y).
🎯 Wave c target within wave Y: 3324
If price breaks below 3284 before reaching 3324, wave c may have already started and could complete around 3280–3274.
📈 Momentum Outlook
• Daily (D1): Momentum remains bearish → primary trend still leans downward
• H4: Bullish momentum → short-term recovery possible today
• H1: Near oversold → watch for bullish reversal signals in current zone for intraday Buy setups
🎯 Trade Plan
⏰ Intraday Buy (Scalp):
• Entry: 3292 – 3289
• SL: 3282
• TP1: 3313
• TP2: 3324
🕰️ Ideal timing: During the London session to end of New York session
🎯 Swing Buy Setup:
• Entry: 3280 – 3277
• SL: 3270
• TP1: 3290
• TP2: 3313
• TP3: 3324
🕰️ Ideal timing: European to late US session
🎯 Sell Zone: 3324 – 3327
• SL: 3334
• TP1: 3313
• TP2: 3290
• TP3: 3280
🕰️ Best considered if price reaches resistance during US session or late EU session
📌 All scenarios will be updated once wave 2 is confirmed or price decisively breaks below 3284.
Be patient — let the market give you clear signals before taking action.

Key data will be released, gold will usher in a turning point🗞News side:
1. Musk issued the "strongest" condemnation of Trump
2. Trump and Netanyahu failed to reach an agreement, and the US-Iran negotiations may be "disrupted" by Israel
📈Technical aspects:
Gold prices continued to fall this week as Trump extended the impact of increasing tariffs on the European Union. After stabilizing at 3285 and rebounding yesterday, the gains and losses at 3315 during the day are the key to the subsequent layout. The current Asian session did not stand above 3315 in the morning, which means that the short-term retracement and decline have not ended, and only by breaking through 3315 can there be a chance to continue upward. The 4H level of gold is not so strong at present. The market encountered resistance and fell back at the upper track. Now the market has touched the lower track. The Bollinger Bands have not opened and are still flat, indicating that the market is in a volatile trend in the short term. The support below 3280 just coincides with the lower track. The upper side pays attention to the resistance near the middle track of 3325. If the pressure near the middle track of 3325 is broken, it can be seen to the upper track of 3365. If the market breaks below 3280, it is expected to go to 3260-3250. The European session will temporarily maintain a high-altitude low-multiple cycle. Pay attention to 3315-3325 on the upper side and 3285-3280 on the lower side.
If you agree with this view, or have a better idea, please leave a message in the comment area. I look forward to hearing different voices.
OANDA:XAUUSD FX:XAUUSD TVC:GOLD FXOPEN:XAUUSD FOREXCOM:XAUUSD