gold on sell#XAUUSD is trying to correct back above week high 3345 but unfortunately it's need a breakout above the today high to continue.
Below the 3322 breakout shows a strong fall on which target till 3286, stop loss 3331.
Above the 3335 shows a bullish range which will reach 3344, around 3344 will either decline and head sell or reach the 3367 limit. Below 3312 shows another bearish continuation but multiple breakout will decide.
Xauusdupdates

Gold top profit signalsThe market fluctuated upward all the way on Friday, opening at 3295, hitting the lowest point of 3287 and bottoming out. So far, it has hit the highest point of 3334 and then fluctuated at 3330. The recent market fluctuations are relatively large, and they are completely within our expectations. Yesterday, on Thursday, we gave a short position at 3340-45, and the actual market was directly short at 3341, long at 3380-85, and long at 3390-93. The long position target is 3300-06. Judging from the current trend, gold may still have high points. It is only a matter of time before the 3334 line breaks through. From the perspective of the operation trend, we continue to focus on buying on pullbacks
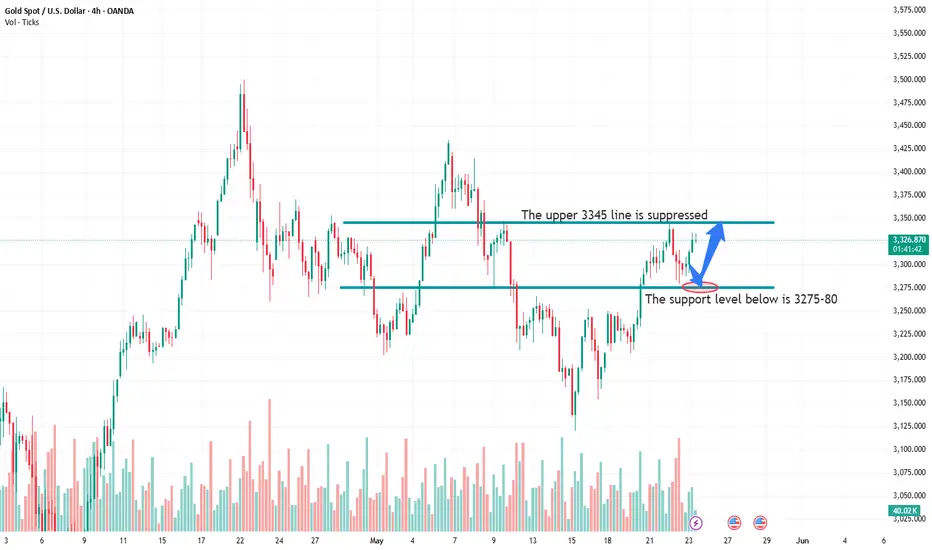
From the 4-hour market analysis, the upper focus is on yesterday's high pressure of 3345, and the lower support is 3286-90. For the time being, we will rely on this range to maintain the main tone of low-long participation. In the middle position, we will watch more and do less and be cautious in chasing orders.
Gold rebounds to 3286-3295 line and goes long, stop loss 3277, target 3326-3330 line, break to 3340-45 line;
Gold rebounds to 3340-45 line but does not break, you can go short lightly, stop loss 3353, target 3300-3306 line, continue to hold if break
Gold 100% Profit SignalThe market fluctuated upward all the way on Friday, opening at 3295, hitting the lowest point of 3287 and bottoming out. So far, it has hit the highest point of 3334 and then fluctuated at 3330. The recent market fluctuations are relatively large, and they are completely within our expectations. Yesterday, on Thursday, we gave a short position at 3340-45, and the actual market was directly short at 3341, long at 3380-85, and long at 3390-93. The long position target is 3300-06. Judging from the current trend, gold may still have high points. It is only a matter of time before the 3334 line breaks through. From the perspective of the operation trend, we continue to focus on buying on pullbacks
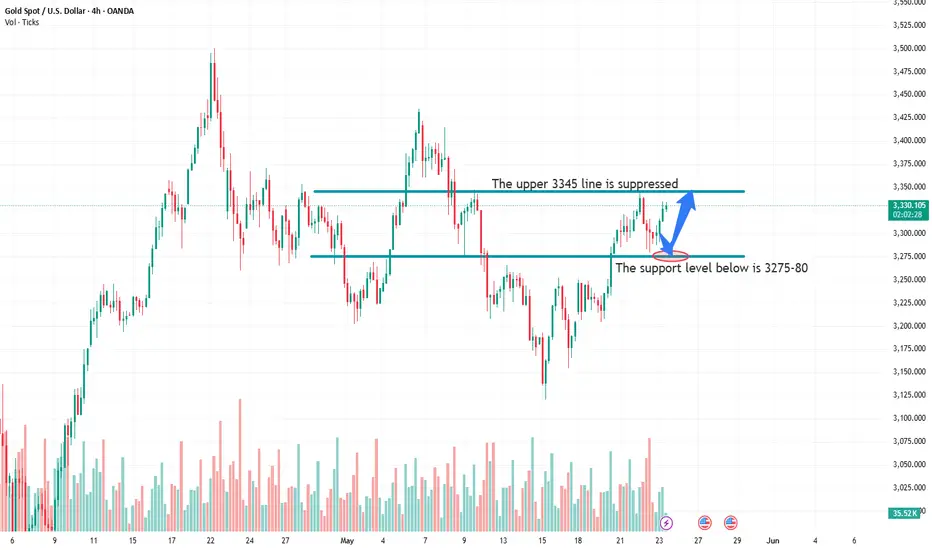
From the 4-hour market analysis, the upper focus is on yesterday's high pressure of 3345, and the lower support is 3286-90. For the time being, we will rely on this range to maintain the main tone of low-long participation. In the middle position, we will watch more and do less and be cautious in chasing orders.
Gold rebounds to 3286-3295 line and goes long, stop loss 3277, target 3326-3330 line, break to 3340-45 line;
Gold rebounds to 3340-45 line but does not break, you can go short lightly, stop loss 3353, target 3300-3306 line, continue to hold if break
Gold rose as expectedFrom a technical perspective, the daily line closed negative yesterday. After a series of positive lines, it generally means correction. After the negative line, it continues to rise. The closing line on Thursday is still above the middle track. The 5-day moving average crosses the 10-day moving average and adheres to the middle track at 3285. The 10-day moving average moves up to around 3253. The next wave of rise may go to the daily Bollinger upper track suppression point near 3400, so there is still a good space for the rise. In the 4-hour level, gold broke through the upper track yesterday and then stepped back, confirming the middle track support. At present, the Bollinger band is open, the moving average is still in a long position, and the cyclicality is still strong. The intraday support point is also the key point of strength and weakness at 3280. The short-term support is at the previous high of 3293. There are many intraday support levels for declines, and the upper 3315-3340-3365-3380-3400 is gradually looking up.
0522:Mastering Divergence in Gold: Daily vs. 4H Chart TacticsHello traders,
Daily chart GOLD looks strong bullish, but not a good position to open buy today.
So even you have the right direction , but in the wrong position ,still could make a losing trade.
Right now In the LD session on Thurs, there is already a bearish signal on 4H chart.
How can you open a long trade based on bearish signal on lower timeframe chart?
You want to follow main trend, but you surely not want to open in the wrong time or position.
Plan A: daily trading plan
Waiting daily candlestick of Thurs to see if the daily pressure line good for new selling plan.
And make your selling plan based on this candle on Friday.
Right, just watch and not doing anything on Thursday.
Plan B, 4H chart trading plan
In the early EURO session, GOLD has made a 4h bearish signal on 4h chart.
Open short position based on 30m chart bearish signal in EUOR-US session.
TP1: 3270
TP2: 3252
GOOD LUCK!
LESS IS MORE!

5/23 Gold Analysis and Trading SignalsGood afternoon everyone!
Gold did not touch our key buy or sell zones yesterday, but flexible intraday range trading worked well, resulting in decent profits.
Currently, the price has reached around 3330, and from a technical standpoint, bulls remain in control. If no negative surprise hits the market, gold could target 3368 today, with a potential to test 3400 resistance next week.
🔔 On the news front, two key events during the U.S. session today deserve attention:
A speech by Fed Governor Lisa Cook on financial stability — may provide hints about the Fed’s stance.
An executive order signed by Donald Trump, which might impact markets depending on its content (e.g., taxes, tariffs, or spending).
Also, note that U.S. markets will be closed next Monday, but this is unlikely to cause major disruptions. Positions held over the weekend can still be adjusted during the Asian session on Monday.
📈 Today’s Trading Recommendations:
📉 Sell near 3382–3398 (Resistance zone)
📈 Buy near 3274–3256 (Support zone)
🔁 Flexible trading levels:
3285 / 3296 / 3307 / 3316 / 3328 / 3337 / 3346 / 3361 / 3373

XAUUSDToday, the follower executed accurate signals in the band trading center and made a profit. The current news is relatively stable. The technical side continues to pursue long orders.
Combined with SMA, there is a support position below 3300-3290. The retracement range is 1%. It is currently in perfect agreement with the expected value.
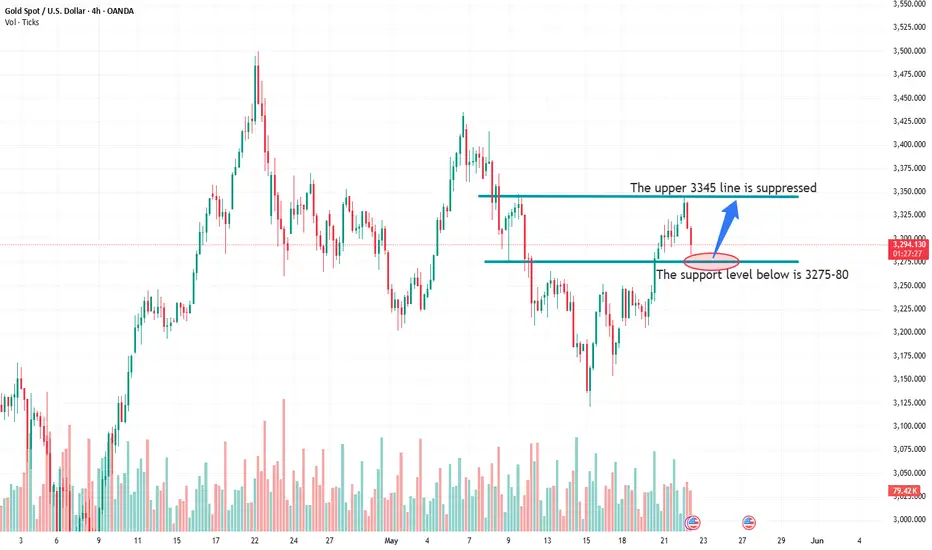
The current price is 3312. At present, we need to wait for the market to digest some negative factors before looking for opportunities to buy. Below 3310 is a good buying position. Above 3345 is a pressure position that needs to be paid attention to in the short term. If it breaks through, you need to pay attention to whether the position of 3350-3360 can break through stably before considering buying.
Do not trade independently during the trading process. To avoid any losses. If you don’t know how to trade, remember to pay attention to the buying and selling suggestions of the band trading center.
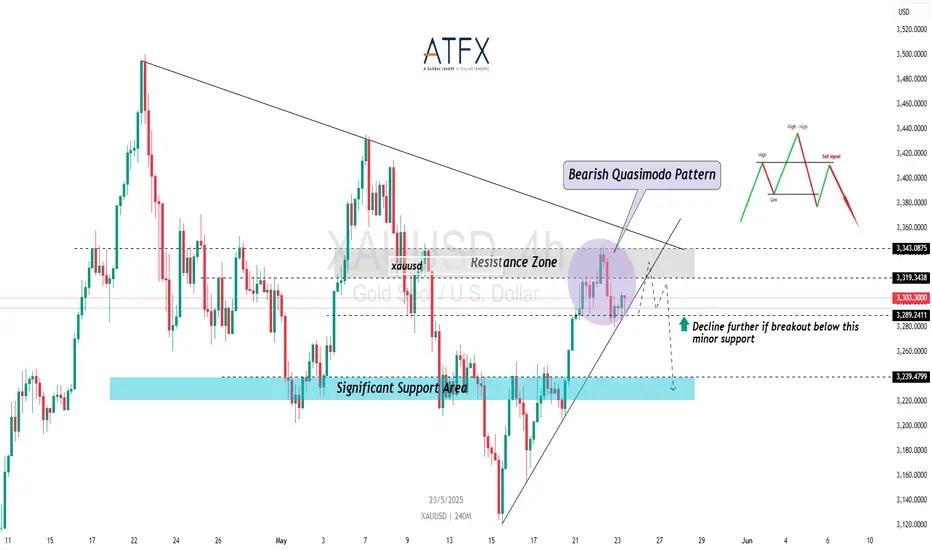
PMI Boosts USD but Caution Lingers Ahead of Fed DecisionOANDA:XAUUSD TVC:GOLD The recent release of stronger-than-expected S&P Global PMIs in the U.S. has offered short-term support to the dollar, pressuring gold from intraday highs. Manufacturing and services PMIs both improved to 52.3 in May, fueling speculation that the U.S. economy may still be resilient despite persistent concerns over Trump's proposed tax reforms and renewed tariffs.
Still, market sentiment remains cautious. While Wall Street recovered slightly, it continues to post weekly losses. Investors are balancing upbeat data with longer-term risks — including a potential economic slowdown triggered by aggressive fiscal tightening and global demand headwinds.
With the FOMC meeting approaching (June 17–18), gold traders are likely to remain reactive to macroeconomic signals. Any dovish shift or mention of a potential rate cut timeline could reignite demand for non-yielding assets like gold. Until then, price action around the $3,289 support and the Quasimodo pattern will be crucial for short-term direction.
Resistance : $3,319 , $3,343
Support : $3,289 , $3,239
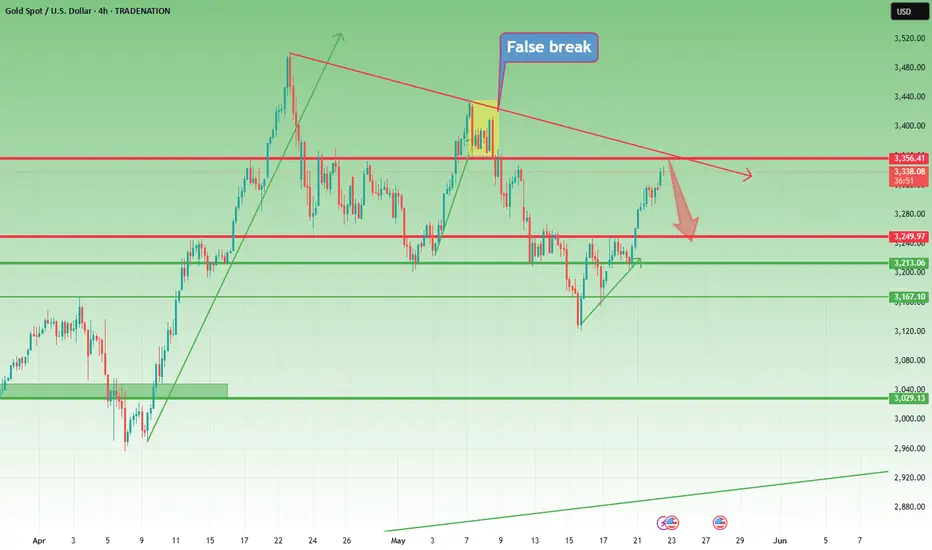
Gold Hits 3360 Resistance After Breakout – Reversal Ahead?📈 Gold Breaks Out – Now Approaching Key Resistance
Two days ago, I highlighted the ascending triangle forming on Gold and warned that a breakout could lead to strong acceleration in the direction of the move.
As expected, price broke to the upside and rallied 1,000 pips, confirming the bullish breakout.
🧱 B ut now, Gold faces a major test...
Price is now approaching a critical confluence resistance zone around 3360, where I expect a possible reversal.
Given the recent pattern of strong two-way volatility, a pullback from here could send Gold back down to retest the broken 3250 zone — now acting as support.
📊 Trading Plan:
I’m watching closely for signs of weakness near 3360 to open short trades. This level is key for both bulls and bears, and price action here could define the next move.
Disclosure: I am part of Trade Nation's Influencer program and receive a monthly fee for using their TradingView charts in my analyses and educational articles.
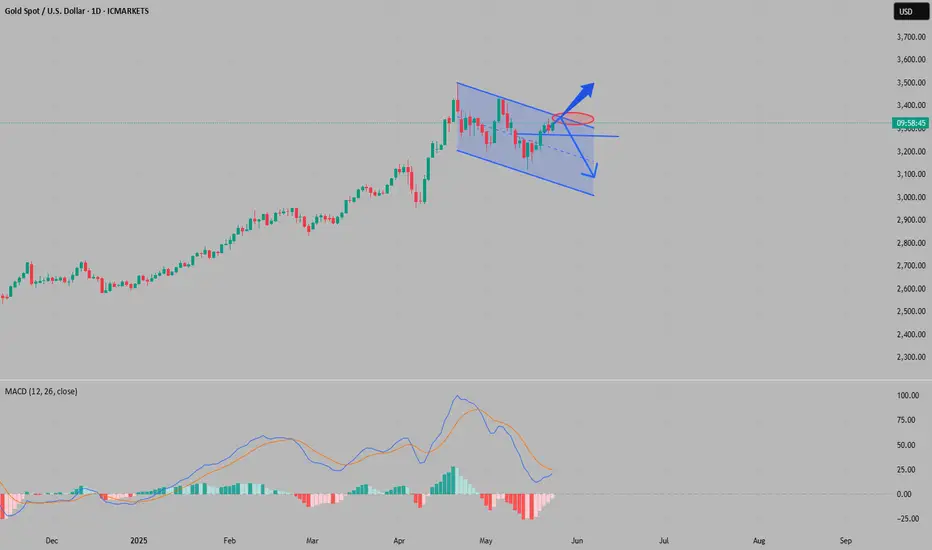
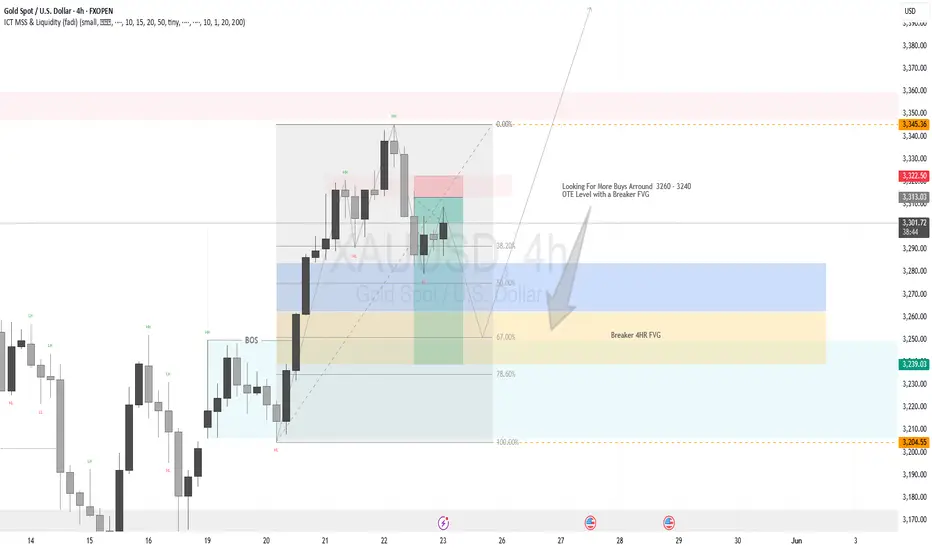
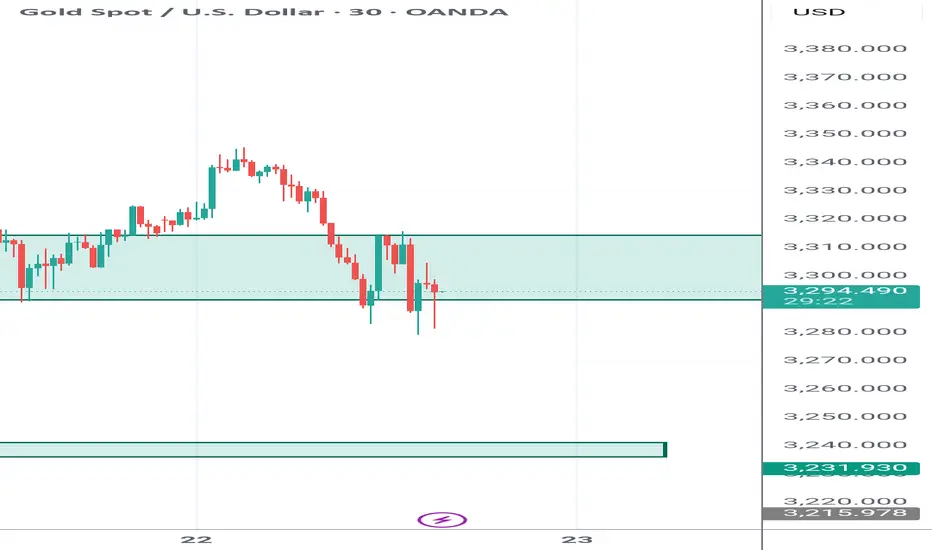
XAUUSD Market OutlookMy current bias on XAUUSD remains bullish, as we are targeting the lower high (LH) around the 3,438 level. However, the market is currently in a pullback phase within the LH & LL. Price has entered an OTA level within a Daily Fair Value Gap (FVG), ranging between 3,370 and 3,333. This presents a potential opportunity for short setups as we move towards the 3,251 level.
On the 4-hour timeframe, there's a valid FVG Breaker near our Fibonacci-based OTA level, aligning closely with the 3,251 support zone. This is a key area to watch for bullish confirmations. Any long positions should ideally be considered from this zone.
Important Note:
When trading gold, patience and discipline are essential. Only act on clear, confirmed setups that align with your strategy. Quality over quantity always wins in the long run.
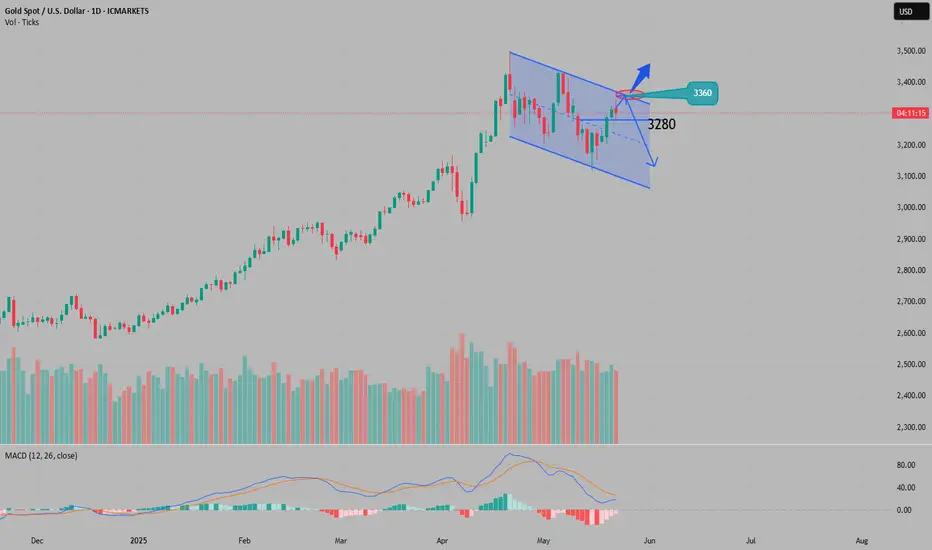
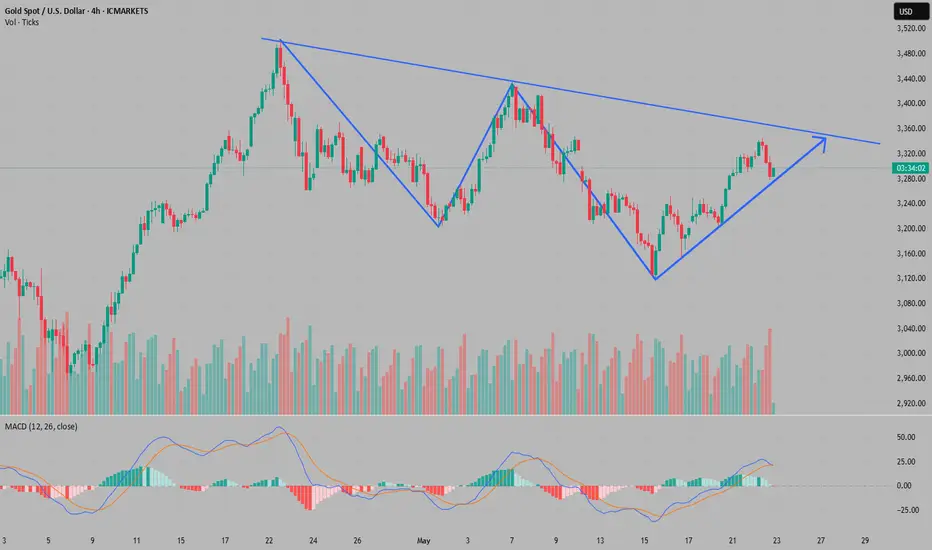
Gold hits a critical area, bulls and bears face a choice againYesterday, the market closed positively, and the market continued to rise for three consecutive days. In the short term, this wave of rise will reach the trend resistance line of 3500-3438 with great probability. We will continue to pay attention to the important pressure points of 3370-80. Due to the slow rise of yesterday, there was another wave of continuous rise this morning. The accumulated top divergence finally ushered in a downward correction. The number of such continuous divergences cannot be predicted, and sometimes it may even be forcibly reversed, but what is coming will come in the end. This is a good thing, because only after the correction can we climb higher. Of course, the bad thing is that a wave of decline in the European session will inevitably wash out a lot of bullishness, which is inevitable, because the direction of adherence is all the way up. But tonight, there is a high probability that it will bottom out and rise, because after the middle track breaks through, it will become a certain support, or pierce, but the closing should still be above, so there is a certain support in the range of 3260-3253, and there will not be too much room to go down for the time being.
The gold trend takes a sharp turn, is a bear market coming?🗞News side:
1. PMI and initial jobless claims data
2. Geopolitical situation
3. Progress of the G7 meeting
📈Technical aspects:
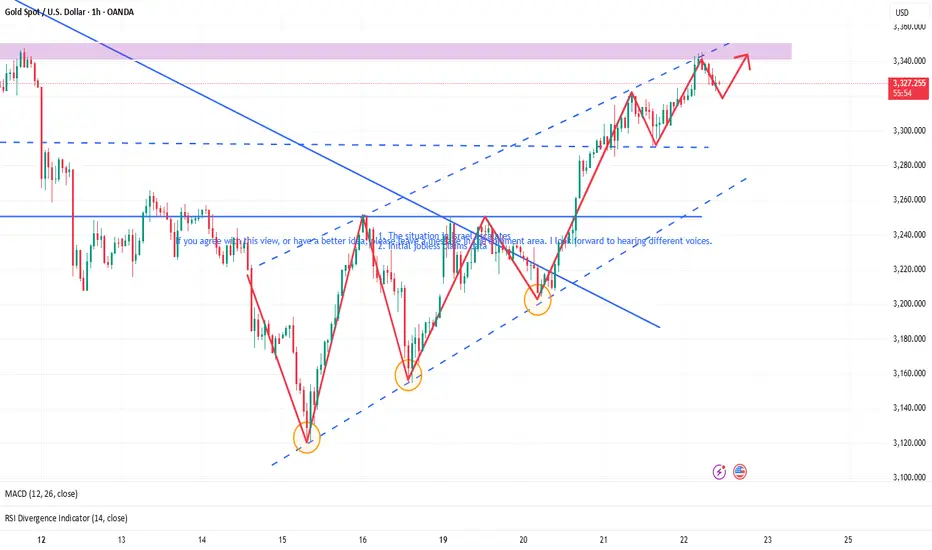
During the Asian session, gold prices approached a two-week high. However, as the market digests the previous positive news and European and American economic data are about to be released intensively, gold's short-term trend faces uncertainty. The key data that everyone needs to pay attention to today include the May PMI data and the number of initial jobless claims in the United States. At the same time, the international trade situation, geopolitical dynamics, the progress of the G7 meeting and the speeches of Federal Reserve officials may have an impact on the market, so it is recommended that everyone keep a close eye on the impact of the news. Judging from the 4H market trend, the US market is paying attention to the short-term support around 3280-3275. Once it stabilizes above 3280, you can arrange to go long. On the contrary, once it falls below 3280-3275, it is possible to fall to the important support area of 3260-3250.
If you agree with this view, or have a better idea, please leave a message in the comment area. I look forward to hearing different voices.
OANDA:XAUUSD FX:XAUUSD TVC:GOLD FXOPEN:XAUUSD FOREXCOM:XAUUSD

XAUUSD Predicted winnerPrice in the box, 4 hours ago I was discussing the price action with my cousin. He opened a buy trade after seeing a long bullish candle and sent it to me. But first I need the price to determine its position with the box. If it closes above it, it will be a buy trade and if it closes below it, it will be a sell trade. 2 hours ago the price closed below the box and issued a sell signal. We are waiting to see what the outcome will be.
Seize the opportunity in the gold marketGold fell after reaching a high point during the day, reaching a high of 3345 before going out of the big drop space, and the evening star appeared in the 4H cycle. Combined with the correction of the top divergence of the indicator, the short-term will enter the adjustment stage. Pay attention to the middle track support around 3280-75 in the future market. If it does not break, you can consider going long. Pay attention to the upper pressure of 3320 and 3335. Keep the idea of shock in operation!
Operation suggestion: Go long on gold around 3280-3275, and look at 3300 and 3320. Go short if the rebound pressure of 3320 is not broken.

Gold 100% Profit SignalGold hit the highest point of 3345 today and started to fall back. We also directly shorted at 3341, and successfully reached the target of 3310-15. Friends who follow my articles and real traders can see that the short-term decline of gold does not change the bullish trend. Gold rose by about 100 US dollars after breaking through the box shock, so it is normal to fall back a little. The key to gold in the US market is still the support of 3295-3300. If gold continues to test the support of 3300 and the rebound is weak, then the difficulty of gold rising in the US market will increase, and gold may have to consider high altitude. For now, the advantage of gold bulls still exists
Judging from the 4-hour market trend, the short-term support below is around 3275-3280, with a focus on the 3253-60 support. The short-term bullish strong dividing line is 3253. If the daily level stabilizes at this position, the bullish rhythm of pulling back to lows and buying on the trend will remain unchanged.
Gold operation strategy:
1. Go long when gold falls back to 3290-3295, add more when it falls back to 3275-80, stop loss at 3269, target at 3316-3320, break to 3340-45;
2. If gold rebounds to 3340-45 but does not break, go short with a light position, stop loss at 3353, target at 3300-3306
The latest gold operation strategyFrom a technical perspective, gold has been strong recently. Spot gold closed at $3,289.54 per ounce on Tuesday, and further broke through $3,300 in early trading on Wednesday, reaching a high of $3,304.06, a new high in more than a week. In the short term, gold prices need to break through the key resistance level of $3,370 to open up further upside space; $3,150 has formed a solid support below. If there are new variables in the geopolitical situation or economic data, gold prices may even challenge the $3,400 mark. Based on the current trend, the trading idea on Wednesday is clear: wait for the price to fall back and continue to intervene in long orders around 3,300, and maintain a bullish strategy.
Gold is recommended to go long in the 3300-3305 area, stop loss at 3292, target at 3315-3330

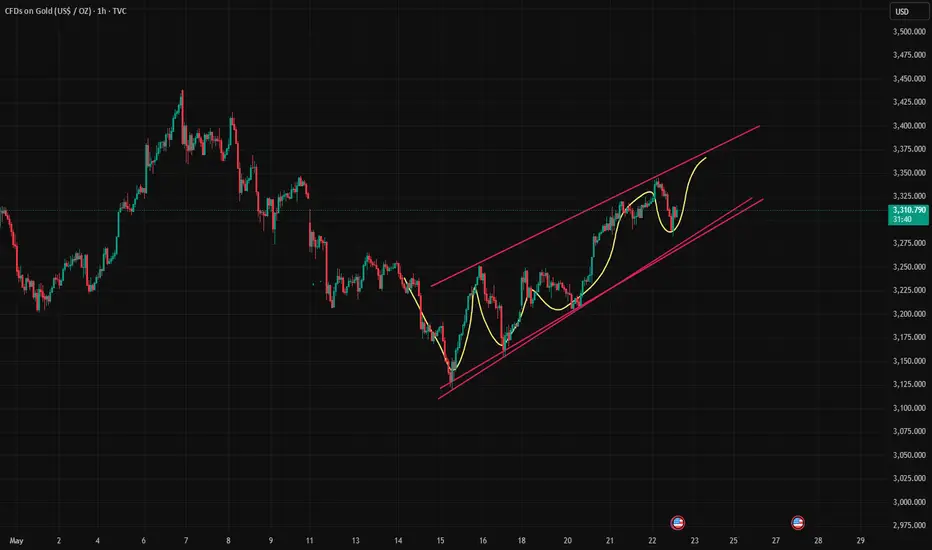
Is gold going up or down?Gold is showing the characteristics of a fluctuating upward trend. In terms of support, first pay attention to the vicinity of 3290, which is the low point touched by the gold price in the early stage of yesterday. Secondly, pay attention to the support near 3270, which is the current corresponding support position of the rising channel formed by connecting high and low points since the gold started to rise at 3120. As for the upper resistance near 3350-3370, it is the area that needs to be paid attention to at present. From a technical point of view, the next wave of rise may go to the daily Bollinger upper rail suppression point near 3400, so there is still good room for rise. The technical points of the unilateral rise in the H4 cycle are quite obvious. The Bollinger opening and the moving average system diverge upwards. The upward momentum is sufficient. The upward trend does not guess the top. The support point of the decline is on the moving average support. The expected support point is 3305. In principle, a trend long order is made at this point. It is believed that as long as the 3290 position is maintained, it is still bullish. The long defense position is the 3250 mark. This position is the key watershed for the pull-up and retracement. The key point of the rise is 3350. Here we see whether there can be an effective short-term decline. Gold rose directly in the morning. It is recommended not to chase the long in the Asian and European sessions, but to go long after the decline. Pay attention to the gains and losses of the resistance of 3350-3370 during the day.
gold on sideways#XAUUSD have retest below 3283 which reverse back above 3314, now we expect bullish to take place from 3317.44.
Above the zone 3317.44 shows a bullish breakout which will target 3346 back. Stop loss 3307
Below 3307 have bearish formation which will continue selling till 3284 next bearish zone-3260.

5/22 Gold Trading SignalsGood afternoon everyone!
Yesterday's trading session was a bit bumpy, but in the end, we achieved considerable profits.
Today, gold rose to around 3346 and then began to pull back. It is now approaching the 3300 support level.
🔍 From a technical perspective, the candlestick structure and several indicators suggest that bears may still attempt further downside:
Primary support area: 3288–3276 — if this holds, a rebound is expected, with resistance around 3309–3316.
Secondary support area: 3263–3248 — if it breaks lower, watch for a short-term bounce around 3276-3282.
📰 On the news front, Initial Jobless Claims and PMI data will be released today. These could trigger short-term volatility.
📌 Trading strategy for today includes two key scenarios:
If the data is bearish for the dollar and gold drops to 3253, look for buy opportunities.
If the data is bullish and gold rises to 3358, it's a good spot to sell into strength.
📈 Today’s Trading Recommendations:
📉 Sell near 3358–3372 (Resistance zone)
📈 Buy near 3263–3248 (Support zone)
🔁 Flexible intraday levels: 3253 / 3268 / 3277 / 3286 / 3298 / 3309 / 3316 / 3328 / 3348
Wishing everyone a smooth trading day. Feel free to leave a comment if you have any questions—I’ll get back to you as soon as possible.

Intraday volatility,there is still chance to go long on pullback🗞News side:
1. The situation in Israel escalates
2. Initial jobless claims data
📈Technical aspects:
Influenced by recent news, gold showed a volatile rebound trend. Gold continued to rise in the early Asian session, r OANDA:XAUUSD eaching a high of around 3345. The 3290-3300 level below has absolute support in the short term. As long as it does not fall below 3290, you can go long at 3290-3300. In the 4H cycle, the Bollinger opening and the moving average diverge upwards. The upward momentum is sufficient, and it is not easy to guess the top. Pay attention to the 3310-3300 line of support below, and pay attention to the suppression of the 3340-3350 area above. If the gold price stabilizes at 3350, it is expected to further explore the resistance of 3360-3370. If the European session falls into volatility, maintain the range of high selling and low buying, and consider going long when it retreats to the support level of 3320-3310.
If you agree with this view, or have a better idea, please leave a message in the comment area. I look forward to hearing different voices.
FOREXCOM:XAUUSD FXOPEN:XAUUSD TVC:GOLD FX:XAUUSD
XAUUSD and GBPJPY analysis todayHello traders, this is a complete multiple timeframe analysis of this pair. We see could find significant trading opportunities as per analysis upon price action confirmation we may take this trade. Smash the like button if you find value in this analysis and drop a comment if you have any questions or let me know which pair to cover in my next analysis.

XAU/USD 22 May 2025 Intraday AnalysisH4 Analysis:
-> Swing: Bullish.
-> Internal: Bullish.
Analysis and bias remains the same as analysis dated 23 April 2025
Price has now printed a bearish CHoCH according to my analysis yesterday.
Price is now trading within an established internal range.
Intraday Expectation:
Price to trade down to either discount of internal 50% EQ, or H4 demand zone before targeting weak internal high priced at 3,500.200.
Note:
The Federal Reserve’s sustained dovish stance, coupled with ongoing geopolitical uncertainties, is likely to prolong heightened volatility in the gold market. Given this elevated risk environment, traders should exercise caution and recalibrate risk management strategies to navigate potential price fluctuations effectively.
Additionally, gold pricing remains sensitive to broader macroeconomic developments, including policy decisions under President Trump. Shifts in geopolitical strategy and economic directives could further amplify uncertainty, contributing to market repricing dynamics.
H4 Chart:
M15 Analysis:
M15 Analysis:
-> Swing: Bullish.
-> Internal: Bearish.
In my analysis from 12 May 2025, I noted that price had yet to target the weak internal high, including on the H4 timeframe. This aligns with the ongoing corrective bearish pullback across higher timeframes, so a bearish internal Break of Structure (iBOS) was a likely outcome.
As anticipated, price targeted strong internal low, confirming a bearish iBOS.
Price has remained within the internal range for an extended period and has yet to target the weak internal low. A contributing factor could be the bullish nature of the H4 timeframe's internal range, which has reacted from a discounted level at 50% of the internal equilibrium (EQ).
Intraday Expectation:
Technically price to continue bullish, react at either premium of internal 50% EQ or M15 demand zone before targeting weak internal low priced at 3,120.765.
Alternative scenario:
Price can be seen to be reacting at discount of 50% EQ on H4 timeframe, therefore, it is a viable alternative that price could potentially print a bullish iBOS on M15 timeframe.
Note:
Gold remains highly volatile amid the Federal Reserve's continued dovish stance and persistent geopolitical uncertainties. Traders should implement robust risk management strategies and remain vigilant, as price swings may become more pronounced in this elevated volatility environment.
Additionally, President Trump’s recent tariff announcements are expected to further amplify market turbulence, potentially triggering sharp price fluctuations and whipsaws.
M15 Chart:

How to arrange after gold falls into consolidation🗞News side:
1. US officials said Trump's statement was related to the Golden Dome Project, which may affect the flow of funds
2. The tension in the Middle East has intensified, and the risk aversion sentiment has increased, which is good for gold
3. Although the withdrawal of Indian and Pakistani troops has eased the regional situation, geopolitical risks still exist
4. Trump mentioned the tax bill, which affected economic expectations and affected gold investment sentiment to a certain extent.
📈Technical aspects:
At present, gold is in consolidation, and the upward trend is slightly stagnant. From the hourly chart, there are signs of downward correction after the upward test of 3320. In the short term, the upper 3320 line has a certain suppression, so gold may test the support again and then rise after stabilizing. Then the first support below is the 3292 line, followed by the 3285 line. If it falls below, it may test the two key support points of 3273 and 3265. The current trend is not clear. In the future trading, we will wait patiently for the gold price to stabilize before entering the market.
If you agree with this view, or have a better idea, please leave a message in the comment area. I look forward to hearing different voices.
OANDA:XAUUSD FX:XAUUSD TVC:GOLD FXOPEN:XAUUSD FOREXCOM:XAUUSD
