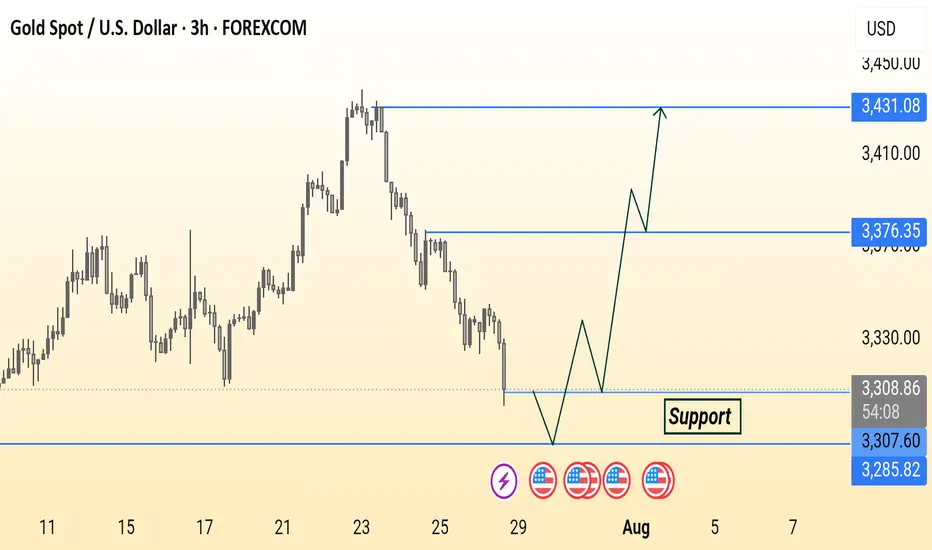
Xauusd bullish setupGold (XAU/USD) is approaching a key support zone around 3,285.82. The chart suggests a potential bullish reversal from this level, targeting resistances at 3,376.35 and 3,431.08. Price action may form a double bottom before moving upward.
Xauusdupdates
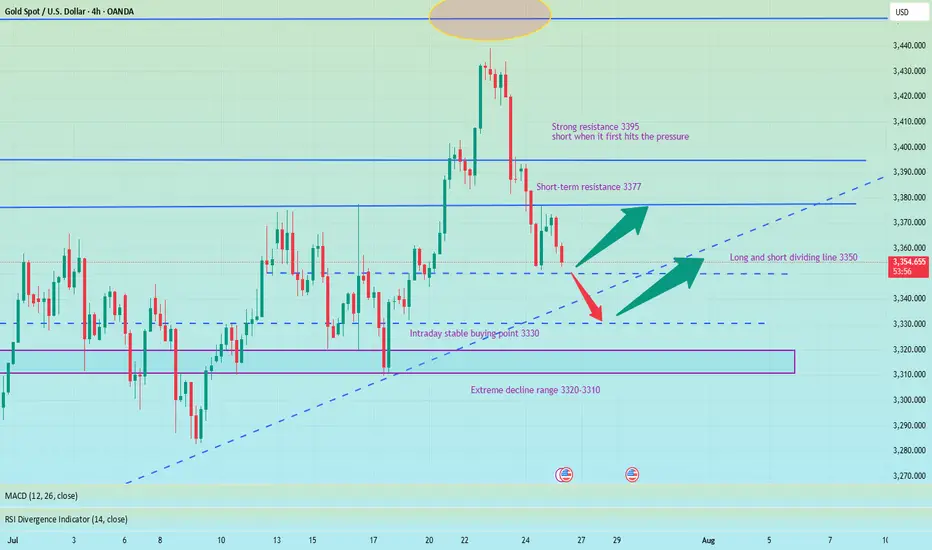
Monday market forecast and analysis ideas#XAUUSD
There will be a lot of data next week, such as the 8.1 tariff deadline that I have repeatedly emphasized, the Federal Reserve decision, NFP data, etc. It can be said that it is relatively difficult to analyze purely from a technical perspective, because there is uncertainty in many data, the data results are often non-linearly correlated with market reactions (good news does not necessarily lead to a rise, and bad news does not necessarily lead to a fall), and large fluctuations can easily form oscillating K-lines with long upper and lower shadows. Therefore, the first arrangement for next week is to participate in trading with a light position and avoid letting emotions control your thinking.
The closing price on Friday was near 3337, proving that the short-term judgment on the rebound momentum of gold is correct, so there are two possible situations on Monday.
1. The first thing we need to pay attention to is 3345-3350 to determine whether it constitutes a short-term pressure level. The weekly line closed with a negative cross star. Combined with the monthly line trend, in terms of support, focus on the trend line support near this week's low of 3325. If this position is not broken, the market is expected to usher in a wave of rebound; if it falls below 3325, the bottom may look to 3310 or even 3295 for support.
2. The rebound momentum of Friday continued on Monday, breaking through 3350 first, and then it is possible to reach the previous high resistance area of 3370-3380. If it encounters resistance here, gold will continue to fall and fluctuate, and the target may even be 3310. If the price remains strong and issues such as interest rate cuts and tariffs are imminent, it means that the short-term downward trend has ended and may even set a new high.
The above content is only a forecast for Monday’s market. It will be greatly affected by data and news, and may be adjusted in real time next week based on intraday trends. You can refer to this, but remember not to be swayed by emotions. We will participate with a light position, and the specific trading strategy can wait for my trading signal.
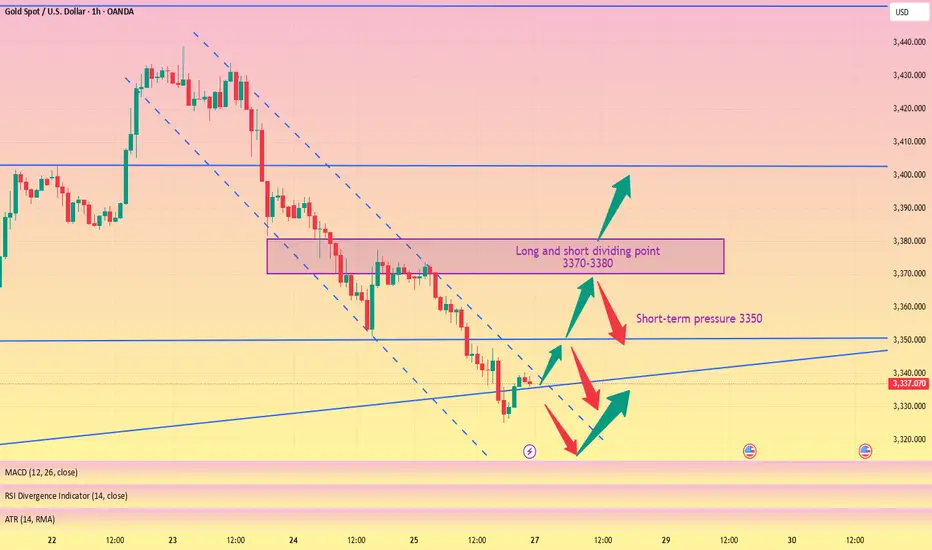
Pay attention to 3350 gains and lossesGood morning, bros. This morning gold again tested last week's low near 3325. From the chart, gold may continue to rise this week, with tariffs approaching, the Fed's interest rate cut, and NFP data imminent. The current strength and weakness are at 3350-3355. If it can effectively break through and stand above, it is expected to continue to test the previous high point, which is also the long-short dividing point of 3370-3380.
From the daily chart, there is not much change in the operational range of gold in the short term, and the change in the 4H chart is more obvious. After the decline in the early trading, it is now rebounding. There is a possibility of closing positive at the low. If it is directly positive on Monday, then it will bottom out directly at the beginning of the week. If it refreshes the low on Monday, the low point of 3285 will be seen below. Therefore, today's market focuses on the continuity of long and short. Of course, according to the current changes, the biggest possibility is to continue to rebound at the low point, pay attention to the support of 3310-3300 below, and pay attention to the gains and losses of the high point of 3355 above.

gold on buy reverse#XAUUSD price have multiple reject between the third range, now we expect for breakout to buy.
Above 3339 holds bullish reverse, target 3345-3358. 3345 can reverse back on sell.
Below 3330 on 2 times breakout will drop the price till 3320-3300

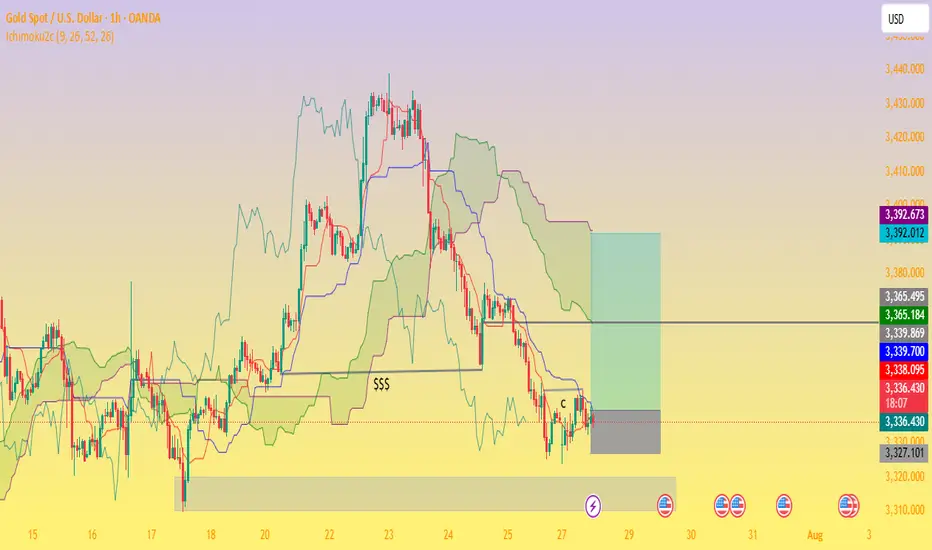
XAU/USD 1H – Range Consolidation Below Ichimoku Cloud. Chart Review & Technical Insight
1. Ichimoku Cloud & Overall Structure
Price is below the Ichimoku Cloud, with the cloud ahead sloping downward—indicative of bearish short‑term momentum and resistance overhead as long as the cloud holds above price.
The Kijun-sen (blue) line is above the Tenkan-sen (red), reinforcing the bearish bias on this timeframe.
2. Price Action & Key Zones
A support zone around 3,327–3,330 USD/oz is visible, underpinned by multiple rejection taps and price consolidation (“$$$” zone). A clean break below could open the path toward the 3,320’s or lower imbalance region.
On the upside, resistance lies near 3,339–3,340, backed by the cloud’s lower boundary and the Kijun-sen level.
The highlighted green rectangle appears to signal a potential bullish breakout target zone toward 3,365–3,392, contingent on recovery above the cloud.
3. Momentum & Trade Considerations
Momentum is weak, with price moving sideways inside a low‑volatility rectangle on diminishing volume and few directional impulses.
Possible ABC corrective structure is forming as marked, suggesting price may oscillate sideways or continue correcting within established bounds.
A bullish scenario would require clearing the Ichimoku Cloud and resistance at 3,340–3,360 USD.
Conversely, a bearish breakdown below ~3,327 could confirm continuation deeper into the 3,320s or toward the next significant demand zone near 3,300 USD.
.
✅ Summary
Bias: Slightly bearish to neutral until price can clear the Ichimoku Cloud.
Key Levels to Watch:
Support: 3,327–3,330 (immediate), then 3,320–3,300.
Resistance: 3,339–3,365, cloud top near 3,365, further target zone 3,392.
Scenarios:
Bullish breakout: Close above cloud → potential rally toward 3,365–3,392.
Bearish breakdown: Close below 3,327 → deeper correction toward 3,320 and lower imbalance areas.
XAUUSD and AUDUSD Analysis todayHello traders, this is a complete multiple timeframe analysis of this pair. We see could find significant trading opportunities as per analysis upon price action confirmation we may take this trade. Smash the like button if you find value in this analysis and drop a comment if you have any questions or let me know which pair to cover in my next analysis.

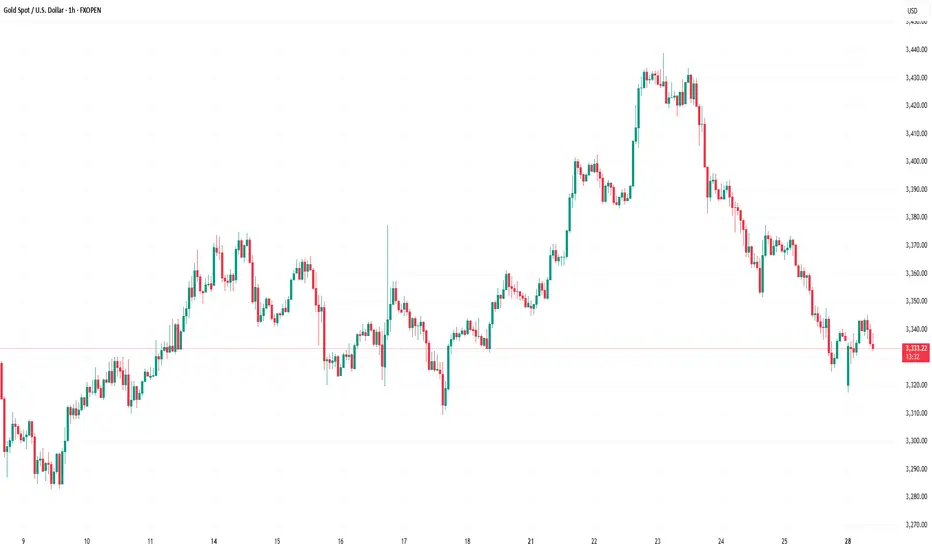
Market Analysis: Gold Prices Ease – Market Awaits Fresh CatalystMarket Analysis: Gold Prices Ease – Market Awaits Fresh Catalyst
Gold price started a fresh decline below $3,380.
Important Takeaways for Gold Price Analysis Today
- Gold price climbed higher toward the $3,430 zone before there was a sharp decline against the US Dollar.
- A key bearish trend line is forming with resistance near $3,350 on the hourly chart of gold at FXOpen.
Gold Price Technical Analysis
On the hourly chart of gold at FXOpen, the price climbed above the $3,380 resistance. The price even spiked above $3,400 before the bears appeared.
A high was formed near $3,432 before there was a fresh decline. There was a move below the $3,380 support level. The bears even pushed the price below the $3,350 support and the 50-hour simple moving average.
It tested the $3,325 zone. A low was formed near $3,325 and the price is now showing bearish signs. There was a minor recovery wave towards the 23.6% Fib retracement level of the downward move from the $3,433 swing high to the $3,325 low.
However, the bears are active below $3,342. Immediate resistance is near $3,350. There is also a key bearish trend line forming with resistance near $3,350.
The next major resistance is near the $3,380 zone. It is close to the 50% Fib retracement level of the downward move from the $3,433 swing high to the $3,325 low. The main resistance could be $3,410, above which the price could test $3,432. The next major resistance is $3,450.
An upside break above $3,450 could send the gold price towards $3,465. Any more gains may perhaps set the pace for an increase toward the $3,480 level.
Initial support on the downside is near the $3,325 level. The first major support is near the $3,310 level. If there is a downside break below it, the price might decline further. In the stated case, the price might drop towards the $3,265 support.
This article represents the opinion of the Companies operating under the FXOpen brand only. It is not to be construed as an offer, solicitation, or recommendation with respect to products and services provided by the Companies operating under the FXOpen brand, nor is it to be considered financial advice.
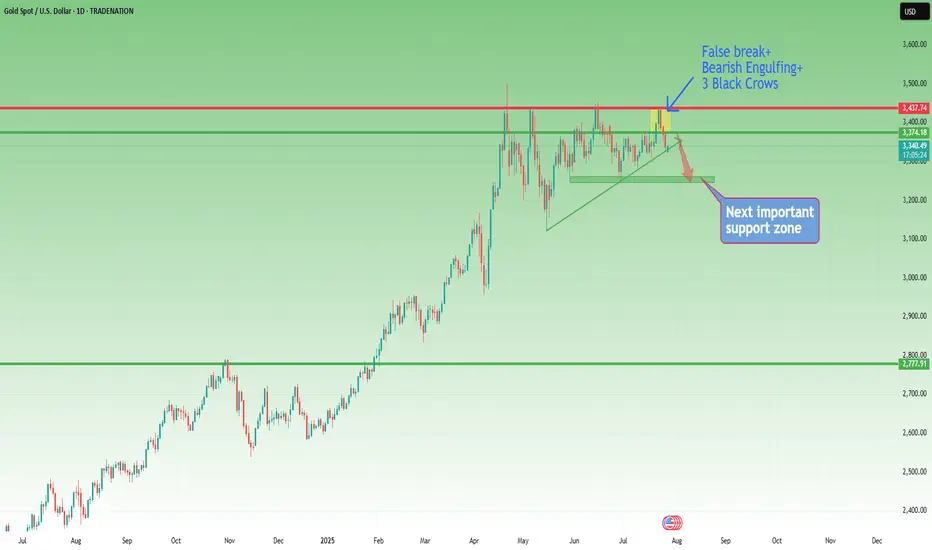
Gold Breakout Failed – Bearish Reversal in Play?Last week was both interesting and revealing for Gold.
After breaking above the key $3375 resistance—which also marked the upper boundary of a large triangle—price quickly accelerated higher, reaching the $3440 resistance zone.
However, instead of a bullish continuation, we witnessed a false breakout and sharp reversal. What initially looked like a healthy pullback turned into a full bearish rejection by week’s end.
________________________________________
📉 Current Technical Picture:
• On the daily chart, we now see a clear Three Black Crows formation
• On the weekly chart, a strong bearish Pin Bar confirms rejection
• And if we add the failed breakout above 3375, the bias tilts decisively bearish
________________________________________
📌 Key Zones and Trading Plan:
• Gold is currently bouncing from the ascending trendline zone, which is natural after dropping more than 1,000 pips in just 3 days
• The $3375–3380 area has regained importance as a key resistance zone, and that’s where I’ll be looking to sell rallies
• A bullish invalidation would only come if price manages to stabilize above $3400
Until then, this remains a bear-dominated market, and a drop below $3300 is on the table.
________________________________________
🧭 Support levels to watch:
• First support: $3280
• Major support: $3250 zone
________________________________________
📉 Conclusion:
The failed breakout, bearish candle formations, and current price structure all point to a market that's shifting in favor of sellers.
I’m looking to sell spikes into resistance, with a clear invalidation above $3400.
Disclosure: I am part of TradeNation's Influencer program and receive a monthly fee for using their TradingView charts in my analyses and educational articles.
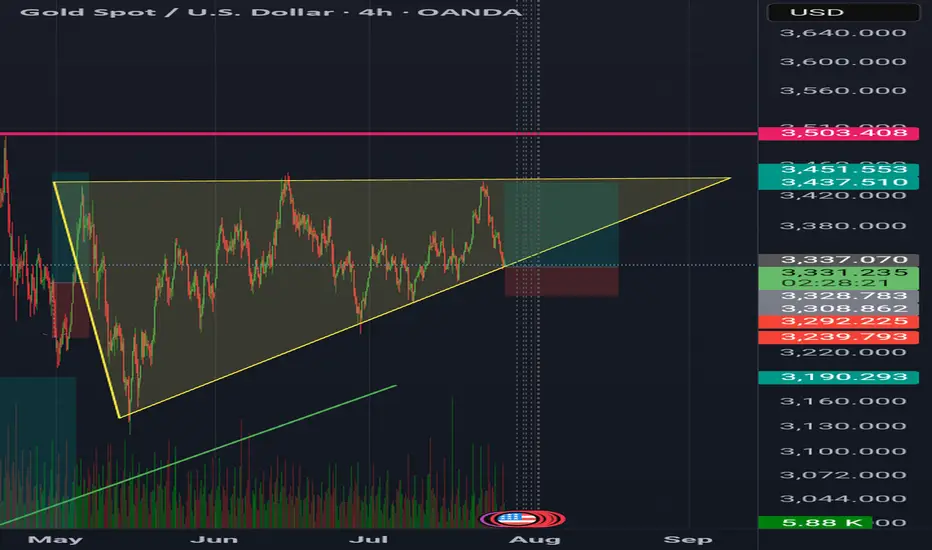
GoldXau usd daily analysis
Time frame 4 hours
Gold is moving up and down in the yellow triangle, you can see on the chart
I think Gold move up to 3450 $ and if we have no positive news, it will drop to the down side. This analysis has good benefit and Risk rewards ratio is 3
On the other hand if Gold break the 3320 $ my analysis is faild and must listen to the economic news
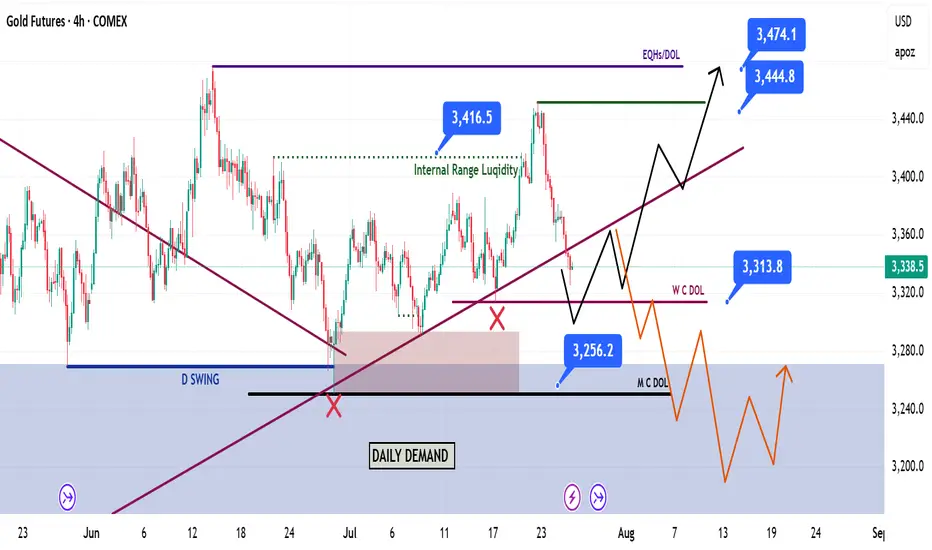
GOLD - GC Weekly Recap & Outlook | 27.07.2025🧾 Weekly Recap:
• Price tapped into the 1H Demand Zone (red box) and ran the 4H swing liquidity before bouncing to clear internal range liquidity.
• This move was followed by a retracement which led to a break of the bullish trendline.
This may signal the beginning of a broader accumulation phase. Expect choppy price action targeting internal liquidity both above and below, before a clear trend resumes.
📌 Technical Analysis:
Price has closed below the bullish trendline, leading to two possible scenarios:
1. Bullish scenario (black path):
– Price runs the W C DOL (3313$) →
– Finds rejection →
– Retests broken trendline →
– Breaks above the trendline →
– Continues toward 3444$ and potentially 3474$
2. Bearish scenario (orange path):
– Price runs W C DOL (3313$) →
– Rejects from the broken trendline →
– Fails to reclaim it →
– Continues downward to target M C DOL (3256$)
📈 Setup Trigger:
Wait for clear 1H–4H supply/demand zone creation and structure shift before initiating a trade.
🎯 Trade Management:
• Stoploss: Above/below relevant supply-demand zone
• Targets:
– Bullish: 3444$, 3474$
– Bearish: 3256$
🟡 If you liked the idea, feel free to drop a like & comment — and don’t forget to follow for more weekly updates.
Gold 8H Bullish Reversal Setup After Channel Break. Gold/USD 8H Chart Analysis:
Price has broken below an ascending channel, indicating potential short-term weakness. However, a bullish reversal setup is marked, with a suggested buy zone near current levels (~3339), targeting the 3428–3459 USD range. Stop loss placed below 3310 for risk management.

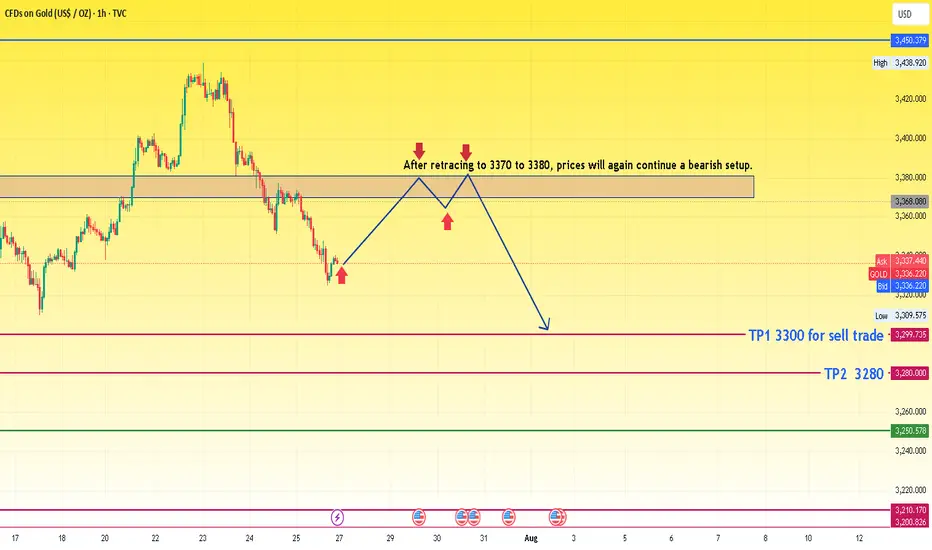
XAUUSD idea for upcoming weekThe chart presents a bearish outlook for gold based on a retracement and continuation pattern. Here's a detailed analysis:
🔍 Chart Summary:
Current Price: Around 3336
Bias: Bearish (after retracement)
Resistance Zone: 3370 – 3380
Sell Confirmation Area: Upon rejection from the 3370–3380 resistance zone
Target 1 (TP1): 3300
Target 2 (TP2): 3280
📈 Technical Structure:
Recent Trend:
The price has dropped sharply from its recent peak.
Now it's attempting a pullback to previous support, which has turned into a resistance zone (3370–3380).
Price Action Expectation:
A retracement is expected toward 3370–3380.
If the price gets rejected from this resistance block, the chart suggests the formation of a lower high.
After rejection, a bearish continuation is expected.
Projected Move:
Short entry around the resistance zone.
Targets:
TP1: 3300 (intermediate support)
TP2: 3280 (major support)
🧠 Trade Idea Logic:
The chart follows a classic bearish price action setup: impulse → retracement → continuation.
The consolidation and break area has flipped from support to resistance.
The retracement zone is clearly defined, making it a high-probability area for reversal if bearish signals (e.g., rejection candles) form.
⚠️ Key Considerations:
Wait for confirmation: Do not enter blindly at 3370–3380. Look for rejection patterns (like a bearish engulfing or pin bar).
Volume and fundamentals: Watch for economic data or geopolitical news that might invalidate the technical setup.
SL Suggestion: Above 3385 or 3390 to allow some room for wick spikes.
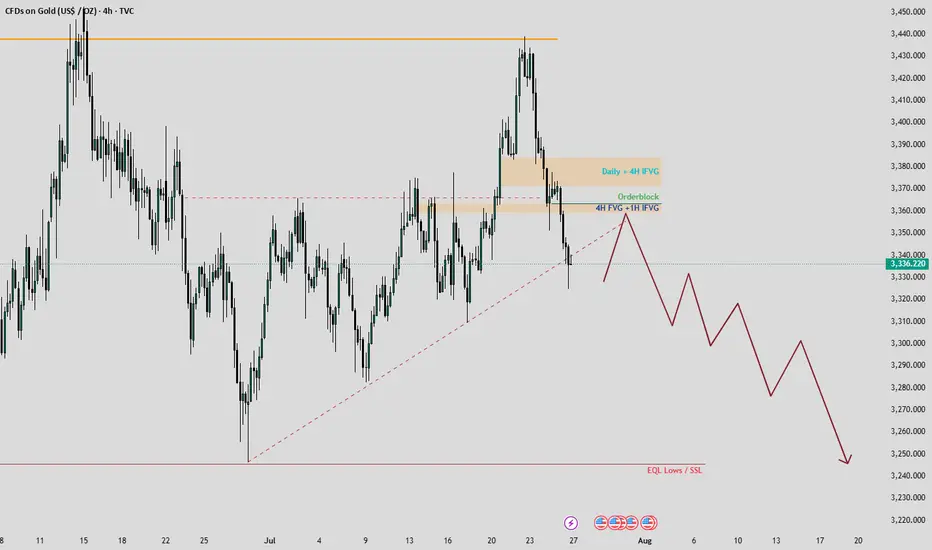
Gold Market Analysis: Seize the Bearish Opportunity!Hello, amazing traders! 📊 Last week, gold put both buyers and sellers through a rollercoaster, peaking at $3,439 on Monday and Tuesday before a sharp decline shook the market. The chart reveals a classic triangle pattern with a sneaky false breakout, designed to trap the unwary. Now, with the upside liquidity swept away, a bearish move is on the horizon—let’s break it down!
📈 Chart Insights
Take a look at the attached chart! Gold’s recent action highlights:
False Breakout: The price tricked traders with a brief surge, only to reverse sharply.
Target Zone: Equal Lows at $3,240 are the next key level to watch.
Retracements: Expect a pullback to the $3,360-$3,365 range, where order blocks, 4H Fair Value Gaps (FVG), and Hourly Imbalance Fair Value Gaps (IFVG) form a powerful demand zone.
🎯 Trading Plan
Entry Point: Prepare to short around $3,360-$3,365 as gold retraces to this strong PD Array.
Stop Loss: Place above $3,385 to avoid the daily and 4H FVG zone ($3,375-$3,385), which should act as resistance.
Target: Aim for $3,240, the Equal Lows, with updates on short-term targets to follow.
Note: The $3,375-$3,385 range is a balanced zone—unlikely to be revisited soon.
🚨 Why Act Now?
This setup offers a golden (or should I say bearish gold?) chance to capitalize on the market’s momentum. The chart’s clear levels and the false breakout signal a high-probability move. Stay tuned for real-time updates as we track this trade!
💬 Join the Conversation!
Loved this analysis? Hit the Like button to show your support! ❤️ Follow me for more actionable insights, and drop a comment below—where do you see gold heading next? Let’s build a thriving TradingView community together! 🙌
Happy trading, and may your trades be as sharp as this analysis! ✨
XAUUSD Analysis TodayHello traders, this is a complete multiple timeframe analysis of this pair. We see could find significant trading opportunities as per analysis upon price action confirmation we may take this trade. Smash the like button if you find value in this analysis and drop a comment if you have any questions or let me know which pair to cover in my next analysis

GOLD imminent possible buys up to 3,370 This week’s price action on GOLD is shaping up to be very interesting. After weeks of sustained bearish pressure, price has now entered a discounted 2hr demand zone sitting at a swing low, which makes it a high-probability area for a bullish reaction, especially as markets open.
If we do get the expected bullish reaction from this level, I’ll be watching the 3,370 region, where there’s a clean 5hr supply zone. If price reaches that level, I’ll be looking out for distribution and a potential short setup from there.
Confluences for GOLD Longs:
Price has been very bearish recently, so a retracement is expected
Currently sitting in a discounted 2hr demand zone
The overall long-term trend is still bullish
Early signs of accumulation and bullish reaction from this zone
P.S. If price fails to hold this current demand zone and breaks lower, then bearish momentum may continue. In that case, I’ll look for new long opportunities around 3,290 where a deeper demand zone exists.

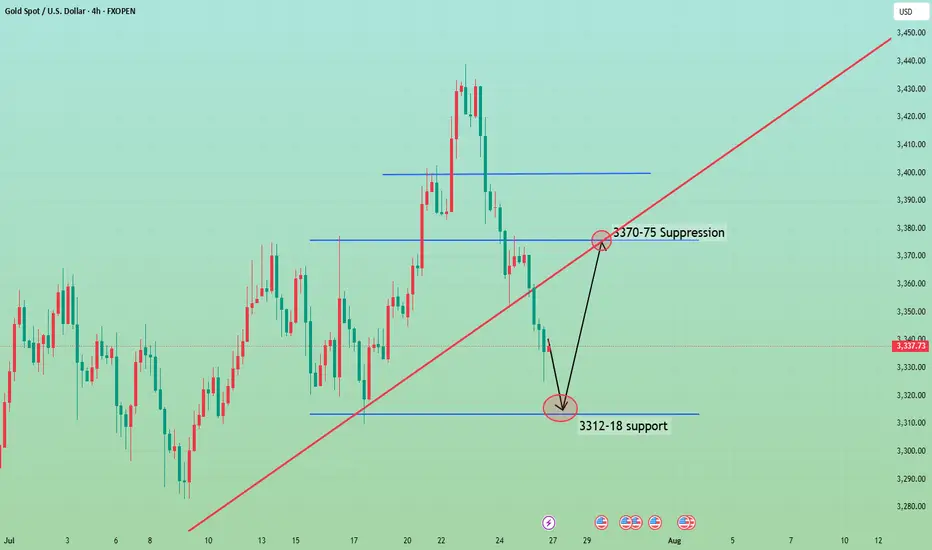
Gold may rebound.From the 4-hour analysis chart, we focus on the short-term suppression of 3370-75 on the top, and focus on the suppression of 3397-3400 on the first line. After all, gold fell and broke through here this week, and then fell southward. Below, we focus on the support of 3312-18.
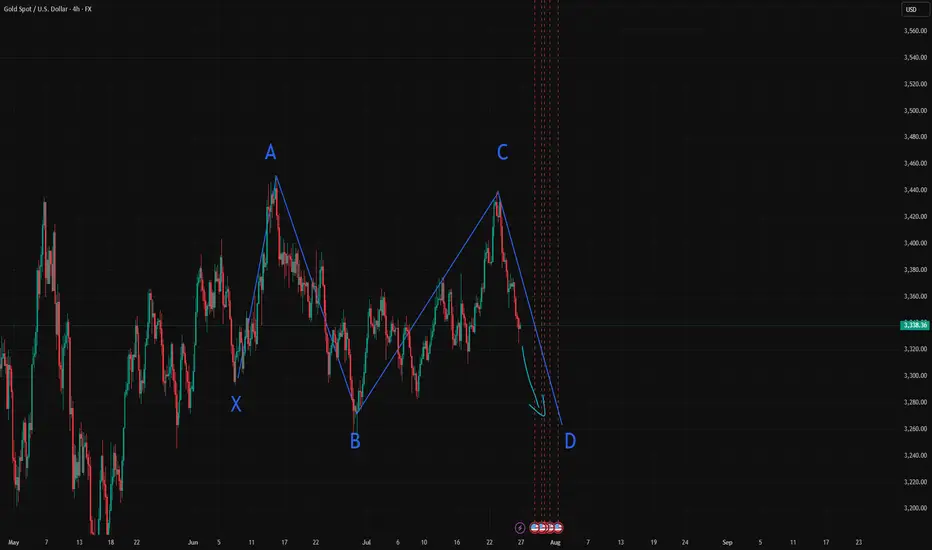
GOLD gartely , XAUUSD ShortLooks like a perfect gartely pattern here on 4h frame , gold might go bearish to 3260
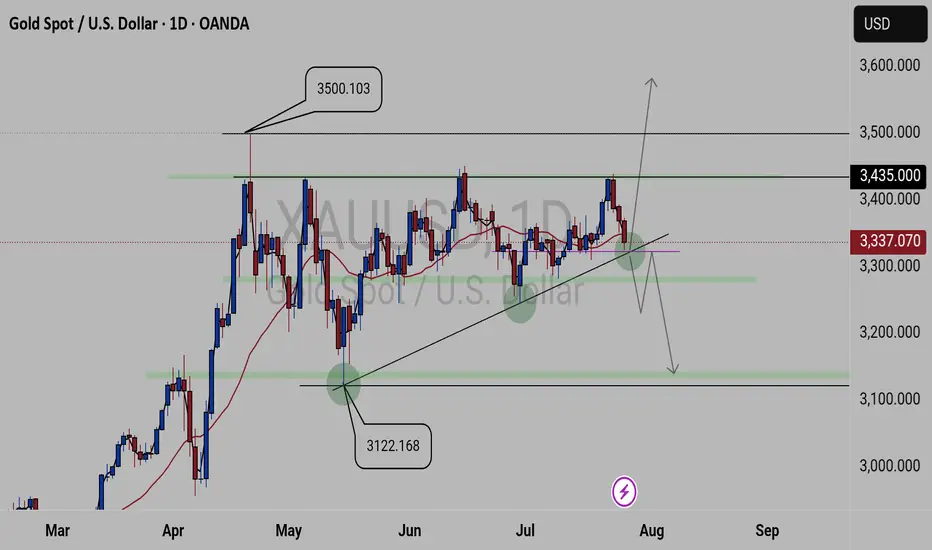
XAUUSD FORECASTThis is what we currently see on
GOLD.
We have 3500.103 key level as our current high zone and 3122.168 key level as our low zone. And Gold is been attempting to break 3435.00 key level resulting in selling, but been creating lower highs failing to break the created lows. Currently we a trading above the 3337.070 key level which is a critical key level, as it will determine the next coming movement.
Update will be given
XAUUSD 4H Technical Outlook The current market structure on the 4H timeframe shows a clear sweep of a liquidity pool near the recent highs (~3,348), followed by a strong bearish reaction. Price action suggests a short-term shift in momentum toward downside targets.
🔻 Bearish Scenario
After liquidity was grabbed above the recent highs (highlighted in the orange circle), price rejected sharply. The next critical level lies at the Bullish OB (LTF) around the 3,325–3,337 zone. A break below this could lead to a deeper retracement into the Fair Value Gap (FVG) and demand zone at 3,150–3,244.
📍 Key Levels:
Resistance: 3,347 – 3,439
Support: 3,244 – 3,150 (watch for reaction in the FVG zone)
Intermediate target: 3,244.41 (Low)
🟢 Bullish Case
If price finds support at the OB and respects the ascending trendline, we could see a reversal back to re-test the upper resistance near 3,438.
📈 Bias: Bearish until price confirms support above 3,337 and reclaims liquidity zone.
🔔 Watch for:
Price reaction at OB (3,325–3,337)
Break and close below 3,244 could accelerate selling
Potential long setup from FVG with bullish confirmation

Gold - The clear top formation!🪙Gold ( TVC:GOLD ) just created a top formation:
🔎Analysis summary:
Over the past four months, Gold has overall been moving sideways. Following a previous blow-off rally of about +25%, this cycle is very similar to the 2008 bullish cycle. Bulls are starting to slow down which will most likely result in the creation of at least a short term top formation.
📝Levels to watch:
$3.000
🙏🏻#LONGTERMVISION
Philip - Swing Trader

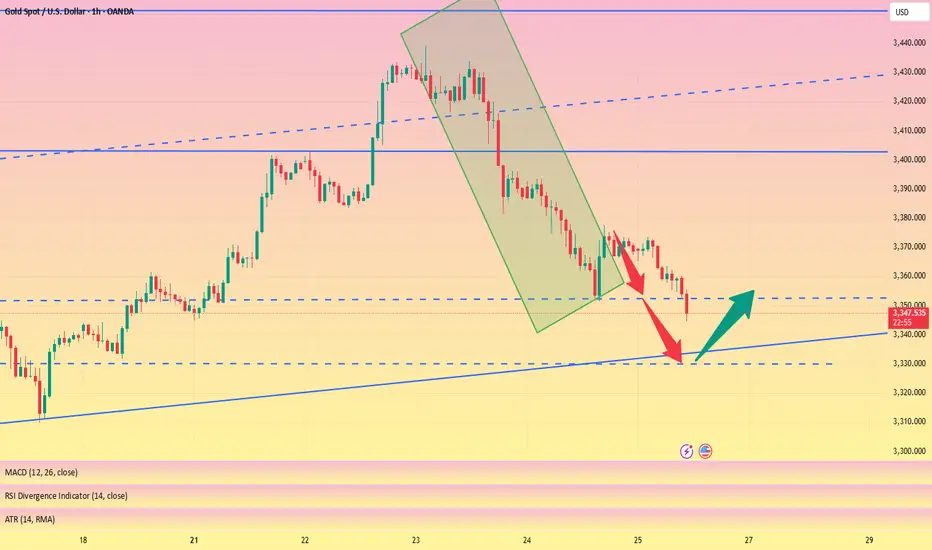
Gold (XAU/USD): Supply Zone Rejection & Bearish Breakdown Chart Breakdown:
Supply zone rejection: Gold revisited the “supply zone” (light green/grey area) and failed to break above — a classic signal of seller dominance.
Uptrend invalidated: A sharp rise (steep black trendline) ended with a peak marked by the green arrow, followed by a decisive breakdown.
Ichimoku Cloud test: Prices slipped through the Ichimoku components, reinforcing the shift to bearish sentiment.
Potential targets: The red/green risk‑reward box highlights a short position, targeting ~3,347 then ~3,318 levels (blue labels) as initial support zones.
Strong supply base: The extensive grey zone below marks a "stronger supply zone" — this could cap any modest bounce and keep the downtrend intact.
🔍 Interpretation:
Bias: Bearish — sellers have taken control after a failed breakout.
Strategy: Short on rallies toward the mid‑green/red box (~3,373–3,380), targeting ~3,347 first and then ~3,319. Watch for support at the strong supply region (~3,292) for potential reversal or consolidation.
Risk management: Keep stop above the red zone—above recent highs (~3,380+) to limit risk.
🚀 In a nutshell: After failing to break supply and losing its short‑term uptrend, gold appears poised for a pullback. The next key levels to watch are ~3,347 and ~3,319—where buyers might step back in, or the downtrend continues toward the deeper supply base.

Wait for 3330 to buy the bottom and reduce unnecessary operation#XAUUSD
We have made good profits from short selling yesterday. Currently, gold has fallen to 3350📎. The 4HMACD death cross has increased in volume and is expected to continue to decline. Consider going long near 3330📈. I don’t think it is prudent to bottom out at 3340. Move forward steadily on Friday and reduce unnecessary operations⚖️.
🚀 BUY 3335-3330
🚀 TP 3345-3362
Be alert to new lows, pay attention to 3350 and go long at 3330📰 News information:
1. Tariff issues
2. Next week's NFP data
📈 Technical Analysis:
Last night, gold rebounded to only around 3377 before starting to fall back. Our judgment that the current rebound is weak is completely correct. 3350 is the support point of the bottoming out and rebounding to nearly $20 last night. Whether the European session can go down to 3350 will determine the trend of gold.
From the daily chart, the daily line has fallen for two consecutive days, suggesting that the price may continue to fall today. At present, we need to pay attention to this week's starting point of 3344-3345, and then the 3330 line below. The extreme decline is 3320-3310. At the same time, the narrowing of the daily Bollinger Bands is also paving the way for next week's NFP data.
From the 4H chart, the current MACD indicator crosses and increases in volume, and the middle track of the Bollinger Bands and SMA30 basically overlap near 3388. As for the hourly chart, the upper pressure is mainly concentrated near 3375-3377, which is also the high point of the rebound last night. If gold rebounds directly upward and encounters pressure and resistance at 3375-3385 for the first time, you can consider shorting and strictly implement stop loss.
Overall, if the current market falls to 3350-3345 for the first time and gets effective support, you can consider going long with a light position, defend 3340, and look to 3356-3362; if the decline is strong and continues to fall below 3350, the best stable long point for the day is 3330-3320, defend 3310, and earn $10-20 to leave the market.
🎯 Trading Points:
BUY 3350-3345
TP 3356-3362
BUY 3330-3320
TP 3345-3360
In addition to investment, life also includes poetry, distant places, and Allen. Facing the market is actually facing yourself, correcting your shortcomings, facing your mistakes, and exercising strict self-discipline. I share free trading strategies and analysis ideas every day for reference by brothers. I hope my analysis can help you.
TVC:GOLD PEPPERSTONE:XAUUSD FOREXCOM:XAUUSD FX:XAUUSD OANDA:XAUUSD FXOPEN:XAUUSD