Gold Market Analysis for Next WeekLast Friday's chart analysis was highly consistent with the market trend, and satisfactory results were achieved in trading.👉👉👉
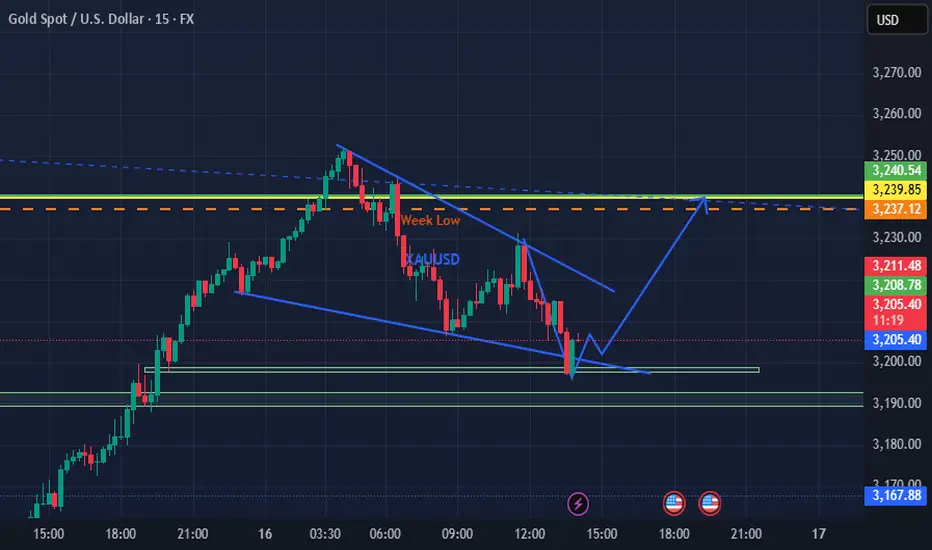
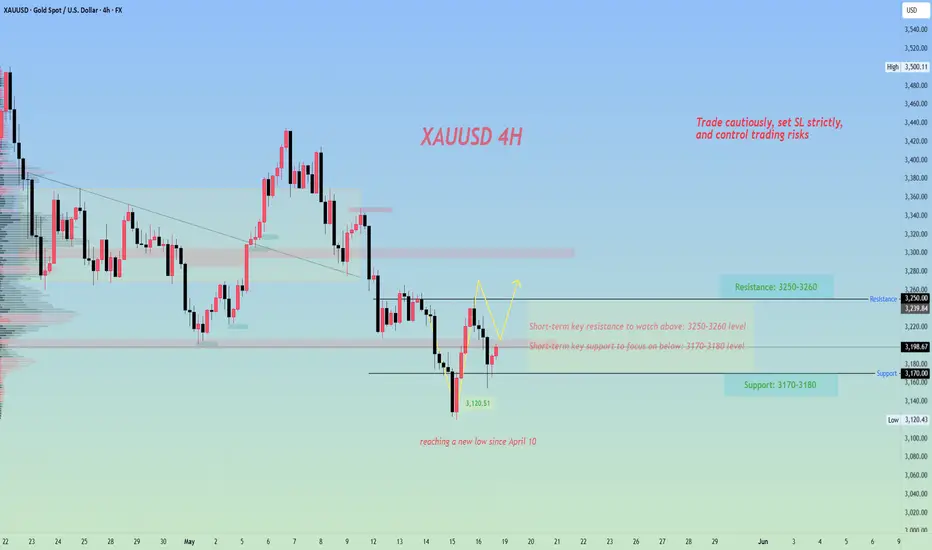
Based on the 4-hour trend analysis, for the opening of gold on Monday, we will first focus on the short-term resistance at the 3,224-3,230 level, and the key resistance at the 3,253-3,260 level. Below, we will pay attention to the short-term support at the 3,170-3,175 level. The operational suggestion is to focus on shorting on rebounds.
XAUUSD trading strategy
sell @ 3230 - 3240
sl 3260
tp 3215 - 3220
If you think the analysis helpful, you can give a thumbs-up to show your support. If you have different opinions, you can leave your thoughts in the comments. Thank you for reading!👉👉👉
Xauusdupdates

Gold Market Summary for Last WeekLast Friday's chart analysis was highly consistent with the market trend, and satisfactory results were achieved in trading.👉👉👉
On Friday, the international gold price fell, potentially recording its largest single-week decline in six months. This trend is mainly attributed to the strengthening of the U.S. dollar and the easing of concerns about the China-U.S. trade war, which together weakened gold's appeal as a safe-haven asset. Gold prices plummeted by more than 2% at one point on Friday, with a cumulative decline of nearly 4% this week—largely driven by increased risk appetite brought about by the trade agreement—marking the largest single-week drop since last November.
The mitigation of the trade war has led to a rebound in risk appetite across the market. This shift has prompted futures traders to take profits, particularly in the gold market, triggering a week-long wave of position liquidation. Gold has faced pressure in recent weeks as the market has ruled out stagflation expectations and repriced rate-cut expectations. Currently, the market expects the Federal Reserve to cut interest rates by approximately 58 basis points by the end of the year, compared to 120 basis points at the peak of panic in April. However, in the short term, the repricing of rate-cut expectations may exert pressure on gold.
XAUUSD trading strategy
sell @ 3230 - 3240
sl 3260
tp 3215 - 3220
If you think the analysis helpful, you can give a thumbs-up to show your support. If you have different opinions, you can leave your thoughts in the comments. Thank you for reading!👉👉👉
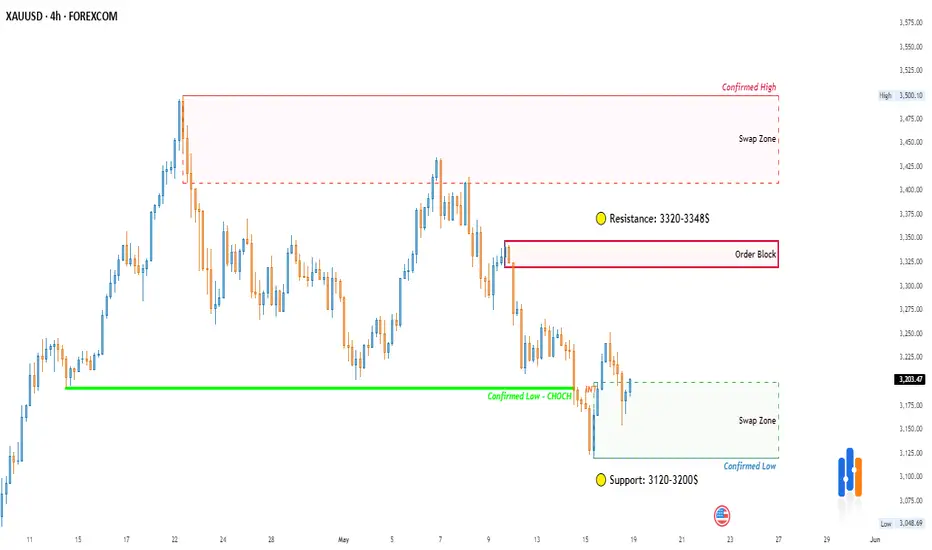
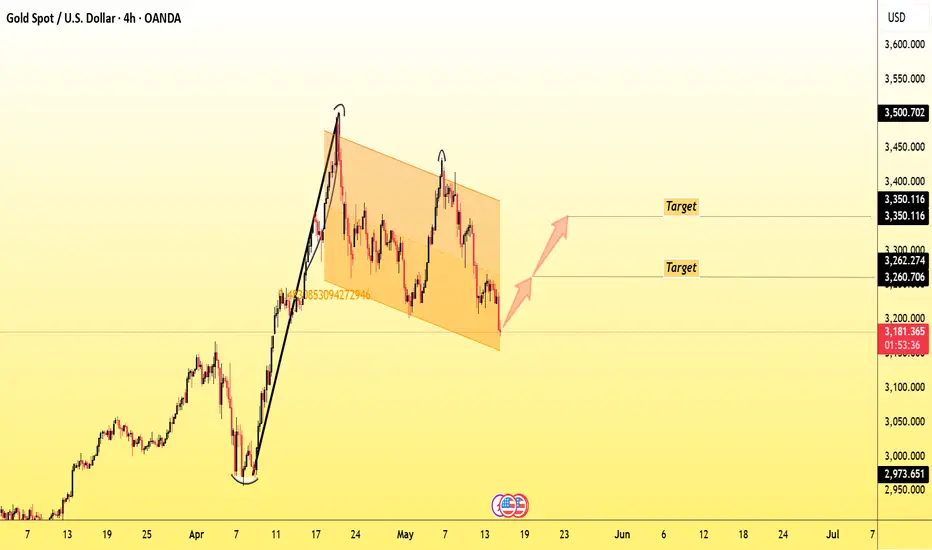
gold(4H)📌 Gold (XAU/USD) - Key 4H Levels
🔍 Critical Zones:
▫️ Resistance: 3320-3348$
▫️ Support: 3120$
▫️ Trend: Bullish above 3120$
⚡️ Trade Plan:
• Entry: 3120-3200$
• Target: 3320$ | SL: 3120$
• Risk: ≤1% capital
💬 Poll:
"Which scenario is likely?
1) Break 3348$
2) Reject at 3320$
Reply ↓"
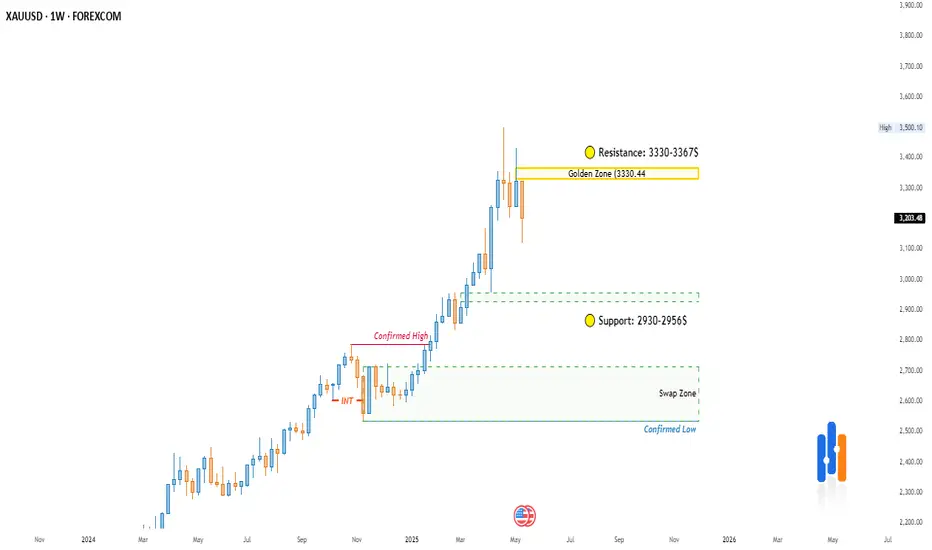
GOLD📊 XAU/USD Weekly Analysis
📅 May 18, 2025
🔍 Key Levels:
▫️ Sell Zone: $3330-3367
▫️ Major Resistance: $3415
▫️ Current Price: $3203
▫️ Target: $2956
⚡️ Scenario:
• Wait for pullback to sell zone
• Sell ONLY with confirmation
⚠️ Warning:
• US rating cut (Moody's) → Potential bullish gap Monday
📌 Risk Management:
• Stop Loss: $3380
• Max Risk: 1% capital
Gold ended this week successfully!In terms of news, first, the easing of the trade situation weakened the safe-haven property of gold. Secondly, a series of data released this week and the Fed's emphasis on not rushing to cut interest rates also suppressed the gold price. In addition, the parties involved in geopolitical conflicts also began talks. Although there are differences in negotiating positions, they still have to solve the problem when they can sit down and talk. Because of the repeated news, the closing price at the end of the week was also above 3200, so some people still believe that the gold price will go to 3500, and even think that it will exceed this position. I have mentioned this in my previous analysis. The gold price was first stimulated by multiple news and buying rushed up. Now that the risk aversion has receded, I think it is reasonable to see the gold price fall.
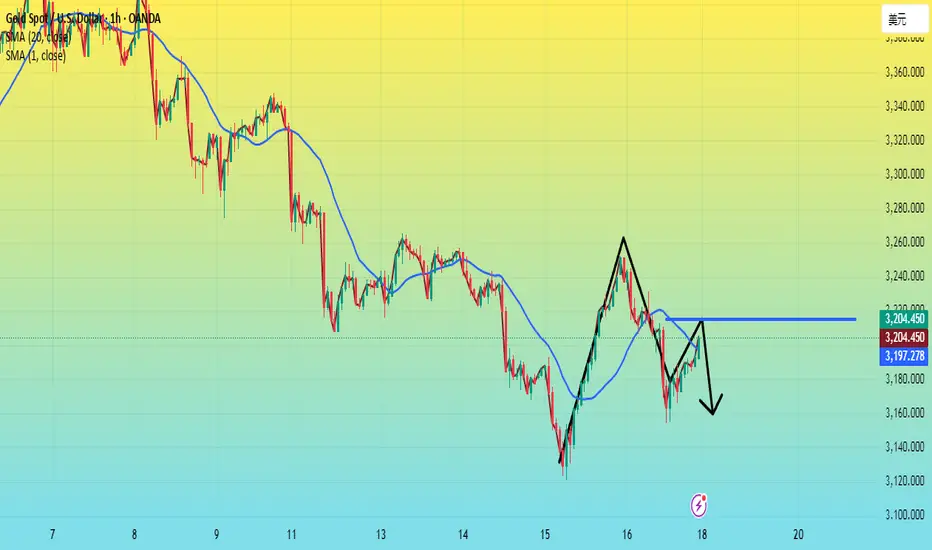
Let's analyze it from the technical side: the rhythm of gold has changed rapidly recently, and next Monday is actually the key. The 1-hour moving average of gold has begun to show signs of turning around, so whether it can form a golden cross upwards is the key next time, or it will oscillate a few times and continue to diverge downward. The strength of gold on Monday is very critical. Gold closed with a big positive line on Thursday, which was a very fast trend. However, it fell directly on Tuesday and broke through more than half, so it cannot be said that the bulls are strong. Although it rebounded slightly in the late trading, it still closed with a big negative line. There will be two key positions on Monday next week. Pay attention to 3180 on the bottom of gold. If it falls below 3180 soon after the opening on Monday, then gold will still be weak as a whole. Pay attention to 3215 on the top. If gold breaks through 3215, then gold will be strong as a whole. If gold opens flat on Monday and the upward momentum is not strong, and it is under pressure at 3215, then you can continue to go short in the short term.
TVC:GOLD OANDA:XAUUSD FOREXCOM:XAUUSD

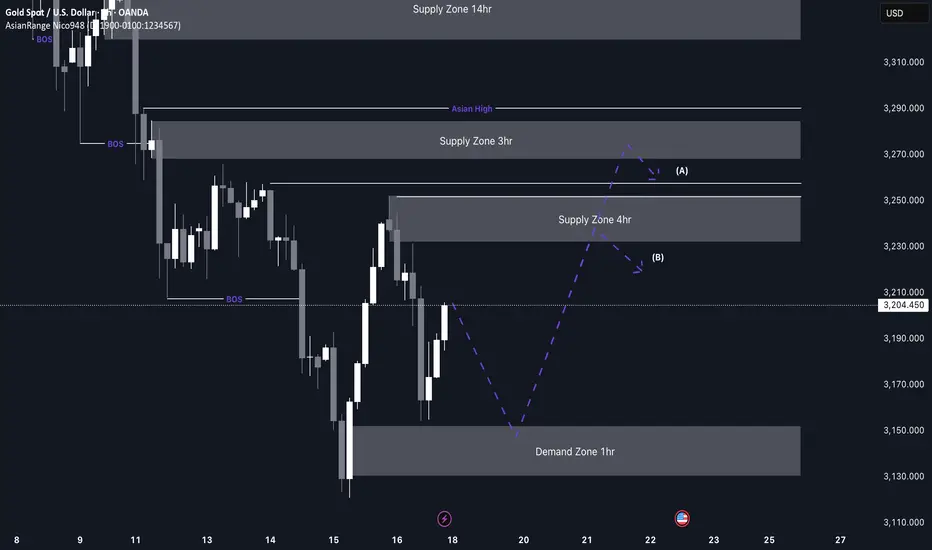
XAU/USD weekly outlook My analysis revolves around the continuation of the current short-term bearish trend. To capitalise on this move, I’ll be watching for price to mitigate either the 4-hour supply zone or the 3-hour supply zone. If price instead decides to respect a nearby demand zone, I’ll shift focus and wait for a potential reaction from a 1-hour demand zone.
From there, we could see signs of accumulation followed by a bullish reaction, leading price back up into a supply zone before continuing the sell-off in line with the prevailing trend. However, if price breaks below the 1-hour demand, that would further confirm a stronger bearish bias.
Confluences for GOLD sells are as follows:
- Price has broken structure to the downside, confirming the short-term bearish trend.
- Price is approaching both the 4-hour and 3-hour supply zones, which could act as strong sell areas.
- There is a lot of downside liquidity that remains untapped and could be targeted.
- On the higher timeframes, price appears overbought due to the recent corrective move.
P.S. If price fails to respect the nearby supply zones and breaks through them, I’ll then look for a reaction from a more premium supply level. Overall, my long-term bias remains bullish based on the higher timeframes.
Gold fluctuates greatly. What will happen next week?Gold fluctuated greatly on Thursday and Friday. It is difficult to implement an operation strategy in this market. It is difficult to go short or long. The market does not continue the next day, and there are few suitable trading opportunities in the process of changing the market. So what should gold do next week? Has the rhythm of gold changed again?
The rhythm of gold has changed rapidly recently, and next Monday is actually the key; the 1-hour moving average of gold has begun to show signs of turning, so whether it can form an upward trend is the next key.
The strength of gold on Monday is very important. Gold closed with a big positive line on Thursday, but it fell directly on Tuesday and pierced the support level, which cannot be said to be completely bullish. Although it rebounded slightly in the late trading, it still closed with a real big negative line.
Next week, we need to pay attention to two key positions. Pay attention to $3175 below. If it falls and breaks quickly after the opening on Monday, then gold will still be weak overall; pay attention to $3215 above. If gold breaks through this point strongly and stabilizes above the point, then gold will be strong overall.
If gold opens flat in early trading on Monday and the upward momentum is not strong, then you can continue to short in the short term.
XAUUSD[GOLD]; Is it the beginning of the major correction? XAUUSD dropped from 3265$ to 3127$, as predicted in our previous analysis. However, after touching 3127$, the price has retraced slightly and is currently trading at 3178$. In our opinion, the price can go up to $3220 maximum and reject at that level. We need to wait and see how prices behave. Another possible entry point is at 3178$, which is the current trading price. We believe this region is good for selling because the price has struggled to break through it. Please use a proper trading plan while trading gold.
As always, this analysis doesn’t guarantee that price will move as described in the chart. Please use your own knowledge and trading plan while trading gold. Good luck and trade safely.
Want to support us? Do the following ❤️
-LIKE THE IDEA
-COMMENT YOUR VIEW
-SHARE IF YOU AGREE
Much love ❤️
Team Setupsfx_

GOLD H4 Weekly Chart Update For 19 - 23 May 25As you can see that GOLD H4 for weekly term
First of all note all mentioned levels Carefully, right now market just close above 3200 psychological level
2 upside GAPS remains in focus for now
1st one around 3330-3340
2nd one is 3430
so keep in mind overall trend is remains bullish for now on senior timeframes

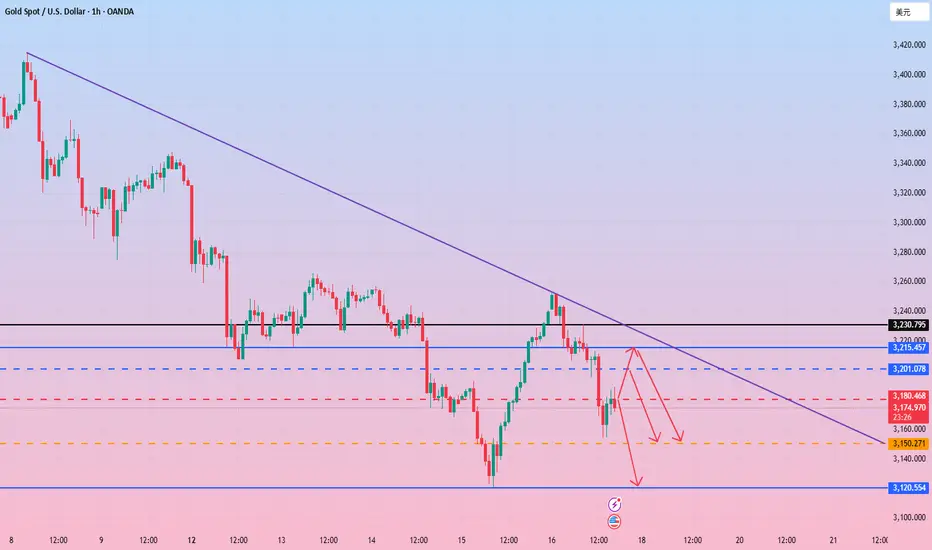
Gold still has room to fall and rebounds to continue to shortGold fell as expected in the Asian session, which was in line with our thinking and expectations. Our short position was shorted near 3237-38 and exited with profit, and then shorted near 3194 and exited with profit again, and we made good profits both times. There are many people who followed the trend and went long in today's market, or even chased the long position, and without exception, they were trapped and wailing. We have repeatedly emphasized that we should treat it with a sweeping approach, and different market rhythms should be responded to with different methods. Judging from the current market trend, the European session continues to weaken. The focus should be on the gains and losses of 3180 support. If it breaks through, it will continue to look at 3150 and 3120. In this case, the short-term will return to weakness. If it does not break, we will look at a wide sweeping range. The upper pressure will focus on 3200, 3215, and 3230. The rebound will be mainly high. The weekly line will be closed tonight, and volatility will intensify.
XAUUSD FLAG BULLISH PATTERN (HIGHER HIGH) ANLYSISThe XAUUSD Market momentum has made a flag bullish pattern showing the strong uptrend had the confirm targets at different zones.
1st Target Zone 3260
Final Target Zone 3350
resistance level: 3100
Conclusion: If the market momentum moves towards target then hold on your trades but if the market moves against to the target then there is an option of stop loss point active and all the trades should be closed.
XAUUSD Waiting for the huntI will wait for the price to react to the red zone to decide how to enter the trade. I think we are at a crucial time for this. The most beautiful visualization for the continuation of the price movement is a pullback to the red zone and a continuation of the decline.
Long orders are trapped,what should we do with the US gold marke🗞News side:
1. India considers using new Indus River project to cut water supply to Pakistan.
2. Pay attention to the news of Russia-Ukraine ceasefire negotiations today
📈Technical aspects:
Gold once fell to around 3170, which is in line with our judgment of bullish weakness. This is why we are not in a hurry to participate in long orders today. I know that many bros also listened to the outside world and went long around 3200, which led to being trapped. At present, the gold price is constantly testing the 3170 support line. If it falls below, it will look to the 3150 support line. If it does not break, it will be treated as a shock. On the top, temporarily pay attention to the 3205-3215 line of resistance. If it encounters resistance and pressure, go short. On the bottom, first pay attention to the 3170 support line, and then pay attention to the 3150-3140 support line. Hold if it breaks.
If you agree with this view, or have a better idea, please leave a message in the comment area. I look forward to hearing different voices.
OANDA:XAUUSD FX:XAUUSD TVC:GOLD FXOPEN:XAUUSD FOREXCOM:XAUUSD

"Buy Setup @3202 – Layered Entry with Smart Risk Management"Buy @3202
🎯 Targets:
TP1 – 3215
TP2 – 3229
TP3 – 3255
TP4 – 3283
🛑 Stop Loss: 3186
✅ Enter in Layers
✅ Follow Proper Money Management
✅ No Over-Leverage – Stick to the Plan

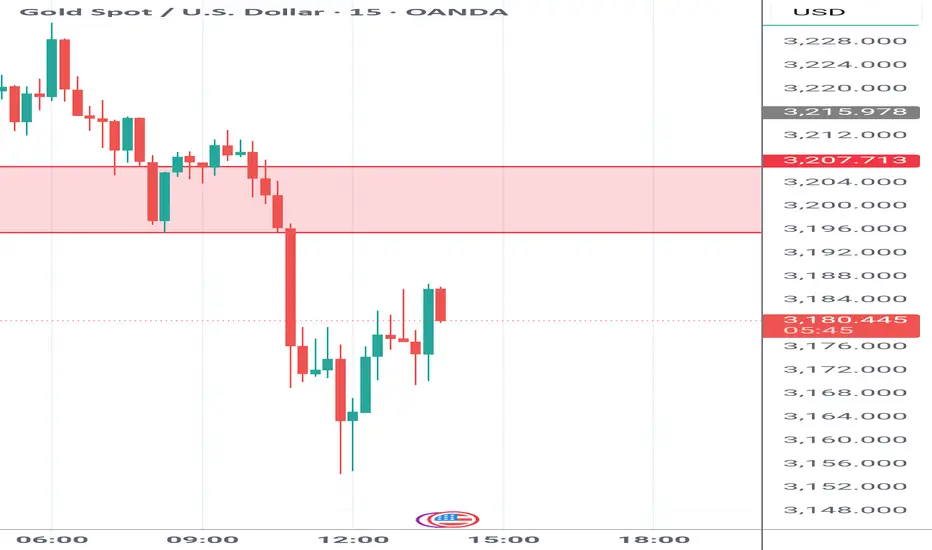
GOLD Update – Short Opportunity After Pullback! Gold traders! 💛 Our key support zone (3,212 - 3,196) has just been broken, and price is now consolidating below! 🎯
We previously took big profits from this level (our followers know!), and now we’re waiting for a pullback to enter a high-probability short trade!
⚡️ Golden Rule:
✅ If price retests the level as new resistance, go SHORT!
✅ If it reverses and breaks back above, consider a LONG!
📌 Always trade with a strategy—be ready for any scenario!
💸 The Secret to Trading Success:
🔹 Keep losses small & controlled.
🔹 Let profits run & grow!
🔹 We can’t control the market, but we CAN control our risk!
🚀 Gold is always hot—what’s your take?
👇 What’s your analysis on this move?
For detailed entry points, trade management, and high-probability setups, follow the channel:
ForexCSP

Gold Bullish Outlook - Gold BullishFollowing strong buying momentum observed yesterday, gold is currently consolidating within a falling wedge pattern — a typically bullish setup. A breakout from this pattern could trigger a fresh upward move in the price of gold.
Post-Breakout Bullish Targets:
Target 1: 3230
Target 2: 3240
Target 3: 3250
Target 4: 3275
Disclaimer: This is a technical analysis-based outlook. Please assess your risk-to-reward ratio and follow your individual trading strategy. This is not financial advice — trade responsibly and according to your plan.