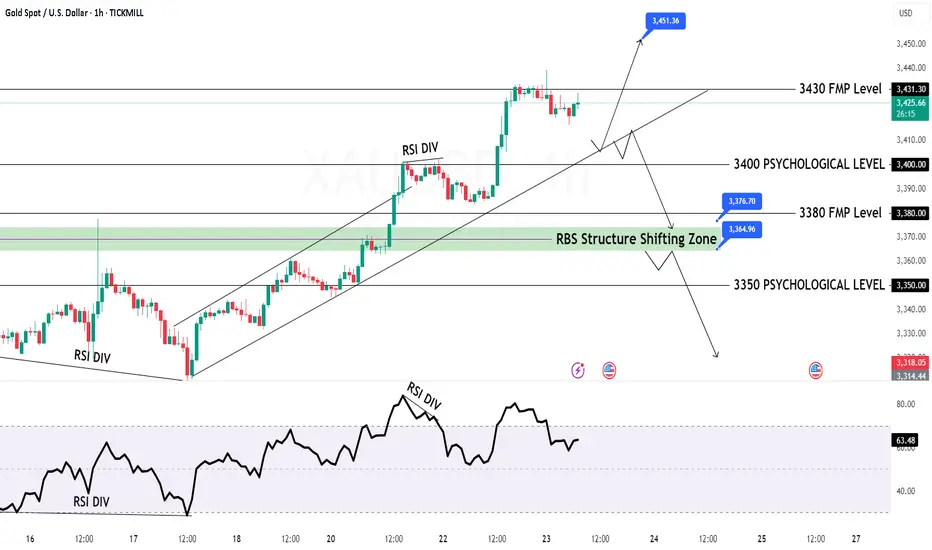
GOLD H1 Chart Update for 24 July 2025Hello Traders,
we got fall yesterday on RSI DIV and right now all eyes on 3350 Psychological level breakout if market successfully breaks that level then it will move towards 3330 or even 3315 level
some retracements remains pending around 3400-3412 zone GOLD will might retrace that zone before going further down
Reminder: PMI's day in the market
Disclaimer: Forex is Risky
Xauusdupdates

Deep Pullback on XAUUSD Gold: What I'm Watching Now🚨 Gold Update & Trade Plan 🚨
Taking a look at Gold (XAUUSD) right now — it's been trending strongly in an uptrend 📈, showing impressive momentum over the past sessions. However, we've recently seen a deep pullback 🔻 that has tapped into a key liquidity pool 💧.
From this level, I'm anticipating a bullish reaction 🔁, and I’m eyeing a potential scalping or intraday opportunity. In the video, we break down:
🔹 Market structure
🔹 Price action analysis
🔹 Trend context
🔹 A complete trade plan
🎯 Entry, stop-loss, and targets are all discussed based on technicals — with precision and discipline.
This is my personal trading plan based on how I read the markets — not financial advice. Trade safe and stay sharp! ⚔️💹

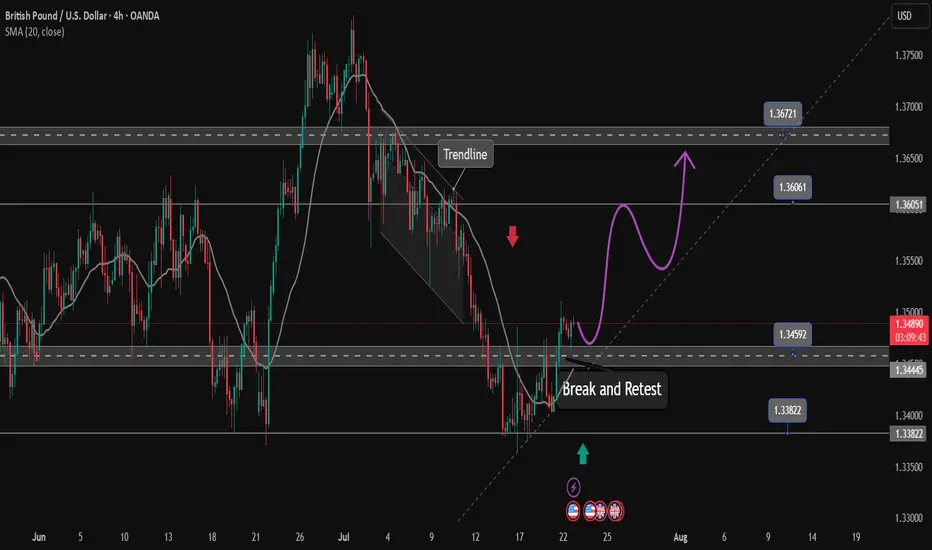
The bearish wave recovery ends and a new bullish wave begins✏️ OANDA:GBPUSD After a long downtrend that touched the important support zone of 1.138 GBPUSD has recovered to the upside. The h4 candle has just closed above the accumulation zone of 1.345 to continue the upward momentum towards the peak of 1.367. The price line also created a trendline supporting the main uptrend of the pair, and the price line can follow the uptrend to the Target.
📉 Key Levels
Support: 1.345 - 1.338
Resistance: 1.360-1.367
Buy Trigger: Rejects above 1.345
Buy zone: 1.348-1.345
Target 1.367
Leave your comments on the idea. I am happy to read your views.
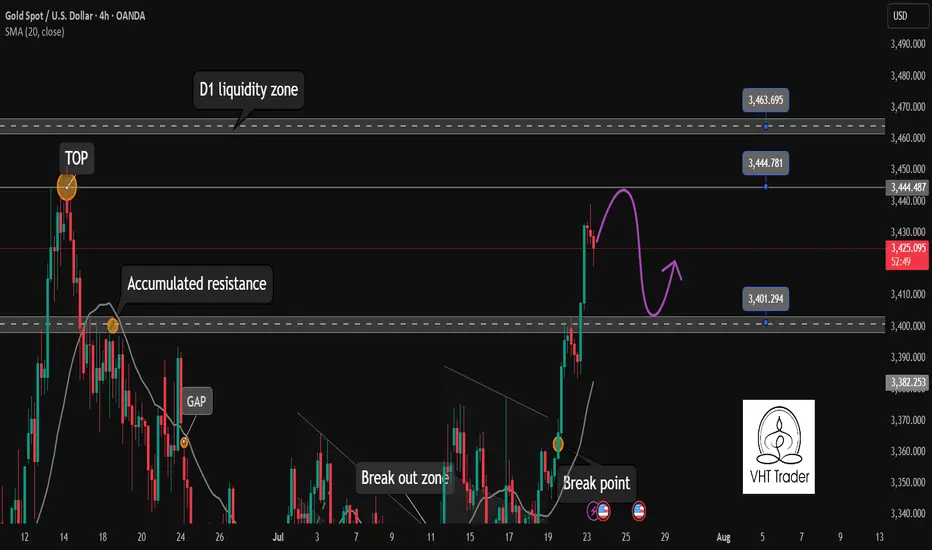
Gold will pause its rally today. Be cautious✏️ OANDA:XAUUSD continues to hit new highs this week. As the daily candle closes above the 3430 area, gold is creating a wide trading range of about 50 prices today. The uptrend may face a slight slowdown due to profit-taking psychology of some investors.
📉 Key Levels
Sell trigger: Rejection from 3445
Sell zone: 3463
Target: 3405
BUY trigger: 3402 (Price retests breakout zone and buyers react)
Leave your comments on the idea. I am happy to read your views.
XAUUSD Buy Setup – VSA + Smart Money Reaction at Demand Zone✅ Entry: Current price action (around 3,392)
🎯 Take Profit 1 (TP1): 3,415
🎯 Take Profit 2 (TP2): 3,446–3,452
🛑 Stop Loss (SL): 3,381 (below the confirmed demand zone)
📊 Technical Insight (VSA-Based Analysis):
The sharp markdown into the demand zone occurred with expanding volume and wide spreads, a classic sign of stopping volume—potential smart money absorption of panic selling.
The second wide-range down candle was followed by lower volume and tighter spread bars, indicating supply exhaustion.
The market is forming a cause (accumulation) at the bottom of this drop, confirmed by:
No follow-through selling despite high volume
Narrow spread candles showing hesitation from sellers
Increasing volume on small up-bars, suggesting hidden buying
The zone aligns with previous structure and lies just above the 0.786 Fib retracement, adding further confluence to the bullish case.

LONG Setup - Smart Money Bias (15m)
## 🟢 LONG Setup - Smart Money Bias (15m)
- **Pair**: XAU/USD (Gold)
- **Timeframe**: 15m
- **Entry Zone**: Around **3390.050**
- **Stop Loss (SL)**: **3377.200**
- **Take Profit Targets**:
- **TP1**: 3402.800
- **TP2**: 3410.500
- **TP3**: 3418.800
---
### 📌 Confluences:
- Demand zone respected and tapped.
- Bullish reaction from POI (Point of Interest).
- FVG (Fair Value Gap) filled and reversal initiated.
- BOS + CHoCH in lower timeframe confirmed.
- Forecast projection aligns with upside inefficiency.
---
### 🧠 Strategy:
- Smart Money Concepts (SMC)
- Liquidity Sweep below demand
- Risk-Reward Ratio: ~1:2.3
🚨 **Note**: Trade with caution around US market open hours (volatility expected).
📌 Disclaimer & Reflection
Before we dive into today's mark down, I want to take a moment to address the previous signal that hit stop loss. As traders, we must acknowledge that losses are part of the process—no matter how solid our analysis may be. I take full responsibility for the outcome, and I appreciate the trust and patience of this community.
Every stop is a reminder that perfection doesn't exist in the markets—only probabilities. What matters most is how we adapt, learn, and continue to evolve.
Let's move forward with clarity and discipline.

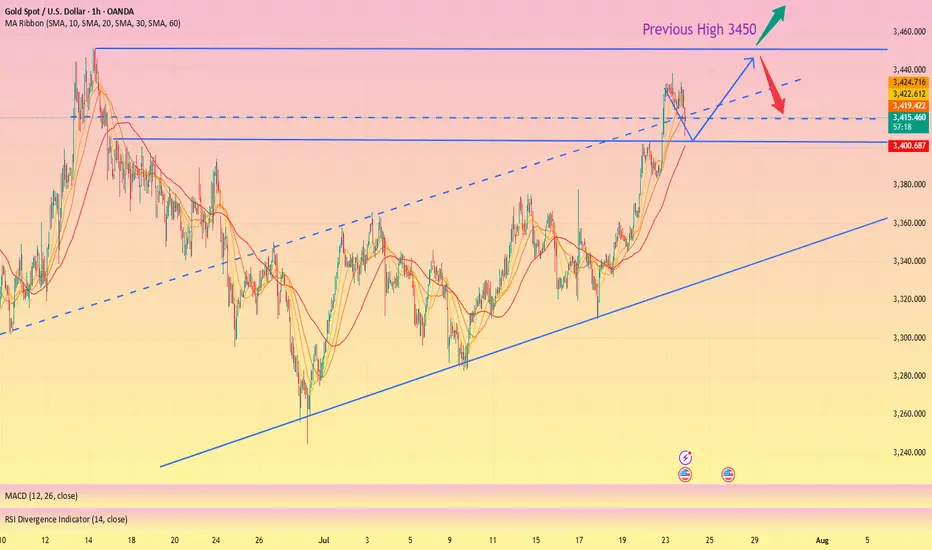
Perfect profit on short position, long TP 3450#XAUUSD
Gold is in an upward trend from the daily chart. From the technical indicators, the SMA5-SMA10 moving averages are golden crosses, BOLL opens upward, the K line runs on the upper track of the daily Bollinger Band, and the MACD continues to increase, indicating that the bullish trend remains unchanged📈.
The approaching August 1st tariff deadline, coupled with uncertainties such as the Federal Reserve, provide short-term support for gold🔍.
📊The current lower support is at 3410-3400. If it falls back to this level during the day, you can consider going long. Gradually check 3430 and 3440 on the upside, and pay close attention to the breakthrough of the 3450 level🏅. If it effectively breaks through 3450, gold is expected to break through the historical high. If it encounters resistance near 3450 as in the previous trend, you can consider shorting📉.
🚀BUY 3410-3400
🚀TP 3430-3440
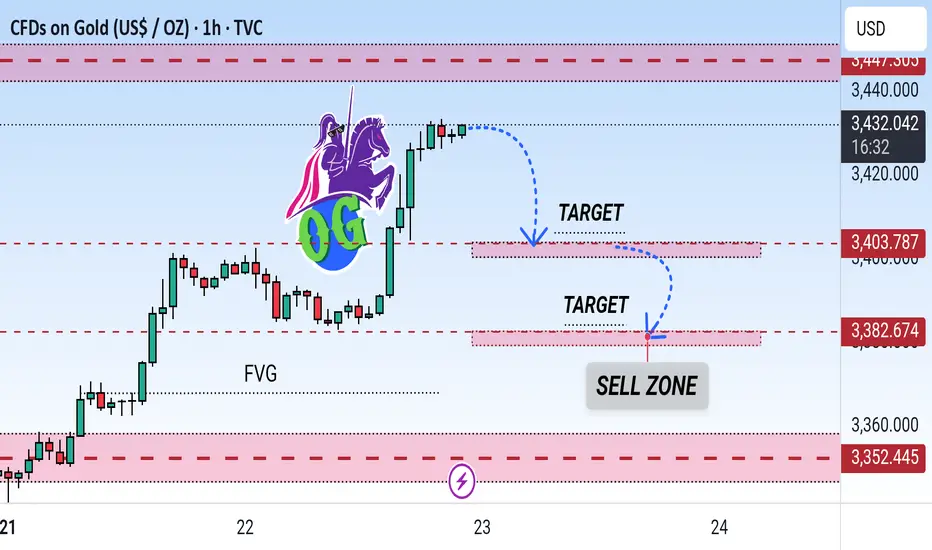
Gold (XAU/USD) 1H Analysis: Sell Zone Identified with Downside This chart shows a technical analysis of Gold (XAU/USD) on the 1-hour timeframe. Price is approaching a Sell Zone near resistance around $3,431, with two downward target levels marked at $3,403.787 and $3,382.674. The chart also highlights a Fair Value Gap (FVG) suggesting potential bearish retracement.
The callback continuity is poor, and the bulls are still strong📰 News information:
1. Geopolitical situation
2. Tariff retaliation
📈 Technical Analysis:
Trump continued to lash out at the Fed, but seemed to have backed off on whether to remove Fed Chairman Powell. The continuous rise of the gold index, once close to 3440, also ushered in a new high in more than a month. Next, we need to pay attention to whether gold can reach the 3450 mark.
Judging from the daily chart, there were three times when it touched around 3450 and then fell back. If it breaks through and stabilizes above 3450 this time, the historical high of 3500 may be refreshed. If it cannot effectively break through 3450, the probability of subsequent retracement is still very high.
From the hourly chart, the bottom support is almost at 3405-3400. However, the recent rhythm belongs to the consolidation of the Asian and European sessions, the US session has begun to rise, and the risk of serious overbought data indicators is still there. This is why I told everyone in the morning that we need to be vigilant about the current rise. Waiting for a pullback to go long is relatively more stable. I also explained in the morning that if it falls below 3405-3400, the decline may continue to around 3385. After all, the fundamental purpose of our trading is to make a profit, so we must minimize the foreseeable risks to the greatest extent possible.
On the whole, if there is an obvious stop-loss signal at 3405-3400, you can consider going long and looking at 3450. Once it falls below 3400, don't chase it easily, and pay attention to the possibility of a retracement below 3385.
🎯 Trading Points:
BUY 3405-3400
TP 3440-3450
In addition to investment, life also includes poetry, distant places, and Allen. Facing the market is actually facing yourself, correcting your shortcomings, facing your mistakes, and exercising strict self-discipline. I share free trading strategies and analysis ideas every day for reference by brothers. I hope my analysis can help you.
FXOPEN:XAUUSD OANDA:XAUUSD FX:XAUUSD FOREXCOM:XAUUSD PEPPERSTONE:XAUUSD TVC:GOLD
Gold Price Analysis July 23📈 Gold Trend Analysis – Strong Uptrend but Signs of Slowdown
Gold continued to set a new peak for the week when closing the day above 3430 – confirming that the uptrend is still dominant. However, buying power is starting to slow down as the market formed a fairly wide range, around 50 prices in today's session.
Profit-taking pressure at high prices can create a short-term correction, opening up two-way trading opportunities for flexible investors.
🔑 Important technical levels (Key Levels):
🔻 Resistance zone & Sell zone:
3445: Price rejection zone – can consider selling if price fails to break through.
3463: Strong Sell zone – expect increased supply here.
🎯 Sell target:
3405: Nearest support, target for short-term sell orders.
🟢 Buy Setup:
3402: Breakout zone in US session – if price breaks strongly through this support with good volume, consider buying on the next uptrend.
gold on bullish#XAUUSD price expect bullish range between 3430, breakout there will take the price above 3450-3453.
Entry on buy 3430, target 3453, stop loss 3419.
Below 3416 holds a strong bearish continuation, target 3400.

Whether gold can hold low is the key.Yesterday, the market fluctuated in a narrow range and corrected around 3402 and then went up to 3383. After repeated sideways movement, the market realized a sprint to 3400 and further accelerated to 3420. The daily line continued to close positively. Pay attention to the following points in the intraday layout;
First of all, from the perspective of the market pattern: after breaking through the wide sweeping space of 3300 as support and 3375 as suppression, the daily line structure showed a continuous rise and stabilized above 3400, and the space gradually moved upward. In the daily line structure, the Bollinger Bands have shown signs of opening upward, which means that the current wind direction is biased towards the bullish direction; under the premise of a biased direction, the operation is to follow the main low and long; the problem that needs to be considered in the short term is how the rhythm shows the switching relationship between direction and adjustment and the reverse The rebound pace (strong rise or more sweeping) are all points that need to be considered in the short term;
Price:
Pressure: 3438/3440, followed by 3450, then 3470 and above 3500
Support: 3415, followed by 3405/3400, then 3380.
Trend and time point:
Previously, it repeatedly swept widely with 3375 and 3300 as support, and finally achieved an upward breakthrough of the 3375 sweeping barrier this week. The daily line showed three consecutive positive climbs above 3400. From the corresponding daily line structure, the Bollinger band has shown signs of opening upward, and the moving average is also slowly rising, that is, the current trend is more bullish; under the premise of a slight tendency in the direction, the oscillation is mainly bullish and is confirmed.

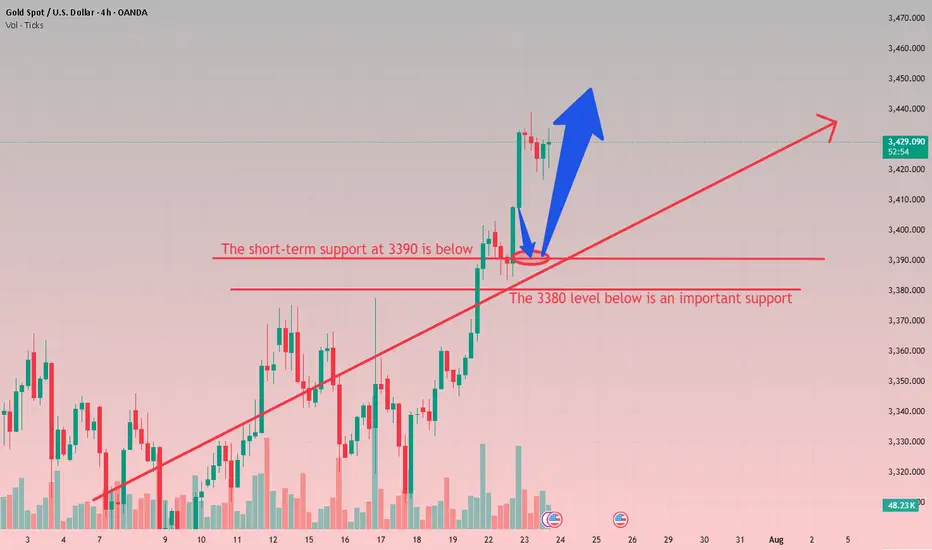
Don't chase gold at high levels, buy more when it falls back to From the 4-hour analysis, today's support is around 3400-10. If the intraday retracement relies on this position, the main bullish trend remains unchanged. The short-term bullish strong dividing line focuses on the 3380 mark. If the daily level stabilizes above this position, the rhythm of retracement will continue. Short positions against the trend should be cautious.
Gold operation strategy:
Gold retracement to 3400-10 line to go long, retracement to 3390-95 line to cover long positions, stop loss 3379, target 3435-3440 line, continue to hold if it breaks;
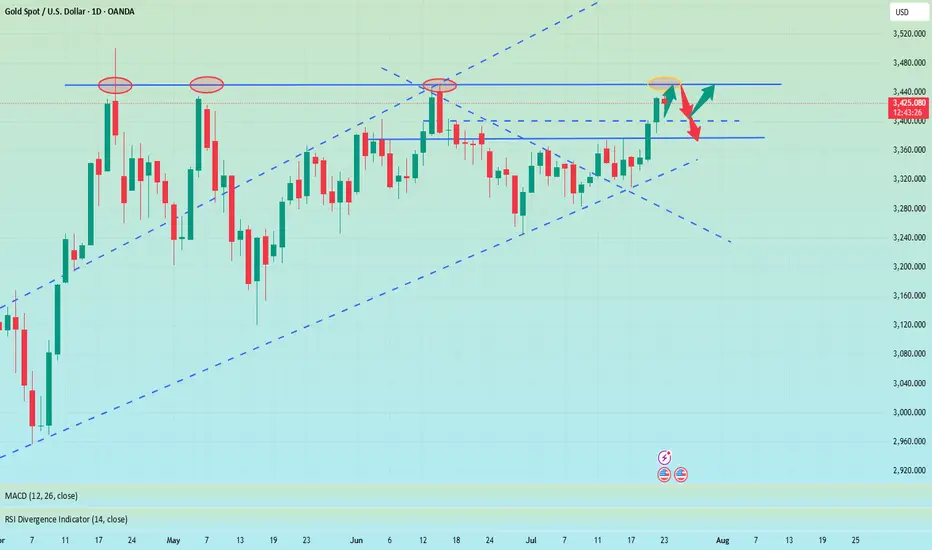
XAU/USD Chart Analysis: Bulls Break Important ResistanceXAU/USD Chart Analysis: Bulls Break Important Resistance
When analysing the XAU/USD chart last week, we:
→ noted that the ADX indicator had reached its lowest level since the beginning of 2025 – a clear sign of declining gold price volatility;
→ highlighted the formation of a large-scale triangle with its axis around the $3,333 level, bounded by a resistance line (marked in red) and the lower boundary of the ascending channel.
Since then, the price has climbed above $3,400 – reaching its highest level since mid-June. According to media reports, the uptick in demand may be driven by escalating geopolitical risks, renewed optimism regarding potential monetary policy easing in the US, and consistent gold buying from central banks.
This suggests that the balance has shifted in favour of the bulls, who have made an attempt to break through the resistance line – an attempt that, so far, appears promising and points towards a potential resumption of the upward trend.
However, today's XAU/USD chart shows that the bulls are now facing a key resistance level at $3,440 – a level that has reversed gold prices downward both in May and June. What will happen in July?
It is possible that, following a prolonged consolidation near the lower boundary of the channel, the bulls have built up sufficient momentum to finally break through this critical level and push gold prices towards line Q, which divides the lower half of the long-term channel into two quarters.
This article represents the opinion of the Companies operating under the FXOpen brand only. It is not to be construed as an offer, solicitation, or recommendation with respect to products and services provided by the Companies operating under the FXOpen brand, nor is it to be considered financial advice.

Seize the opportunity to go long when the price falls backFrom a technical analysis, the current bullish trend is clear and has continuity. In recent trading days, the market has shown the characteristics of "easy to fall but difficult to rise". Even if there is a correction, it is difficult to sustain. The price will rise quickly after a slight adjustment. Therefore, going long with the trend has become the core strategy, and any decline is an opportunity to arrange long orders. In terms of support, the daily level near 3400 constitutes a key support. If the price is close to this area, you can arrange long orders; the hourly level near 3420 also has a supporting role, which is suitable for entering the market to go long. For short-term operations, Mr. Weng suggested waiting for the price to rebound above 3450 before considering shorting in the short term. Judging from the current strong pattern, if 3450 is effectively broken, it is only a matter of time before it will rise to 3500. Therefore, it is not advisable to be overly bearish. Strict stop loss and trend trading are the prudent strategies.
XAUUSD 30-Min Chart Analysis: Bullish Move Toward Resistance This 30-minute chart of XAUUSD (Gold vs. USD) shows key support and resistance levels. The price is currently around 3,422.615. Resistance is marked at 3,447.337, while the first and second support levels are at 3,412.474 and 3,404.985, respectively. The chart suggests a potential bullish move toward resistance.

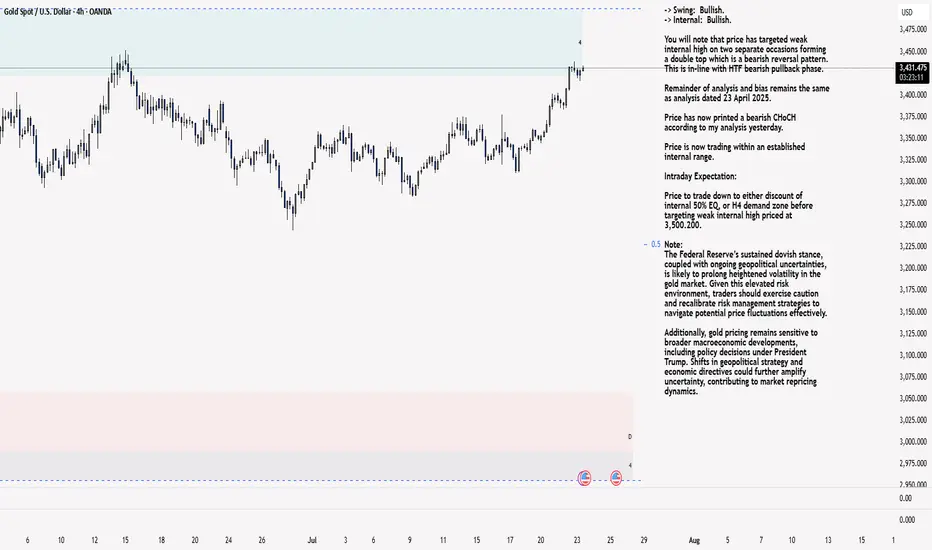
XAU/USD 23 July 2025 Intraday AnalysisH4 Analysis:
-> Swing: Bullish.
-> Internal: Bullish.
You will note that price has targeted weak internal high on two separate occasions forming a double top which is a bearish reversal pattern. This is in-line with HTF bearish pullback phase.
Remainder of analysis and bias remains the same as analysis dated 23 April 2025.
Price has now printed a bearish CHoCH according to my analysis yesterday.
Price is now trading within an established internal range.
Intraday Expectation:
Price to trade down to either discount of internal 50% EQ, or H4 demand zone before targeting weak internal high priced at 3,500.200.
Note:
The Federal Reserve’s sustained dovish stance, coupled with ongoing geopolitical uncertainties, is likely to prolong heightened volatility in the gold market. Given this elevated risk environment, traders should exercise caution and recalibrate risk management strategies to navigate potential price fluctuations effectively.
Additionally, gold pricing remains sensitive to broader macroeconomic developments, including policy decisions under President Trump. Shifts in geopolitical strategy and economic directives could further amplify uncertainty, contributing to market repricing dynamics.
H4 Chart:
M15 Analysis:
-> Swing: Bullish.
-> Internal: Bullish.
H4 Timeframe - Price has failed to target weak internal high, therefore, it would not be unrealistic if price printed a bearish iBOS.
The remainder of my analysis shall remain the same as analysis dated 13 June 2025, apart from target price.
As per my analysis dated 22 May 2025 whereby I mentioned price can be seen to be reacting at discount of 50% EQ on H4 timeframe, therefore, it is a viable alternative that price could potentially print a bullish iBOS on M15 timeframe despite internal structure being bearish.
Price has printed a bullish iBOS followed by a bearish CHoCH, which indicates, but does not confirm, bearish pullback phase initiation. I will however continue to monitor, with respect to depth of pullback.
Intraday Expectation:
Price to continue bearish, react at either M15 supply zone, or discount of 50% internal EQ before targeting weak internal high priced at 3,451.375.
Note:
Gold remains highly volatile amid the Federal Reserve's continued dovish stance, persistent and escalating geopolitical uncertainties. Traders should implement robust risk management strategies and remain vigilant, as price swings may become more pronounced in this elevated volatility environment.
Additionally, President Trump’s recent tariff announcements are expected to further amplify market turbulence, potentially triggering sharp price fluctuations and whipsaws.
M15 Chart:
CFD XAU/USD - 5m Buy Setup# 🟦 CFD XAU/USD - 5m Buy Setup
**Market:** CFD XAU/USD
**Timeframe:** 5 Minutes (M5)
**Direction:** 🔵 BUY
---
## 📌 Setup Details
- **Entry Zone:** Inside the blue arrow structure (curved shape detected)
- **Pattern:** Bullish curve + upward break of micro-structure
- **Bias:** Buy after confirmation of support on blue arrow structure
- **Context:** Momentum pickup after prior liquidity sweep
---
## ✅ Trade Levels
- **Entry:** At the retest of the curved zone (preferably lower wick tap)
- **Stop Loss (SL):** Below the curve base – approx. `SL: XX.XX`
- **Take Profit 1 (TP1):** Reaction to intraday high – approx. `TP1: XX.XX`
- **Take Profit 2 (TP2):** Next visible supply / FVG zone – approx. `TP2: XX.XX`
- **Take Profit 3 (TP3):** Breakout continuation target / 1:3 RR level – approx. `TP3: XX.XX`
---
## 📈 Notes:
- Ensure confirmation via bullish engulfing / momentum candle before entry.
- Avoid chasing — wait for price to tap into demand with low volume.
- Align with overall bias (check higher timeframe 15m or 1h).
---
*Posted by @Persiaux_King 👑*

3400 has been reached, wait patiently for a pullback to go longGold opened on Monday with a volatile rise. After breaking through the 3360-65 area, the bulls turned strong. After breaking through the 3375~80 area in the evening, the bulls accelerated their rise, reaching the highest point of 3402. It fluctuated sideways in the late trading, and the daily line closed at around 3397 with a big positive line! Gold temporarily broke the small range oscillation pattern, but the bulls were not strong, and it still fluctuated upward.
From the perspective of the intraday cycle, after yesterday's rapid rise, the market fell into a serious overbought state; however, yesterday's $60 big positive line supported the bulls, and it is expected that the market will fluctuate; the next focus is still the 3400 mark area. The pressure in the 3400~05 area was dense last night, and adjustments may be made at any time before the breakthrough; and since the rise of 3282, it has just touched the upper edge of the parallel channel. The big sweep will continue, but the range is constantly changing!
So although gold broke the recent volatility yesterday and hit the 3400 mark with a big positive line; however, if it cannot stand above it, then it will continue to fall; recently we have repeatedly and many times emphasized the importance of the 3400 mark. If it stands here, the market will gradually rise to 3420~25 and break through to the 3450 area before looking for a decline.
Today we will continue to focus on the 3400 mark area. First, we will rush to the high altitude, with the goal of retracement to the 3375 and 3356 regional support platforms, and then pay attention to long opportunities; if the bulls stand above the 3400 mark, they will further bullishly impact 3420~25 and break through the 3450 area before falling back.
OANDA:XAUUSD
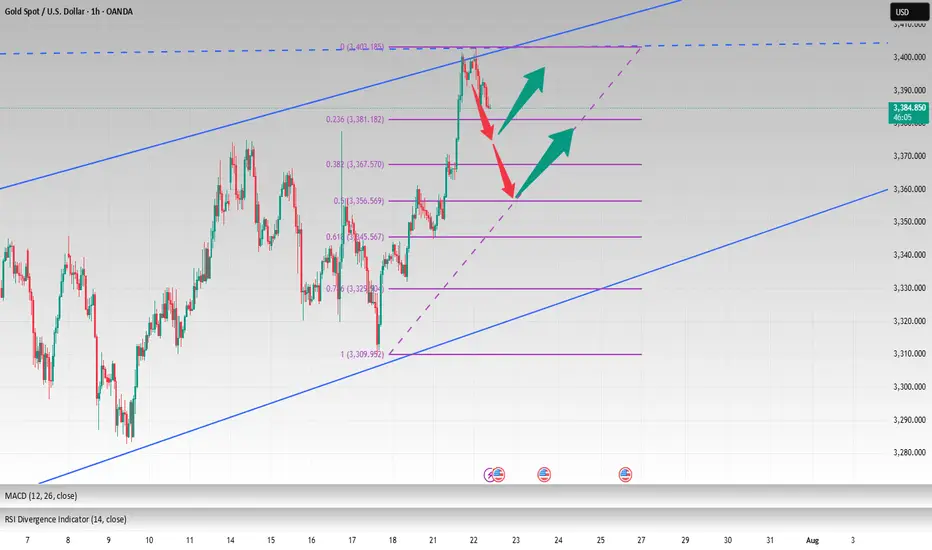
Gold Faces Key Fibonacci Resistance Is the Bullish Momentum FadiTrend Structure: Gold remains in a short-term bullish structure, with a clear series of higher highs and higher lows. However, price action shows signs of hesitation near a critical Fibonacci extension zone.
Key Resistance Zone:
$3,428 – $3,438: This area aligns with the 0.618 Fibonacci extension at 3,428.59 and the 0.0 level at 3,438.56, forming a confluence resistance zone that has started to trigger selling pressure.
Immediate Support Levels:
$3,422.62: The 1.0 Fibonacci extension, serving as the first support on a minor pullback.
$3,408 – $3,410: A potential bounce zone combining short-term trendline support and prior consolidation structure.
Fibonacci & Price Waves: The recent bullish leg from $3,330 to $3,438 has completed a 3.618 extension (noted at $3,330.91 on the purple projection). This increases the probability of a corrective retracement.
EMA & RSI (suggested for confirmation): EMA20 (not shown) should act as a dynamic support. Watch RSI for potential overbought signals or bearish divergence if it crosses above 70.
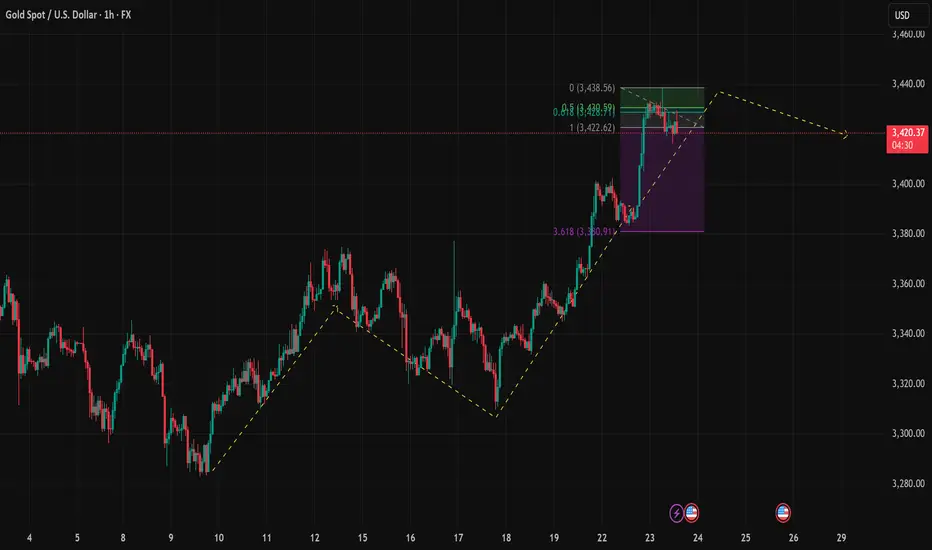
Trade Setups to Watch: Scenario 1 – Short Setup at Fibonacci Resistance Entry: $3,428 – $3,432, only if price action confirms rejection (e.g., bearish engulfing, pin bar)
Stop Loss: Above $3,438
Take Profit 1: $3,422
Take Profit 2: $3,410 (if trendline breaks)
Scenario 2 – Buy Setup on Pullback Entry: Around $3,408 – $3,410 upon bullish price action confirmation
Stop Loss: Below $3,400
Target: $3,428
Final Thoughts: Gold is approaching a strong resistance zone, and short-term pullback is likely unless bulls break through $3,438 with momentum. Traders should stay patient and wait for confirmation signals before entering. Remember: discipline beats impulse.
Follow for more updated strategies during the US session. Save this idea if you find it helpful! Let’s discuss your view in the comments below.
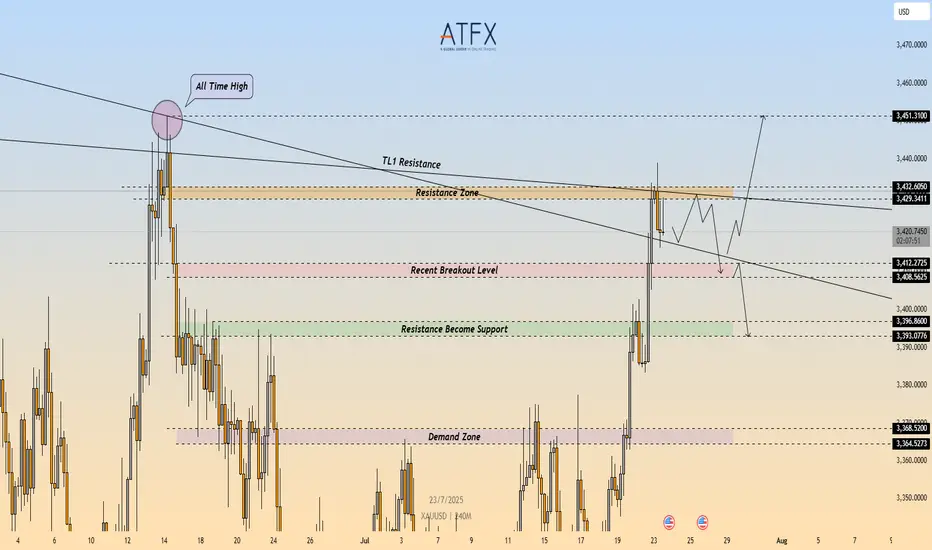
XAU/USD: Bearish Rejection at $3,432 – Short Setup in Play🔴 XAU/USD – Bearish Rejection at Key Resistance Zone ($3,432)
🔍 Technical Outlook
Gold (XAU/USD) failed to break through the $3,429–$3,432 resistance zone, which aligns with a descending trendline (TL1) and prior swing high. The rejection from this confluence zone is reinforcing bearish pressure, with price now carving out lower highs on the 4H timeframe.
A clean break below $3,412 would confirm bearish continuation and open the door toward the $3,400 area, followed by the demand zone at $3,368–$3,365.
🔻 Short Setup
Entry: 3,432
Stop Loss: 3,436
Take Profit 1: 3,412
Take Profit 2: 3,396
R\:R Ratio: ≈ 1 : 6.95
Invalidation: Close above 3,436
📌 Key Levels
Resistance: 3,429 – 3,432
Support 1: 3,412
Support 2: 3,368 – 3,365
Trendline: Long-term descending resistance acting as ceiling
📘 Summary
Gold remains capped beneath a critical resistance cluster. The rejection around $3,432 could trigger a deeper pullback toward $3,396, especially if sellers push price below $3,412. Bearish bias remains valid while price holds under the trendline.
📉 Bias: Bearish
📈 Confirmation Trigger: Break below $3,412
⚠️ Invalidation Level: Above $3,436
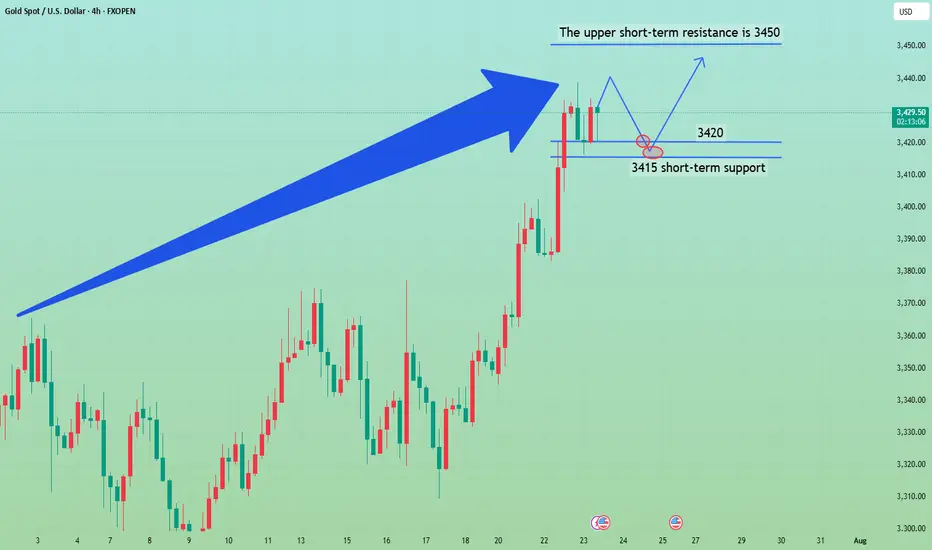
GOLD Intraday Chart Update for 23 July 25Hello Traders
First of all i hope you were enjoying yesterday move with 400 Pips Reward
For today we have 3400 Psychological remains in focus if market breaks below 3400 then it will move towards 3364-76 zone otherwise we are remain buyers above 3400 Level
Strong Resistance zone for intraday is at 3445-3465 if market cross 3465 the it will move towards ATH test which is around 3500
Disclaimer: Forex is Risky
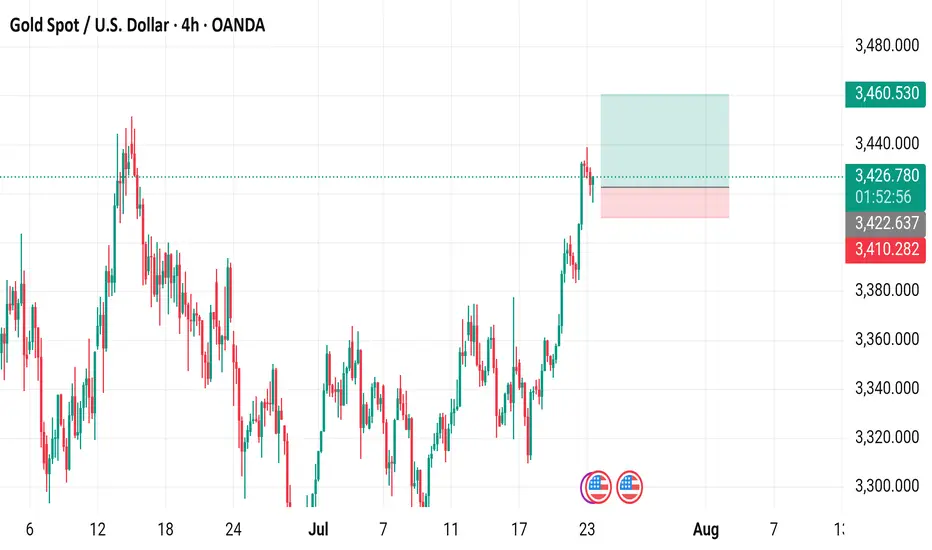
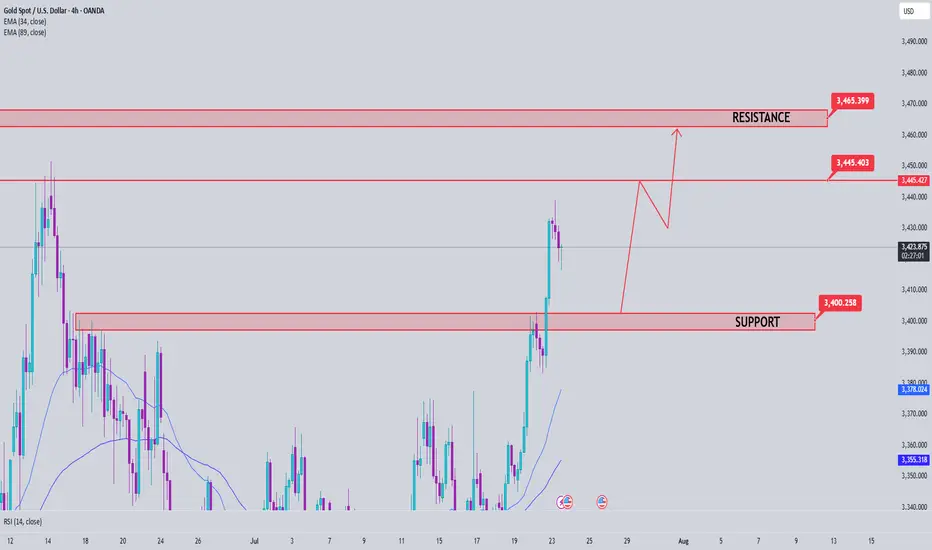
Gold Spot / U.S. Dollar (XAUUSD) - 4 Hour Chart (OANDA)4-hour chart from OANDA displays the price movement of Gold Spot (XAUUSD) from late July to early August 2025. The current price is 3,426.260, with a recent decrease of 5.185 (-0.15%). The chart shows a buy price of 3,426.580 and a sell price of 3,425.950, with a resistance level around 3,460.530 and support near 3,410.282. The data reflects trading activity as of 01:54:22 on July 23, 2025.