Gold Strategy: Long in 3320-3330 & TargetsDuring Friday’s (July 18th) US trading session, spot gold traded in a narrow range with a downward bias 😔, currently hovering around 3350.05. Thursday saw spot gold stage a heart-stopping "deep V" move 😲! Driven by the dual catalysts of the US June retail sales surging 0.6% (beating expectations) and initial jobless claims dropping to 221,000, the US Dollar Index once spiked to a monthly high of 98.95, instantly slamming spot gold to an intraday low of 3309.82. Surprisingly, however, gold prices then staged a strong rebound, closing at 3338.86 with a mere 0.25% decline.
This "fake dip" pattern reveals a deep-seated contradiction in the current market – while economic data temporarily supports dollar strength, investors’ inflation concerns triggered by tariffs are forming an "invisible buying force" for gold 💪. The concurrent rise in the dollar and US Treasury yields has indeed weighed on gold prices, yet robust buying interest emerges at every dip window. Behind this phenomenon lies shrewd capital quietly positioning itself. When the 10-year US Treasury yield climbed to a monthly high of 4.495%, gold refused to fall further – this divergence signals significant market 分歧 over the Federal Reserve’s policy trajectory 😕.
Gold Trend Analysis:
Gold remains in a bullish trend 👍. From the daily chart perspective, gold continued its strong upward momentum today, closing with a positive candle. Technically, the MACD bullish energy bars have started to expand, and the KDJ is in a golden cross heading upward, indicating that the overall price is in a strong phase. As long as gold doesn’t break below 3320, the market is expected to continue its upward trajectory, potentially targeting 3375-3400. If it fails to break through, gold may see a minor short-term pullback. If the pullback doesn’t break 3330, gold is likely to gather momentum again to attack 3375; a break below would shift focus to the 3310 support level. As long as 3310 holds, gold remains in a bullish rebound structure. Next week’s broad range is expected to be 3375-3310.
On the 4-hour chart, the KDJ indicator, after being oversold, has started to turn upward and is now in a golden cross. Notably, this upward move has been accompanied by clear medium bullish candles, making KDJ a more reliable indicator here – the potential for continued bullish candles remains high 😃. The MACD fast line is turning upward at a high level, on the verge of another golden cross, with green energy bars continuing to contract and poised to turn red by inertia. Overall, gold’s current trend is either consolidating or rising. Given the clear bullish bias, we can consider firmly going long first, and only observe the possibility of shorting when KDJ approaches the upper 100 level and the MACD fast/slow lines are about to cross.
Focus on buying on pullbacks. The short-term support levels lie at 3330-3320 – as long as these levels hold, they present buying opportunities. If gold rises during the US session, watch whether 3365 and 3375 are broken; a failure to break through could bring pullback space, offering opportunities for short-term short positions.
Gold Trading Strategy 😎: Go long decisively once on the first pullback to the 3320-3330 range 😏, with targets looking at the 3350-3360 range – just wait for profits to roll in 💰!
🚀 Buy @3320 - 3330
🚀 TP 3340 - 3350
Accurate signals are updated every day 📈 If you encounter any problems during trading, these signals can serve as your reliable guide 🧭 Feel free to refer to them! I sincerely hope they'll be of great help to you 🌟 👇
Xauusdupdates

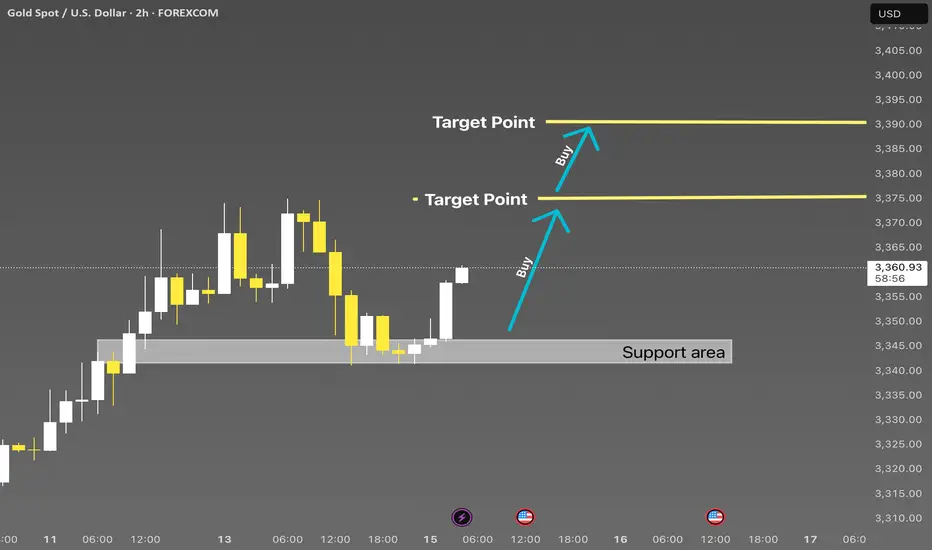
XAUUSD 2H | Smart Money Buy from Strong DemandXAUUSD 2H | Support Rejection with Upside Targets 🎯
Price respected the key support zone and is now showing bullish momentum. Two clear target levels are marked above. Ideal buy opportunity after rejection confirmation from demand zone. Watch for clean continuation toward 3370 and 3390.
#XAUUSD #GoldAnalysis #SmartMoneyConcepts #SMC #Forex #PriceAction #BuySetup
Gold Elliott Wave Bearish SetupGold 8H Analysis:
The chart shows a potential Elliott Wave pattern completing its 5th wave. After hitting resistance near 3383, price reversed at point (4) and is projected to drop toward the support zone near 3281. Bearish momentum expected.

How to operate the gold market opening next MondayAnalysis of gold market trends next week:
Analysis of gold news: Spot gold fluctuated and rose in a narrow range during the U.S. market on Friday (July 18), and is currently trading around $3,354.05 per ounce. On Thursday, spot gold staged a thrilling "deep V" market. Under the dual stimulation of the U.S. retail sales data in June exceeding expectations by 0.6% and the number of initial jobless claims falling to 221,000, the U.S. dollar index once soared to a monthly high of 98.95, instantly suppressing spot gold to an intraday low of $3,309.82 per ounce. But surprisingly, the gold price then rebounded strongly and finally closed at $3,338.86, down only 0.25%. This "fake fall" market reveals the deep contradictions in the current market-although economic data temporarily supports the strengthening of the U.S. dollar, investors' concerns about inflation caused by tariffs are forming a "hidden buying" of gold. The joint rise of the U.S. dollar and U.S. bond yields did suppress gold prices, but strong takeover orders emerged in each falling window. Behind this phenomenon, smart money is quietly making plans. When the 10-year U.S. Treasury yield climbed to a monthly high of 4.495%, gold refused to fall further. This divergence suggests that the market has serious differences on the direction of the Fed's policy.
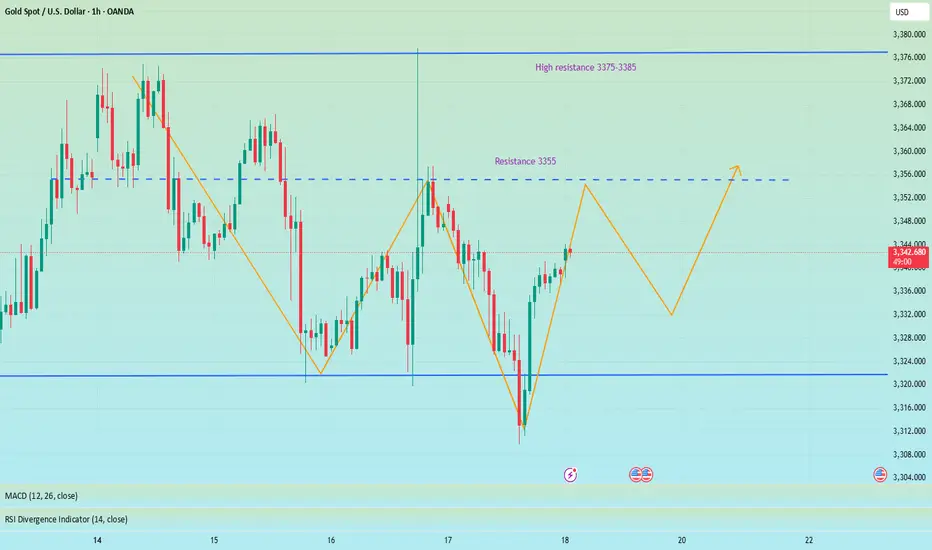
Technical analysis of gold: After the opening yesterday, gold continued to fall slowly, and the negative impact of the unemployment data in the U.S. market further suppressed the bullish momentum. The lowest price in the U.S. market reached 3310, and the cumulative decline for the whole day exceeded 30 US dollars. But the key is that gold rebounded again at midnight, forming a wide range of fluctuations on Thursday, which was completely in line with expectations. The 3310 bottom-picking and long-term strategy given during the session successfully captured large profits in the band. This trend once again verified the core judgment of this week: gold is in a high-level fluctuation dominated by a bullish trend, and the practical value of this view continues to highlight. After clarifying the current dual attributes of "bullish trend + volatile trend", Friday's trading needs to focus on the effective profit space within the range. It is expected that the 3375-3310 large range will be difficult to break this week, and the small range can be locked at 3355-3320. Before the range is broken, high-selling and low-buying operations can be performed.
.
The technical side shows that the daily line and the 4-hour Bollinger Bands are closed synchronously. At this time, there is no need to worry about the direction, and effective trading can be achieved by keeping a close eye on the range boundary. It is worth noting that the 4-hour moving average system has obvious upward divergence characteristics. Continuing the rebound momentum at midnight on Thursday, gold still has room to rise today, and the upper target is 3360-3365. The small cycle support is clear: 3330 and 3320 are not broken, both are good opportunities for long positions. During the US trading session, it is necessary to pay attention to the breaking of the 3365 and 3375 resistance levels: if the pressure is not broken, there will be room for a decline, and short-term short positions can be tried. On the whole, Charlie suggests that the short-term operation strategy for gold next week should focus on buying on pullbacks and buying on dips, supplemented by rebounds and selling on highs. The short-term focus on the upper side is the 3375-3385 line of resistance, and the short-term focus on the lower side is the 3340-3330 line of support. FX:XAUUSD ACTIVTRADES:GOLD VANTAGE:XAUUSD TVC:GOLD ICMARKETS:XAUUSD CMCMARKETS:GOLD SAXO:XAUUSD
Long and short fluctuations, the market is waiting for a break📰 News information:
1. Powell responds to White House issues
2. Will other countries impose reciprocal sanctions on tariffs?
📈 Technical Analysis:
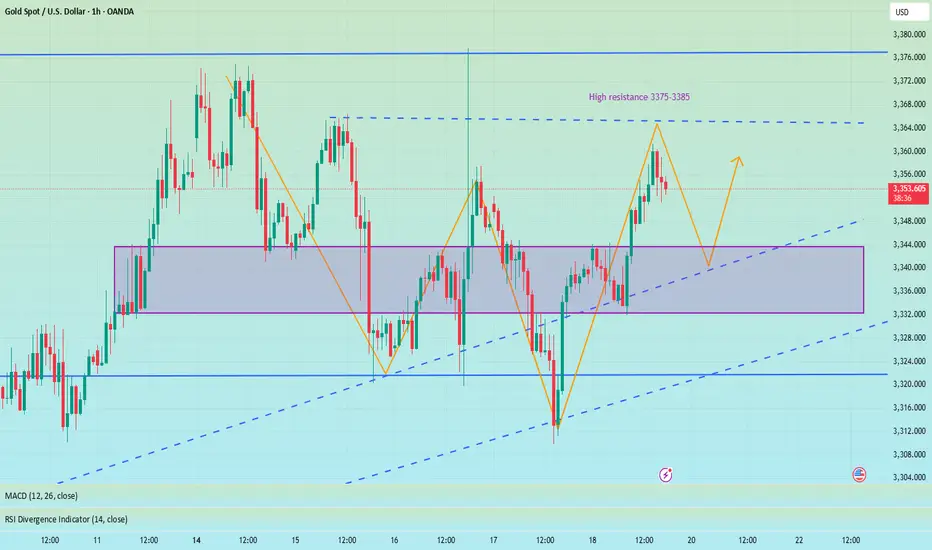
Although the MACD indicator of the gold hourly line formed a golden cross, the market reached a high of around 3361, and the RSI indicator was close to the overbought area, so we need to be cautious about corrections. From the 4H chart, the MACD second golden cross is on the zero axis. Currently, we are paying attention to the moving average SMA5 near 3343, and the SMA60 support line 3332. If the 4H upward trend falls back, we need to go long. At present, gold is still running above, and there is no good participation point in the short term, but on the whole, we should pay attention to the support of 3345-3332 below, and we can consider going long if it retreats and stabilizes. We continue to pay attention to the resistance pressure of 3375-3385 above, and we can try to go short if it does not break.
🎯 Trading Points:
SELL 3375-3385
TP 3365-3355
BUY 3345-3332
TP 3365-3375-3385
In addition to investment, life also includes poetry, distant places, and Allen. Facing the market is actually facing yourself, correcting your shortcomings, facing your mistakes, and exercising strict self-discipline. I share free trading strategies and analysis ideas every day for reference by brothers. I hope my analysis can help you.
FXOPEN:XAUUSD OANDA:XAUUSD FX:XAUUSD FOREXCOM:XAUUSD PEPPERSTONE:XAUUSD TVC:GOLD
The short-selling idea remains unchanged, defend 3355📰 News information:
1. Powell responds to White House issues
2. Will other countries impose reciprocal sanctions on tariffs?
📈 Technical Analysis:
Gold closed with a long lower shadow on the daily line yesterday and closed with a doji on the hourly line. In the short term, gold may continue to rise and is expected to touch the 3355 line. If gold cannot break through and stabilize above 3355, then gold may fall back. We can still consider shorting, and the target can be 3330. If the trend is as expected, it may form the embryonic form of a head and shoulders bottom. On the contrary, if the gold price breaks through 3355, stop loss on short positions and pay attention to the high resistance of 3375-3385.
🎯 Trading Points:
SELL 3340-3355
TP 3330-3320
In addition to investment, life also includes poetry, distant places, and Allen. Facing the market is actually facing yourself, correcting your shortcomings, facing your mistakes, and exercising strict self-discipline. I share free trading strategies and analysis ideas every day for reference by brothers. I hope my analysis can help you.
TVC:GOLD PEPPERSTONE:XAUUSD FOREXCOM:XAUUSD FX:XAUUSD OANDA:XAUUSD FXOPEN:XAUUSD
Gold trend analysis and latest exclusive operation suggestionsTechnical analysis of gold: After the opening yesterday, gold continued to fall slowly. The negative impact of unemployment data in the US market further suppressed the bullish momentum. The lowest price in the US market reached 3310, and the cumulative decline for the whole day exceeded 30 US dollars. But the key is that gold in the New York market rebounded again, forming a wide range of fluctuations on Thursday, which was completely in line with expectations. The 3310 bottom-picking and long-term strategy given during the session successfully captured large profits in the band. This trend once again verified the core judgment of this week: gold is in a high-level fluctuation dominated by the bullish trend, and the practical value of this view continues to highlight. After clarifying the current dual attributes of "bullish trend + oscillating trend", Friday's trading needs to focus on the effective profit space within the range. It is expected that the 3375-3310 large range will be difficult to break during the day this week, and the small range can be locked at 3355-3320. The high-selling and low-buying operations can be performed before the range is broken.
The technical side shows that the daily line and the 4-hour period Bollinger band are closed simultaneously. At this time, there is no need to worry about the direction, and effective trading can be achieved by keeping a close eye on the range boundary. It is worth noting that the 4-hour moving average system has obvious upward divergence characteristics. Continuing the rebound momentum of the New York market on Thursday, gold still has room to rise today, and the upper target is 3360-3365. The small cycle support is clear: 3330 and 3320 are not broken, both are good opportunities for long positions. During the US trading period, we need to pay attention to the breaking of the 3365 and 3375 resistance levels: if they are under pressure and not broken, there will be room for a fall, and you can try short-term shorting. Overall, Charlie recommends that the short-term operation strategy for gold today is mainly to step on the low and long, supplemented by the rebound high. The short-term focus on the upper side is the 3375-3385 resistance, and the short-term focus on the lower side is the 3345-3335 support. PEPPERSTONE:XAUUSD VELOCITY:GOLD EIGHTCAP:XAUUSD ACTIVTRADES:GOLD EIGHTCAP:XAUUSD CMCMARKETS:GOLD EIGHTCAP:XAUUSD

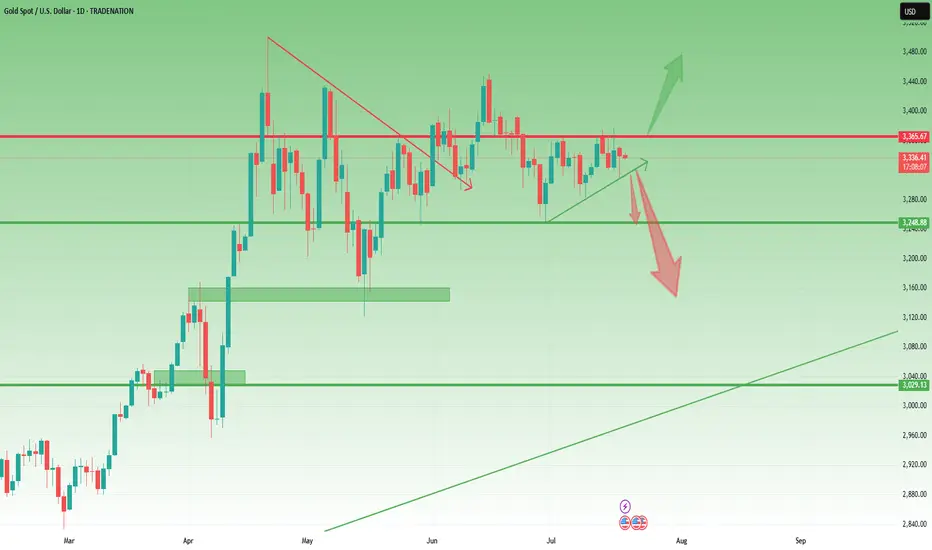
Gold- Still needs to resolve the range🔸 Still Rangebound, But Not for Long
In yesterday’s analysis, I mentioned that two scenarios are in play for Gold:
1. Bullish above 3375
2. Bearish under 3320
Throughout the session, price action leaned toward the bearish side, and I aligned with that by opening a short position. It ended with a minor loss — just 50 pips, which is negligible considering I'm looking for a potential 1,000 pip move in the bigger picture.
________________________________________
🔍 What's Next?
As the title says, Gold still needs to resolve the current range before a clear directional move unfolds.
The same key levels discussed yesterday remain valid and relevant.
And since it’s Friday, today’s daily and weekly candle close will be critical in shaping expectations for next week.
________________________________________
📈 Bullish Case: Close Above 3360
• A daily/weekly close around 3360 would bring strong pressure on the 3375 resistance.
• That could lead to a bullish breakout from the ascending triangle pattern.
• It would also leave behind a bullish weekly pin bar (last week was a bullish pin bar too).
• This scenario would bring 3450 into focus — with 3500 and even a new ATH on the table in the coming weeks.
________________________________________
📉 Bearish Case: Close Near 3300
• A close near 3300 would signal a failed rally attempt
• That would expose 3250 support short term, and 3150 medium term.
________________________________________
🧭 Final Thoughts
At the moment, I’m flat and waiting for clearer confirmation later in the day.
The next move big will be defined by the weekly close — it’s as simple as that.
P.S.: It’s just a hunch , but I’m still leaning toward a break under 3300 as the next major move.
Disclosure: I am part of TradeNation's Influencer program and receive a monthly fee for using their TradingView charts in my analyses and educational articles.
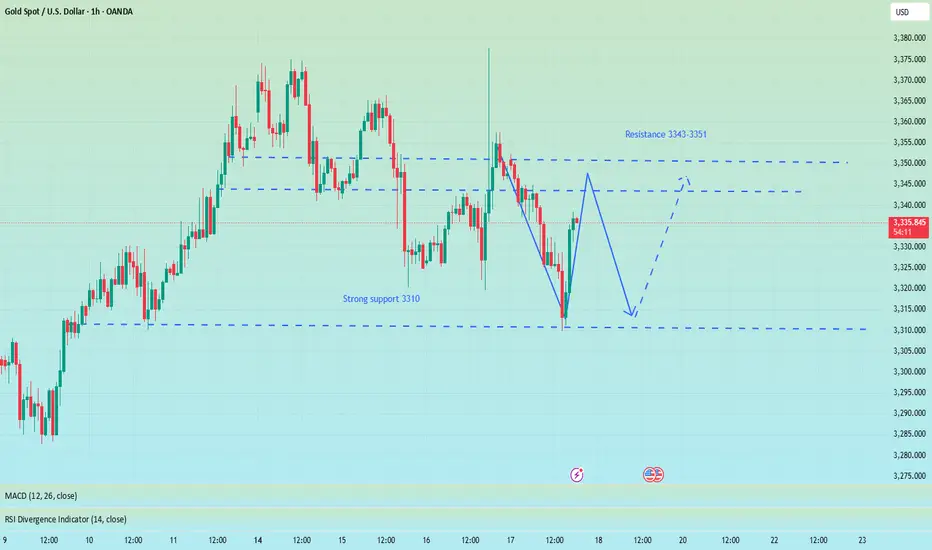
Bottom-out rebound, 3338 short orders enteredYesterday, the gold market was affected by Trump's remarks about firing Federal Reserve Chairman Powell. After briefly falling below 3320, the price quickly rose by nearly 60 points, reaching a high of 3377. Trump later clarified that the news was false, triggering a gold sell-off, and the market rose and fell. As of Thursday's European session, gold prices fell back to around 3320. After a rapid rise and fall in the US market on Wednesday, the downward trend continued on Thursday, with the US market hitting a low of 3310 before rebounding. Judging from the 4-hour chart, the Bollinger Bands failed to open downward, indicating that the current market lacks continuity and the overall market remains in a volatile pattern. In a volatile market, it is recommended to pay attention to key support and resistance levels for high-selling and low-buying operations. The upper resistance range is currently at 3343-3351, and the important watershed support level below is at 3310.
OANDA:XAUUSD
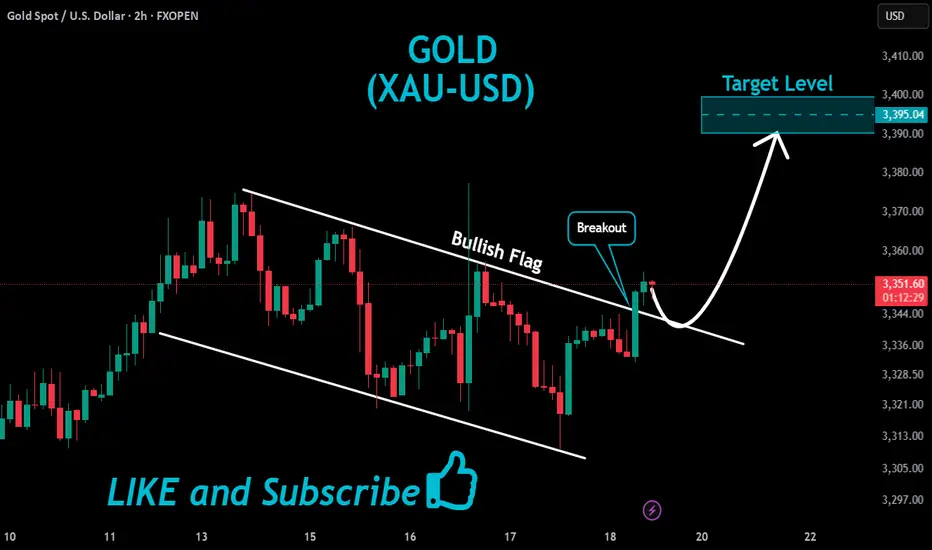
GOLD Bullish Flag Breakout!
HI,Traders !
GOLD is trading in an
Uptrend and
Now breaking out of the
Bullish flag pattern so we
Are bullish biased now
And we will be expecting a
Further move up !
Comment and subscribe to help us grow !
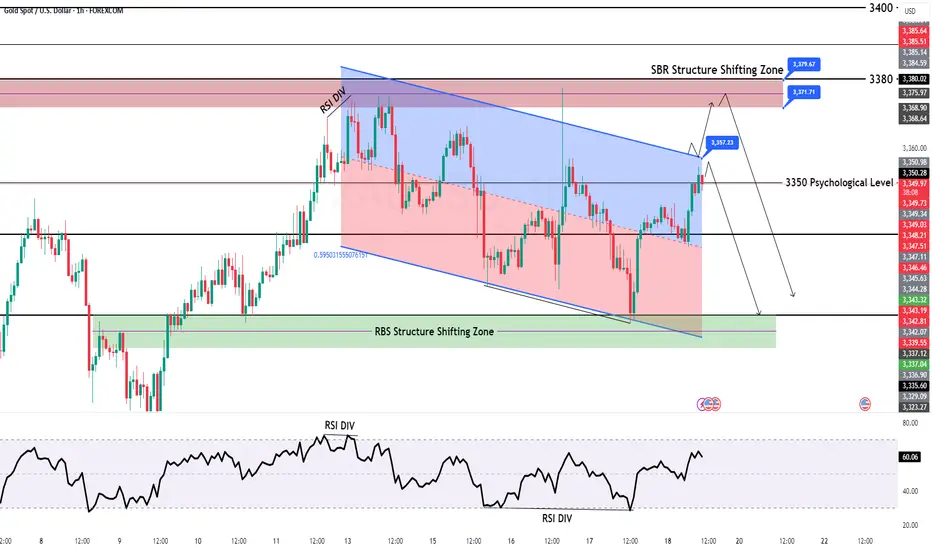
GOLD Intraday H1 Chart Update For 18 July 25Hello Trader, Today we have closing day
For now market is still in Bearish Channel range and try to sustains below 3350 Psychological Level
Further only market clear breakout of 3385 level then we will be on Bullish side other we are remains bearish for now
All eyes on Todays Closing
Disclaimer: Forex is Risky
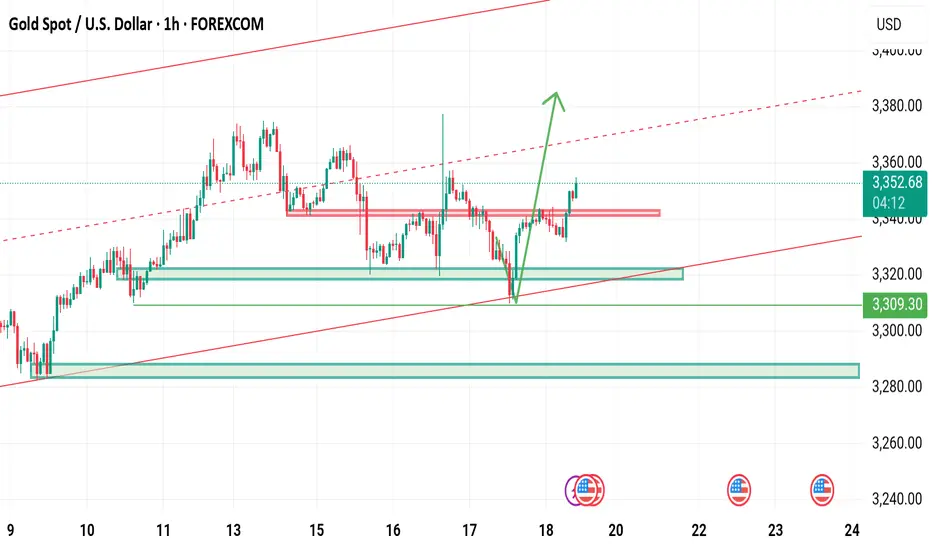
Excellent profits booked As I mentioned in yesterday’s commentry session:
My strategy is still the same – buying every dip in Gold around my key level yesterday at 3312, which the market respects well and as our first target was 3345
I'm aiming for a breakout to the upside.
Very happy with the profits so far.
My medium-term targets remain 3380 &3,400 and I’ll keep buying every local low until then.
Also I mentioned if 3310 turns flips on down side then buy at 3290 will be the perfect buy.
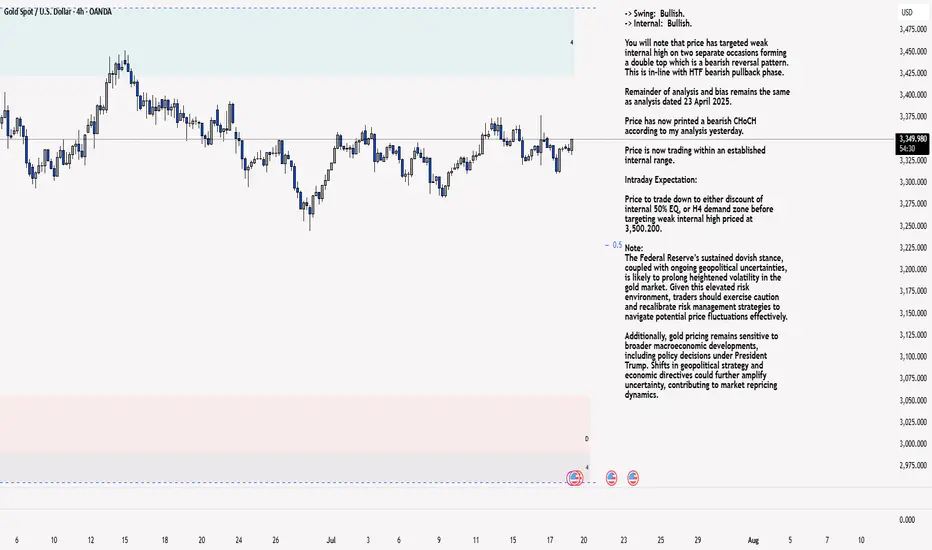
XAU/USD 18 July 2025 Intraday AnalysisH4 Analysis:
-> Swing: Bullish.
-> Internal: Bullish.
You will note that price has targeted weak internal high on two separate occasions forming a double top which is a bearish reversal pattern. This is in-line with HTF bearish pullback phase.
Remainder of analysis and bias remains the same as analysis dated 23 April 2025.
Price has now printed a bearish CHoCH according to my analysis yesterday.
Price is now trading within an established internal range.
Intraday Expectation:
Price to trade down to either discount of internal 50% EQ, or H4 demand zone before targeting weak internal high priced at 3,500.200.
Note:
The Federal Reserve’s sustained dovish stance, coupled with ongoing geopolitical uncertainties, is likely to prolong heightened volatility in the gold market. Given this elevated risk environment, traders should exercise caution and recalibrate risk management strategies to navigate potential price fluctuations effectively.
Additionally, gold pricing remains sensitive to broader macroeconomic developments, including policy decisions under President Trump. Shifts in geopolitical strategy and economic directives could further amplify uncertainty, contributing to market repricing dynamics.
H4 Chart:
M15 Analysis:
-> Swing: Bullish.
-> Internal: Bullish.
H4 Timeframe - Price has failed to target weak internal high, therefore, it would not be unrealistic if price printed a bearish iBOS.
The remainder of my analysis shall remain the same as analysis dated 13 June 2025, apart from target price.
As per my analysis dated 22 May 2025 whereby I mentioned price can be seen to be reacting at discount of 50% EQ on H4 timeframe, therefore, it is a viable alternative that price could potentially print a bullish iBOS on M15 timeframe despite internal structure being bearish.
Price has printed a bullish iBOS followed by a bearish CHoCH, which indicates, but does not confirm, bearish pullback phase initiation. I will however continue to monitor, with respect to depth of pullback.
Intraday Expectation:
Price to continue bearish, react at either M15 supply zone, or discount of 50% internal EQ before targeting weak internal high priced at 3,451.375.
Note:
Gold remains highly volatile amid the Federal Reserve's continued dovish stance, persistent and escalating geopolitical uncertainties. Traders should implement robust risk management strategies and remain vigilant, as price swings may become more pronounced in this elevated volatility environment.
Additionally, President Trump’s recent tariff announcements are expected to further amplify market turbulence, potentially triggering sharp price fluctuations and whipsaws.
M15 Chart:
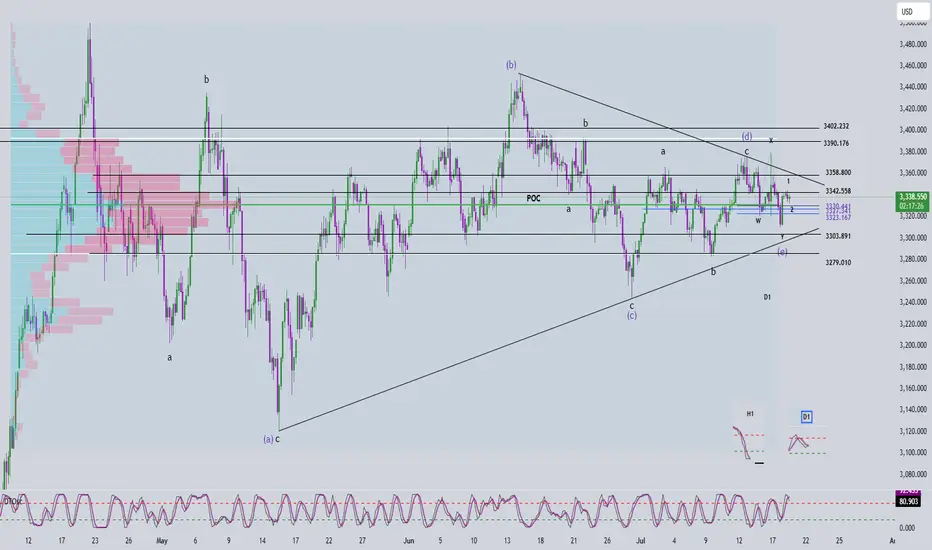
Elliott Wave Analysis – XAUUSD July 18, 2025📈 Elliott Wave Analysis – XAUUSD July 18, 2025
🔍 Momentum Analysis
D1 Timeframe: Momentum is showing signs of a bullish reversal. While we need to wait for today's D1 candle to close for confirmation, it's likely that yesterday’s upward move marks Wave 1, signaling the beginning of a new bullish trend.
H4 Timeframe: Momentum is preparing for a bearish reversal → suggesting a potential corrective pullback, likely forming Wave 2.
H1 Timeframe: Momentum is about to reverse upward → supporting the expectation of a short-term bullish move during the current session.
🌀 Elliott Wave Structure Update
On the H4 chart, the abcde triangle correction structure remains largely unchanged.
However, a strong H4 bullish candle appeared yesterday, indicating unusual market behavior that deserves attention.
There are two main scenarios:
- Wave 1 (black) has already completed, and the market is now entering Wave 2 correction.
- Alternatively, the current movement could be Wave 4 within Wave 1 (black).
🔎 Combining Momentum & Wave Structure
- With D1 momentum signaling a potential uptrend lasting the next 4–5 days, it suggests that Wave e (blue) may have completed.
- This opens the door for an impulsive 5-wave advance. Specifically:
+ If H1 continues its bullish reversal, the current move could be Wave 5 of Wave 1 (black), targeting the 3358 level.
+ Afterwards, a retracement toward the 3330–3323 zone would form Wave 2 (black).
+ Alternatively, price might drop directly to 3330–3323, implying Wave 1 has already finished and the current move is Wave 2.
🎯 => Both scenarios converge at the 3330–3323 price zone, making it a high-probability BUY ZONE.
🧭 Trade Plan
BUY ZONE: 3330 – 3327
Stop Loss: 3320
Take Profits:
TP1: 3342
TP2: 3358
TP3: 3402
📌 Note: Since this is a relatively wide entry zone, it's best to wait for price action confirmation at this level before entering.
Gold (XAU/USD) Premium Technical Outlook - 18 July 2024As gold continues to trade near record highs, the market’s current price action around $3,336–3,340 demands a sharp, disciplined technical view. This premium analysis combines price action, Fibonacci techniques, institutional concepts (ICT and Smart Money Concepts), and advanced supply–demand dynamics to identify actionable trade opportunities.
We anchor on the 4-hour timeframe for directional bias and zoom into the 1-hour chart for precision intraday setups.
📊 4‑Hour Timeframe: Structure and Directional Bias
Gold remains in a clear bullish structure on the 4-hour chart, as evidenced by sustained higher highs and higher lows. The most recent bullish Break of Structure (BOS) occurred above the $3,320–3,325 level, confirming buyers’ control for now.
Currently, price hovers near equilibrium at the 61.8% Fibonacci retracement, testing prior resistance as potential support. This zone aligns with a small fair value gap (FVG), reinforcing it as an area of interest for smart money participants.
Key 4H Levels to Watch
Level Significance
$3,360–3,365 Major supply zone & bearish OB
$3,350–3,355 Minor resistance
$3,337–3,340 61.8% Fib / equilibrium
$3,330–3,333 BOS retest & key support
$3,300–3,310 Strong demand zone & bullish OB
$3,285–3,295 Secondary demand zone below BOS
The directional bias on 4H remains neutral-to-bullish, contingent on price holding above $3,300. A clean break and close above $3,360 could open a path to $3,400–3,420, while a sustained drop below $3,300 would mark a change of character (CHOCH) and shift bias to bearish.
🪙 Institutional Concepts in Play
Order Blocks (OB): Strong bullish OB sits at $3,300–3,310, while a bearish OB dominates at $3,355–3,365.
Fair Value Gaps (FVG): On the bullish side, $3,300–3,315 remains unfilled; on the bearish side, $3,330–3,345 caps rallies.
Liquidity Grabs: Dips toward $3,295–3,300 appear to sweep sell-side liquidity, while spikes above $3,360 tap into resting buy stops.
The area around $3,330 remains a key battleground where smart money likely accumulates positions before the next impulsive move.
⏳ 1‑Hour Timeframe: Intraday Trade Setups
On the 1-hour chart, the market is compressing between a bullish order block and bearish supply. Price action shows evidence of short-term liquidity sweeps and reactions to imbalances, offering two clear scenarios for intraday traders.
📈 Setup A – Bullish Zone Bounce
Entry: Buy limit at $3,332–3,333
Stop-loss: Below $3,328
Take-Profit 1: $3,345
Take-Profit 2: $3,355
Rationale: Confluence of 4H demand, Fib retracement, BOS retest, and 1H bullish order block.
📉 Setup B – Supply Rejection Short
Entry: Sell limit at $3,355–3,360
Stop-loss: Above $3,365
Take-Profit 1: $3,337
Take-Profit 2: $3,330
Rationale: Price into 4H bearish OB, aligning with supply and stop runs above recent highs.
🌟 The Golden Setup
Among these, the Bullish Zone Bounce at $3,332–3,333 stands out as the highest-probability trade. This level represents maximum confluence:
Retest of 4H BOS.
Bullish OB on 1H.
61.8% Fibonacci support.
Unmitigated fair value gap.
This setup offers a favorable risk–reward profile with clear invalidation and multiple upside targets.
🔎 Summary Table
Bias Key Support Zones Key Resistance Zones
Neutral-to-bullish $3,300–3,310, $3,330–3,333 $3,350–3,355, $3,360–3,365
Intraday Setups Entry Zone Stop-Loss Take-Profit Targets
Bullish Zone Bounce 🌟 $3,332–3,333 < $3,328 $3,345 / $3,355
Supply Rejection Short $3,355–3,360 > $3,365 $3,337 / $3,330
📣 Final Word
Gold maintains a structurally bullish outlook above $3,300, with strong institutional footprints evident in the $3,300–3,333 demand zones. Traders should remain vigilant around $3,360, where sell-side liquidity and supply are concentrated.
The Golden Setup — a bullish bounce from $3,332 — offers the best confluence and statistical edge intraday.

USDCAD is showing signs of bullish recovery✏️ OANDA:USDCAD has broken the Trendline structure to form a corrective uptrend. The price is still above the 20 SMA, indicating that the market's bullish momentum is still strong. The bullish wave may extend to 1.385. Pay attention to the reaction at the 1.375 liquidity candle wick zone for a positive DCA strategy.
📉 Key Levels
Support: 1.365
Resistance: 1.375-1.385
BUY Now: 1.365 (Strong support zone)
BUY Trigger: break and close above 1.375
Target: 1.385
Leave your comments on the idea. I am happy to read your views.

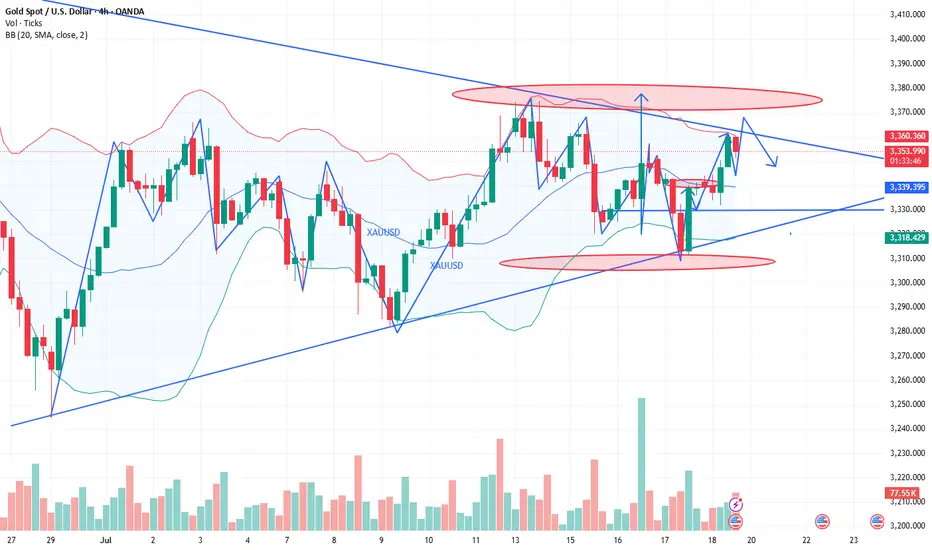
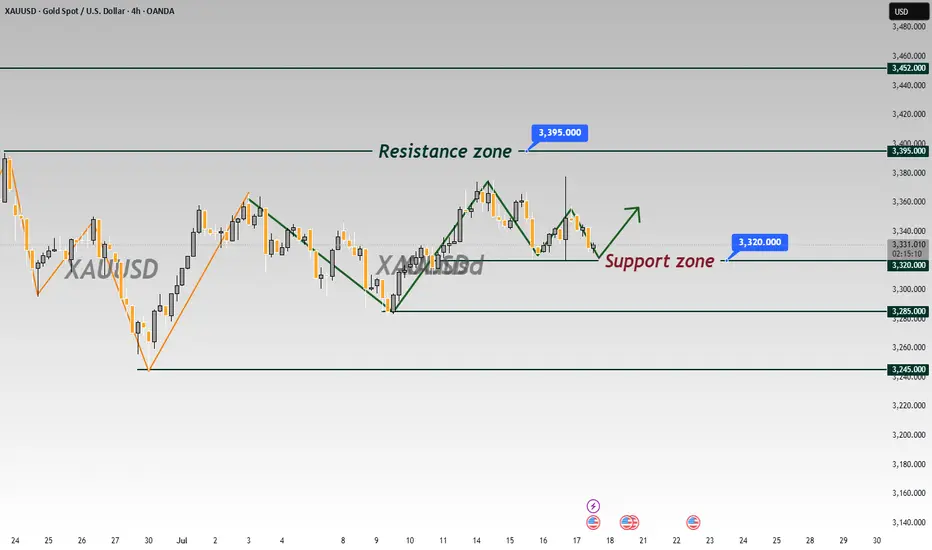
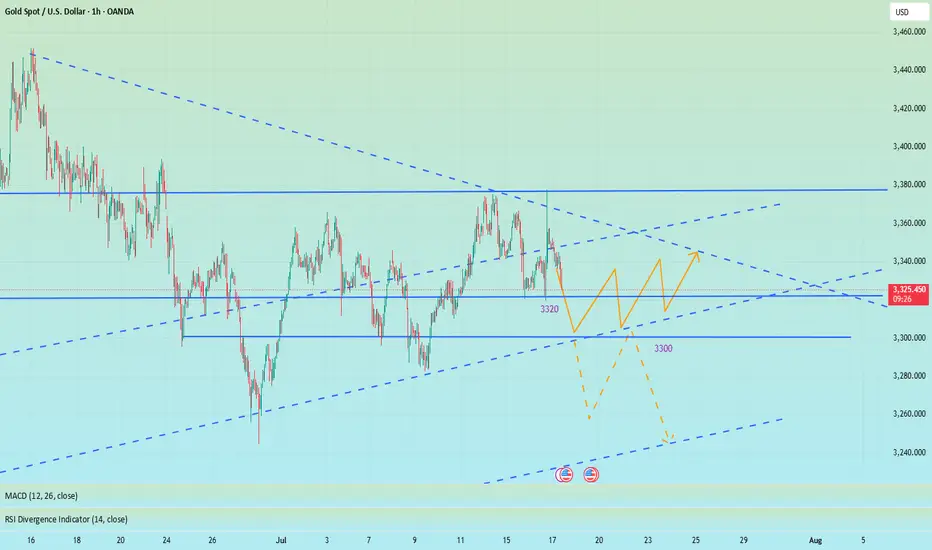
Gold returns to Sideway range waiting for new momentumOANDA:XAUUSD A sweep of liquidity back to the 3377 zone and then back into the triangle trading range. Currently, the market will wait for new momentum for the next trend. If the 3322 zone is still holding, the uptrend to 3400 is still there. This is an important price zone in today's trading day.
📉 Key Levels
BUY Trigger: rejection 3323 with bullrish confirmation
Target: 3373
SELL Trigger: Break and trading Bellow support 3321
Target: 3285
Leave your comments on the idea. I am happy to read your views.
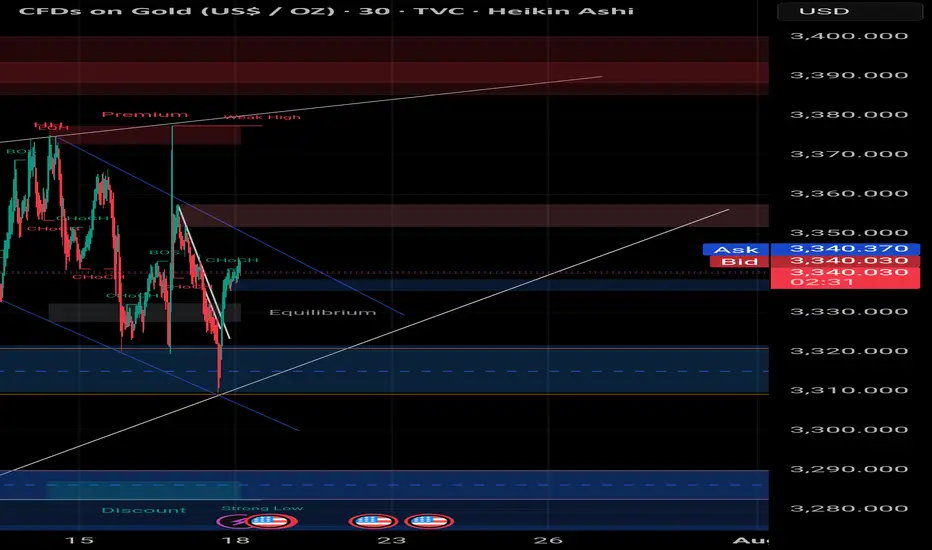
Smart Money Sell Setup on Gold (15-Min TF)# Smart Money Sell Setup on Gold (15-Min TF)
### 🔍 Market Context:
Gold has recently formed a strong bullish retracement after a sharp impulsive bearish move. Now, price has returned to a critical zone — the **Equilibrium level (EQ)** — which also aligns with a **valid supply zone** and **bearish trendline resistance**.
This zone is often considered the "decision point" where Smart Money evaluates whether to continue upward or resume the previous bearish trend.
---
## 📉 Strategy: Sell Limit Based on Structure + Liquidity
### ✅ Entry Zone:
**3341.500 – 3343.000**
(At the EQ zone + premium pricing area)
### 🛑 Stop Loss:
**Above 3345.000**
(Just beyond the last liquidity wick and top of supply)
### 🎯 Take Profit Targets:
- **TP1:** 3338.000 → First demand zone
- **TP2:** 3332.500 → Liquidity sweep target under previous lows
### 📐 Risk to Reward Ratio:
**1:3 or higher**, depending on execution precision.
---
## 🔎 Confluences Supporting the Setup:
| Factor | Confirmation |
|--------|--------------|
| EQ Zone (50% of previous move) | ✅ |
| Supply Zone | ✅ |
| Bearish Trendline Resistance | ✅ |
| Liquidity above EQ | ✅ |
| CHoCH + BOS (Market Structure Shift) | ✅ |
---
## 🧠 Why This Setup Works:
This is a classic **"Premium Price Rejection"** in a bearish environment, combining:
- Institutional logic (EQ level)
- Structural resistance (previous BOS)
- Liquidity traps above
---
## 🧵 Summary:
- **Sell Limit:** 3341.5 – 3343
- **SL:** 3345
- **TP1:** 3338
- **TP2:** 3332.5
- **RR:** 1:3+
- **Style:** Smart Money / Liquidity + Structure Based
---
🔔 **Disclaimer:** This is not financial advice. Always do your own analysis and manage risk accordingly.
#gold #XAUUSD #smartmoney #tradingview #liquidity #supplydemand #priceaction #forex #structure
Gold Analysis – Why I’m Targeting $4,085Friday July 18 2025. Malaysia, Kuala Lumpur - Gold analysis done by Zezu Zaza to see the potential upcoming upside starting today this Friday.
I am using a CCT (Chrono Conditioned Trading) technique for my trading based analysis with mathematical strategy in the Xauusd pricing. We will cover the technical, fundamental and sentiment aspect as these are the three components pillars in trading before making any decision and movement trend.
1. Technical Setup (Daily Chart)
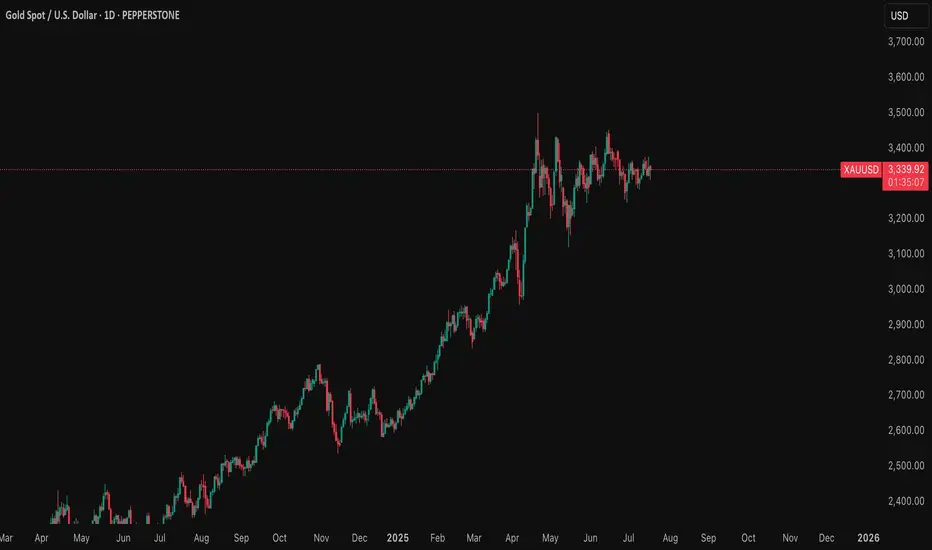
Gold is currently consolidating between the $3,300 to $3,375 range after a strong rally earlier this year.
The RSI sits near the neutral 50 level, while the MACD shows signs of a potential bullish crossover.
A confirmed breakout above the $3,375 to $3,400 resistance zone may lead to a surge toward $3,600 to $3,650, and possibly much higher.
Market structure remains bullish, with higher lows forming a solid base around $3,300.
2. Federal Reserve Outlook – 2025 Rate Cuts Expected
The market is now pricing in at least two interest rate cuts from the Federal Reserve by the end of 2025. A 25 basis point cut is expected in September, with another potentially coming in December. Recent CPI and PPI data indicate cooling inflation, giving the Fed more room to ease without reigniting price pressure. Labor market strength is weakening, wage growth is decelerating, and tighter credit conditions are emerging. Fed Chair Jerome Powell recently stated that the risks of over-tightening are now balanced, signaling a shift to a more dovish stance. Lower interest rates reduce bond yields and weaken the dollar, which historically fuels gold’s bullish momentum. If trump fired or Powell decision to step down, this will fire the gold even higher for the catalyze.
3. Market Sentiment (Speculative Positioning)
As of July 11, 2025, the latest CFTC Commitment of Traders report shows speculative net long positions on gold have surged to 203,000 contracts, the highest level in several months.
This signals a strong bullish sentiment among hedge funds and large traders.
In addition, gold ETFs saw over $38 billion in inflows in the first half of 2025, highlighting strong institutional demand as investors seek safety in uncertain times.
The positioning supports further upside as traders bet on a softer dollar and increased market volatility.
4. Macro Fundamentals and Hedge Fund Sentiment
Central banks around the world, especially in the BRICS nations, continue to increase their gold reserves in efforts to reduce reliance on the US dollar.
China has been actively accumulating gold for more than eight consecutive months, with unofficial estimates suggesting holdings of up to 5,000 metric tons.
Several hedge funds and institutional managers now classify gold as a core asset class due to rising fiscal uncertainty, geopolitical risk, and the deterioration of confidence in monetary policy. David Einhorn of Greenlight Capital emphasized that gold is not just about inflation but about the credibility of monetary and fiscal policies. His fund maintains a long gold position and expects higher prices as global deficits and structural imbalances persist.
5. Institutional Forecasts and Speculator Targets
Goldman Sachs has raised its end-of-2025 target to the $3,700 to $3,950 range, citing rising ETF inflows and a softer Fed stance. JPMorgan expects gold to average around $3,675 in the fourth quarter of 2025. Citi, in a bull case scenario, believes gold could trade well above $3,300. The World Gold Council has outlined a high-conviction scenario in which gold could reach $4,000 within the next six to nine months, driven by stagflation and global monetary instability. Greenlight Capital is reportedly aiming for the $3,500 to $3,800 range, though David Einhorn noted that he does not want prices to rise excessively too quickly.
Target Price: $4,085 first before turn the bullish sooners to $5000 price make this same year.
My target of $4,085 is supported by the convergence of multiple factors:
- A bullish technical structure with a potential breakout
- Fed interest rate cuts reducing yields and weakening the dollar. Fed will reduce the rates for the first time this year (12 more days) after this article is published today 18 July 2025.
- Strong speculative positioning and ETF demand
- Aggressive central bank accumulation
- Hedge fund sentiment aligned with rising gold exposure
- Persistent geopolitical and macroeconomic uncertainty
If these conditions hold, $4,085 is a realistic medium-term objective within six to nine months.
Trading Plan Summary
Component Strategy
Entry Zone Breakout above $3,375
Stop Loss $3,300 to $3,320 (below key support)
Take Profit Partial at $3,600 to $3,650, trail remainder to $4,085
Risk Triggers Dollar strength, unexpected Fed hawkish turn, resolution in geopolitics
Key Catalysts CPI done, PPI done, FOMC statements, nonfarm payrolls, war developments
Final Takeaway
This gold analysis blends a bullish technical pattern with the macroeconomic backdrop of an approaching Fed pivot, rising speculative positioning, and ongoing central bank purchases.
Hedge funds and institutions are increasingly viewing gold as an essential defensive asset, especially in the face of deteriorating fiscal credibility and geopolitical tensions.
If gold breaks and holds above the $3,375 level, the path toward $4,085 becomes significantly more probable.
18 July 2025 Friday is a starter ignition trend will born today. I will place some test lots today and will accumulate after from time to time.
Let me know if you what is your opinion or send email to me to reach me for the insitutional analyst or want to see live trade.
Regards,
Zezu Zaza
2048
Wait for the data release; do not chase short positions.The 4-hour timeframe remains in a range-bound consolidation. Only a decisive break below the 3320 level will truly open up substantial downward space. Let’s focus on today’s US Initial Jobless Claims data: while the indicator has been trending lower recently, the current market expectation is tilted toward a rebound.
Even though yesterday’s PPI data, after its release, was bullish for gold, its actual impact on prices was limited—far from comparable to core metrics like CPI.
In summary, all short positions have now closed out with profits. Waiting for the data release to trade in line with the trend is a more prudent approach: if prices hover around 3320 or 3310 ahead of the data and the figures come in bullish, you can decisively enter long positions once there’s a slight pullback. If the data turns bearish, avoid chasing the decline; instead, consider positioning around key integer levels such as 3290-3300, as a sharp bullish correction is likely to follow an oversold move. As for whether the bulls can achieve a full reversal, we’ll assess the broader picture then. Always remember: no market moves in one direction indefinitely—adaptability is key
🚀 Buy @3310 - 3320
🚀 TP 3330 - 3340 - 3350
Accurate signals are updated every day 📈 If you encounter any problems during trading, these signals can serve as your reliable guide 🧭 Feel free to refer to them! I sincerely hope they'll be of great help to you 🌟 👇
XAUUSD:Go long
Based on the 4-hour analysis, the short-term support below for today remains focused on the area around 3318-25, while the short-term resistance above focuses on the 3340-45 level. The key resistance above is at 3380. Overall, this range remains the main framework for our participation in the trade, with positions generally being cautious and waiting for key levels to enter. I will provide specific trading strategies during the session, so please stay tuned. Given that the current market has retraced to 3325 and then rebounded, we can go long in the 3325-30 range.
Trading Strategy:
BUY@3325-30
TP:3340-45
More detailed strategies and trading will be notified here ↗↗↗
Keep updated, come to "get" ↗↗↗

Treat it as a long-short wash-out shock, and go long on pullback📰 News information:
1. Initial jobless claims data
2. June retail data
3. Beware of Trump's remarks about firing Powell
📈 Technical Analysis:
Last night, the daily line closed at around 3347. The current short-term daily line range is 3355-3300. The short-term support below is still 3320. Once it falls below 3320, it will look to 3310-3300. Short-term trading is still volatile. If the intraday retracement reaches 3320-3310, consider going long, and the defense is 3300, with the target at 3340-3350. Under the current rhythm of long and short wash, don't chase the rise and sell the fall, look at it rationally, and brothers who trade independently must bring SL.
🎯 Trading Points:
BUY 3320-3310
TP 3340-3350
In addition to investment, life also includes poetry, distant places, and Allen. Facing the market is actually facing yourself, correcting your shortcomings, facing your mistakes, and exercising strict self-discipline. I share free trading strategies and analysis ideas every day for reference by brothers. I hope my analysis can help you.
FXOPEN:XAUUSD OANDA:XAUUSD FX:XAUUSD FOREXCOM:XAUUSD PEPPERSTONE:XAUUSD TVC:GOLD
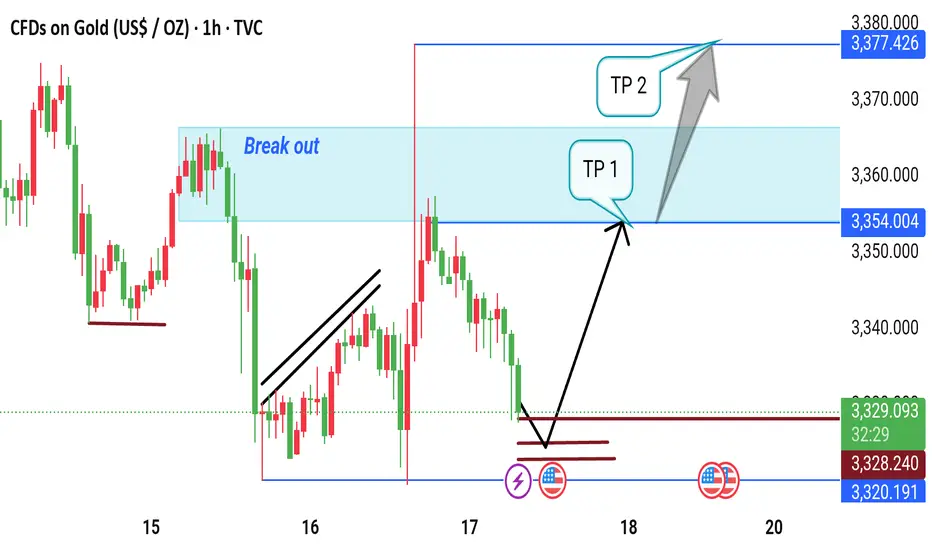
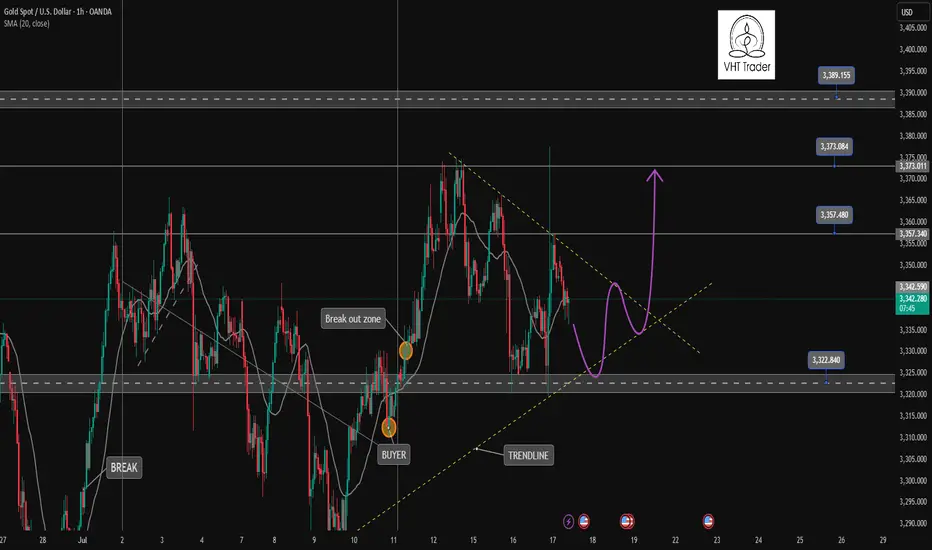
Gold Price Reversal Setup: Breakout Retest with Bullish Targets.This 1-hour gold (XAU/USD) chart shows a potential bullish setup. Price is currently near support at 3,320.191, with possible reversal signals forming. The chart highlights a previous breakout zone around 3,354.004. If price rebounds, targets are set at TP1 (3,354.004) and TP2 (3,377.426). Key events and technical signals suggest a potential move upward.