Elliott Wave Analysis – XAUUSD H1 30/05/2025
🔍 Wave Structure Update
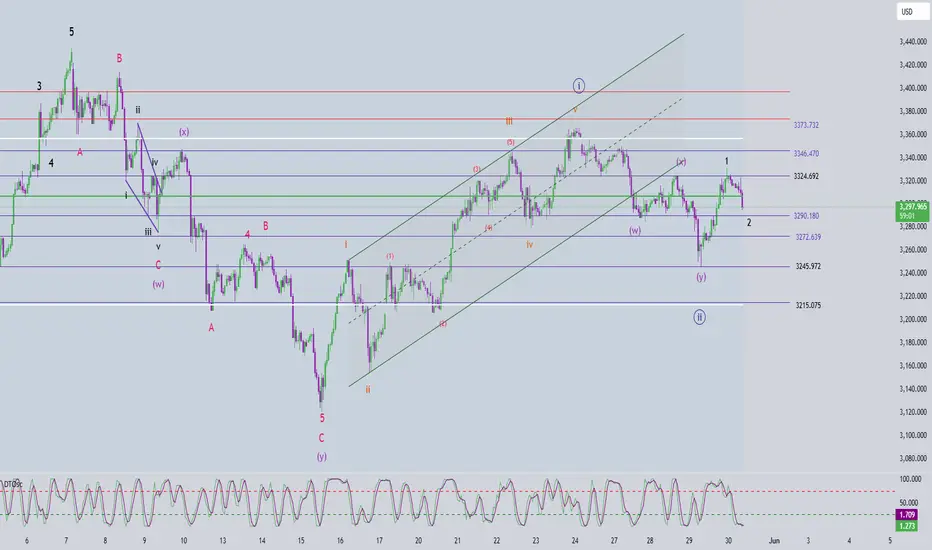
As of now, price has broken above the X wave high and is undergoing a retracement. This is a positive signal, suggesting that Wave 1 (black) of the larger green impulsive wave may have completed. Currently, price is likely in Wave 2 (black) – offering a good opportunity to position for the upcoming Wave iii (green).
Within Wave 2, we expect classic corrective structures such as zigzag or flat to form. Based on current price action, a short-term bounce followed by another leg down is anticipated to complete the corrective phase.
🎯 Potential Wave 2 Target Zones
• Target 1: 3290
• Target 2: 3272
❗ If price drops further to 3245, the assumption that Wave 2 has ended may be invalid. In that case, the broader correction could continue toward 3215 (Wave Y target).
📈 Momentum Outlook
D1 Chart: Momentum shows signs of reversal to the upside – supporting a bullish bias for the coming week.
H4 Chart: Momentum is weakening, suggesting price may move sideways or pull back today as part of Wave 2 development.
H1 Chart: Currently oversold, indicating a likely short-term bounce or sideways movement to maintain this oversold condition until H4 also reaches oversold.
🧭 Trading Plan
🔹 Scalp Buy
• Entry: 3291 – 3289
• SL: 3286
• TP1: 3306
• TP2: 3324
• TP3: 3346
🔹 Main Buy Zone
• Entry: 3272 – 3269
• SL: 3262
• TP1: 3290
• TP2: 3324
• TP3: 3373
Xauusdwave
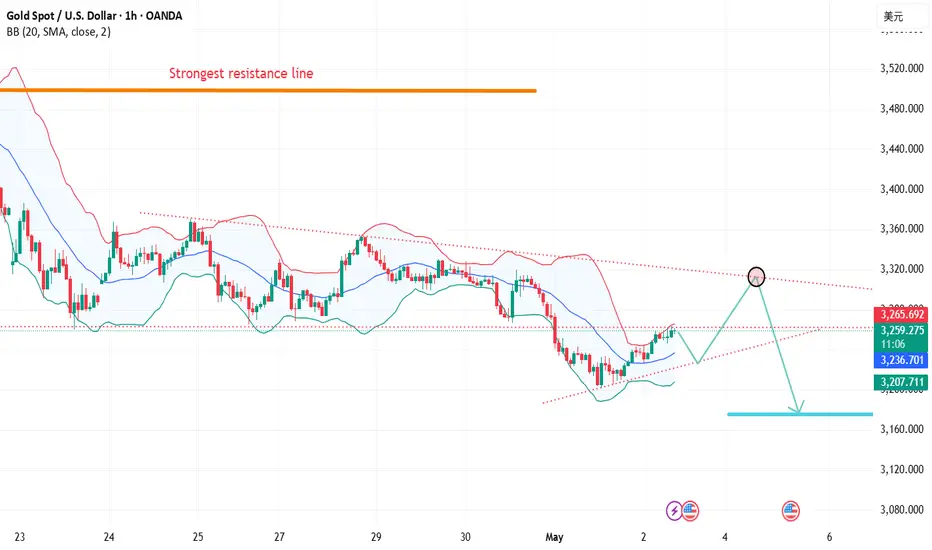
Gold is still washing out, beware of a fall below 3326!
📊Comment Analysis
After gold fell in the Asian session, the entire European session rebounded continuously, and the US session hit the 3318 line. Overall, it is still a wide range of shocks and washes out. No matter whether it rises or falls, it is not continuous, and the fluctuation range is large, which is difficult to grasp in short-term operations.
The current rise cannot be regarded as a strong trend. The characteristic of the shock market is repetition. The 4H cycle opens at 3326 as a watershed. Beware of a fall below this position in the US session. You can try to go short near 3320/3325. At present, it is a key position to bet on the short position. If it goes up, it will be 3340/3350. The rise in a short period of time is too large, and once it falls back, the strength will be the same.
⭐️ Note: Labaron hopes that traders can properly manage their funds
- Choose a lot that matches your funds
- Profit is 4-7% of the fund account
- Stop loss is 1-3% of the fund account

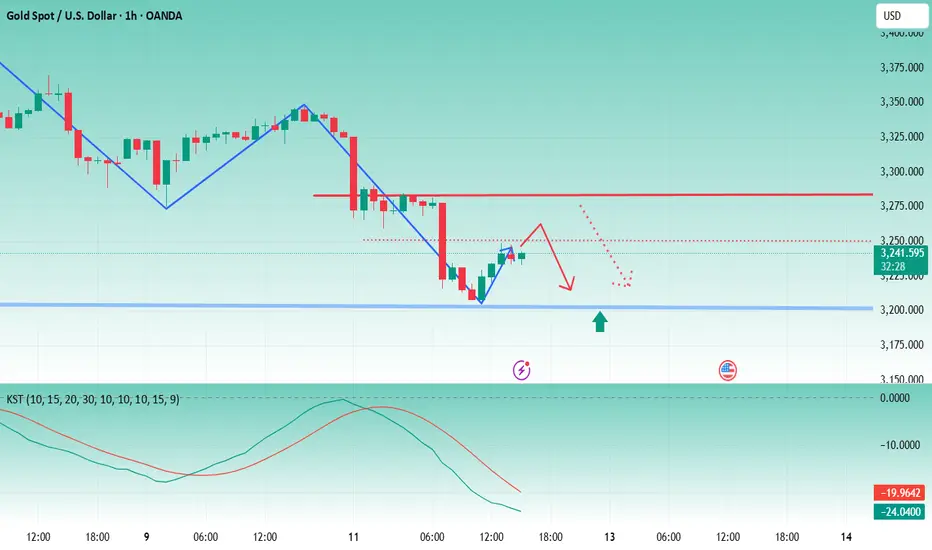
Elliott Wave Analysis – XAUUSD H1 Timeframe 29/05/2025
🔍 Current Wave Structure
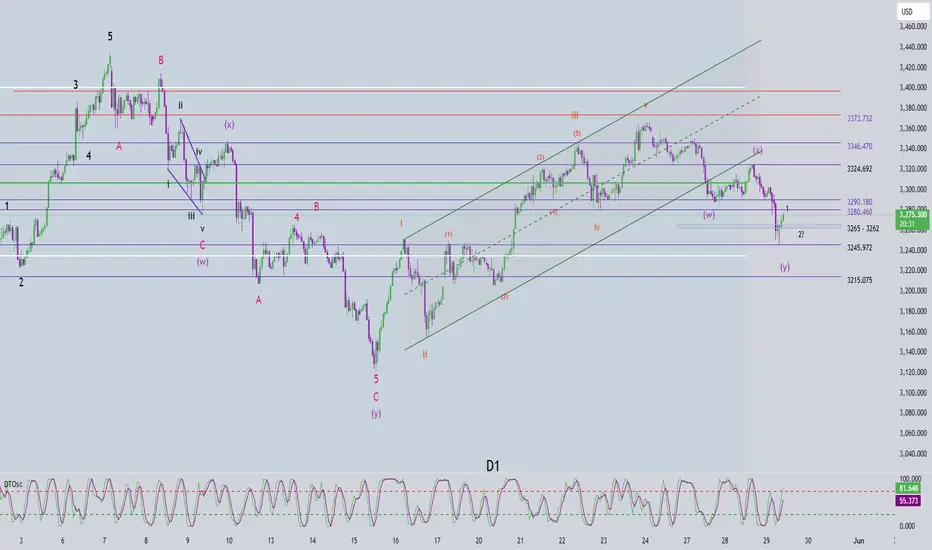
Price is currently correcting within a WXY structure, also known as a double zigzag. At the moment, the market is progressing through wave Y, with two potential targets:
🎯 Target 1: 3245 – already reached, and price has bounced sharply from this zone.
🎯 Target 2: 3215 – a deeper target, requiring further confirmation from price action and real-time momentum.
📈 If wave Y has already ended at 3245, the market may now be in wave 1 of a new bullish cycle. Once wave 1 completes, we’ll look for wave 2, which typically offers a prime entry point for wave 3.
👉 Wave 2 often forms as a zigzag or flat correction. Using Fibonacci confluence and liquidity zones, the potential wave 2 pullback area is 3265 – 3262.
⚡️ Momentum Outlook
🕯 D1: Momentum is entering oversold territory → high probability of bullish reversal today or tomorrow.
🕯 H4: Reversal setup is forming; current H4 candle closes in just over an hour → watch for confirmation.
🕯 H1: Momentum is rising. Wait for a pullback in H1, followed by renewed bullish momentum without breaking below 3245 — that’s likely the end of wave 2 and the entry point for wave 3.
📌 Important Note:
If H4 momentum reverses downward and price fails to break above 3324, it could signal a continuation of the broader downtrend, with 3215 remaining as the next wave Y target.
🛒 Trade Setup
BUY ZONE: 3265 – 3262
Stop Loss: 3255
Take Profits:
• TP1: 3290
• TP2: 3324
• TP3: 3346
❗️ If price breaks below 3245, it would confirm that wave Y is still in progress. In that case, monitor the 3215 zone for a new buying opportunity.
Gold starts a new trend? What is the reason?Gold prices rebounded, and the phenomenon of "buying on dips" appeared after hitting the low of the week earlier. In addition, the US Trade Court ruled that President Donald Trump's tariffs on major trading partners exceeded his authority, which attracted market attention. Investors' focus has gradually shifted to the US core inflation data to be released this week.
So far, the price of gold has risen by 0.91%, and the price has fluctuated around 3315. It hit the lowest point since May 20 during the European and Asian sessions.
The cyclical market presents a three-wave pattern. The first two periods showed a trend of rising first, then falling, and then rising again. It is currently entering the third period. The current rally has basically ended and will usher in a small decline.
I believe that the current rise in gold is partly due to technical covering, while economic uncertainty continues to support gold prices amid ongoing US debt problems and global trade tensions.
In addition, there are reports that the United States has ordered a large number of companies not to export goods to China without permission, and revoked the export licenses that some suppliers have obtained.
The current market is focusing on the US GDP data to be released later and the core personal consumption expenditure price index to be released on Friday. These two data will become an important basis for judging the future interest rate path of the Federal Reserve.
I will also pay attention to the release of news in a timely manner so as to update you in time on the impact of news on gold prices. Please be patient, traders.
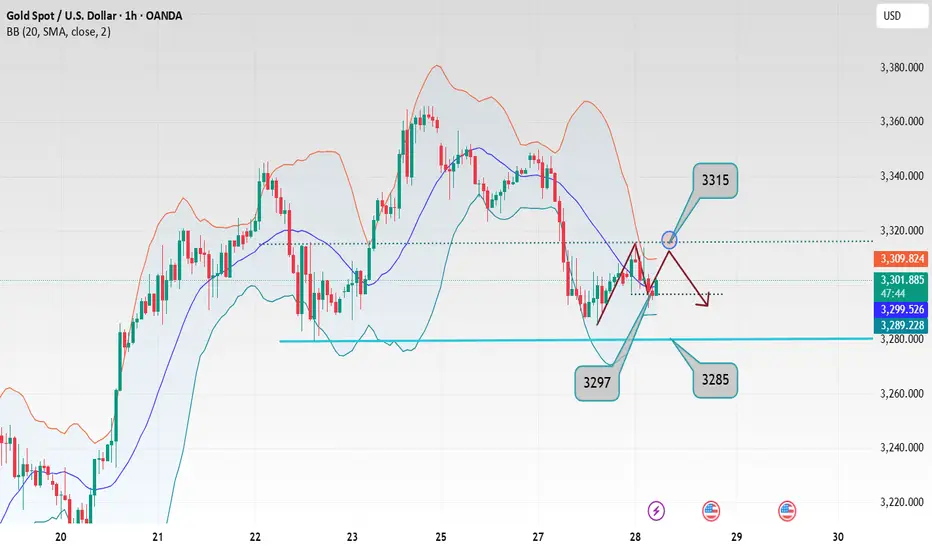
Gold fluctuates repeatedly, and the opportunity has come
Gold hit 3325 in the European session, and fell under pressure in the US session. It can be seen that the market still has no continuity, and the recent volatility is narrowing compared to the previous period. The whole month of May was a wide range of roller coaster fluctuations.
The oscillating market is to operate at the point of card. Wait for a one-sided trend and then follow the trend. Short-term US market rebounds to 3315 to short, and use the intraday high as defense. The 1H cycle support below 3280/3290 is long in batches, and other positions are not involved.
Elliott Wave Analysis – XAUUSD Trading Plan | May 28, 2025
🔍 Current Wave Structure
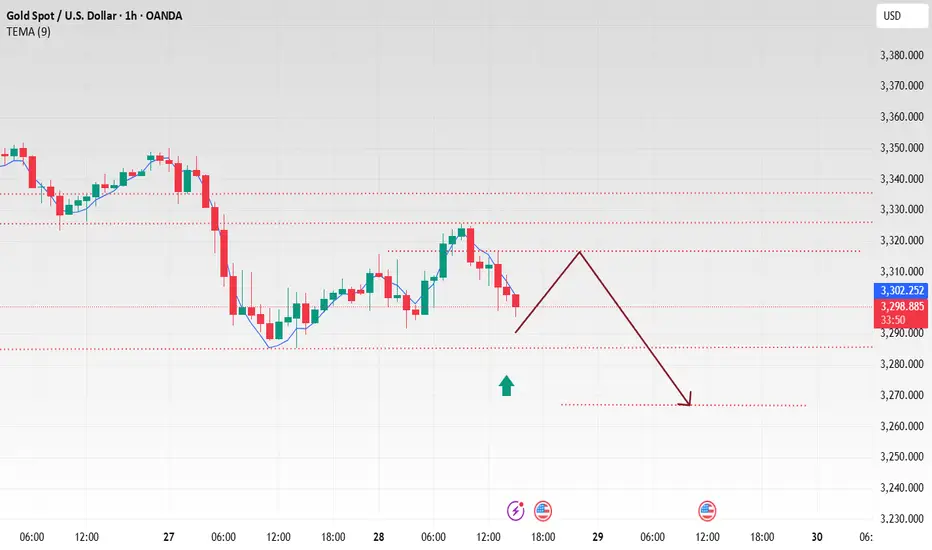
Following yesterday’s sharp decline, price has made a mild recovery and is currently consolidating around the 3314 area. The drop has nearly reached the projected wave C (green) target, but the current rebound — with overlapping small H1 candles — suggests the bullish structure is still unconvincing.
We’re now monitoring two potential scenarios:
✅ Scenario 1 – Correction Completed
Wave C appears to be complete, and the market may be entering a new bullish trend.
However, the overlapping candles on H1 hint that this could be a leading diagonal (wave 1).
In this case, a deeper pullback (wave 2) is expected — likely forming a zigzag or flat correction.
📌 Strategy:
Wait for wave 2 to complete before looking for a better Buy entry.
🌀 Scenario 2 – Ongoing Correction
If price continues to move sideways, we may be in wave b of a double zigzag correction (wave Y).
🎯 Wave c target within wave Y: 3324
If price breaks below 3284 before reaching 3324, wave c may have already started and could complete around 3280–3274.
📈 Momentum Outlook
• Daily (D1): Momentum remains bearish → primary trend still leans downward
• H4: Bullish momentum → short-term recovery possible today
• H1: Near oversold → watch for bullish reversal signals in current zone for intraday Buy setups
🎯 Trade Plan
⏰ Intraday Buy (Scalp):
• Entry: 3292 – 3289
• SL: 3282
• TP1: 3313
• TP2: 3324
🕰️ Ideal timing: During the London session to end of New York session
🎯 Swing Buy Setup:
• Entry: 3280 – 3277
• SL: 3270
• TP1: 3290
• TP2: 3313
• TP3: 3324
🕰️ Ideal timing: European to late US session
🎯 Sell Zone: 3324 – 3327
• SL: 3334
• TP1: 3313
• TP2: 3290
• TP3: 3280
🕰️ Best considered if price reaches resistance during US session or late EU session
📌 All scenarios will be updated once wave 2 is confirmed or price decisively breaks below 3284.
Be patient — let the market give you clear signals before taking action.

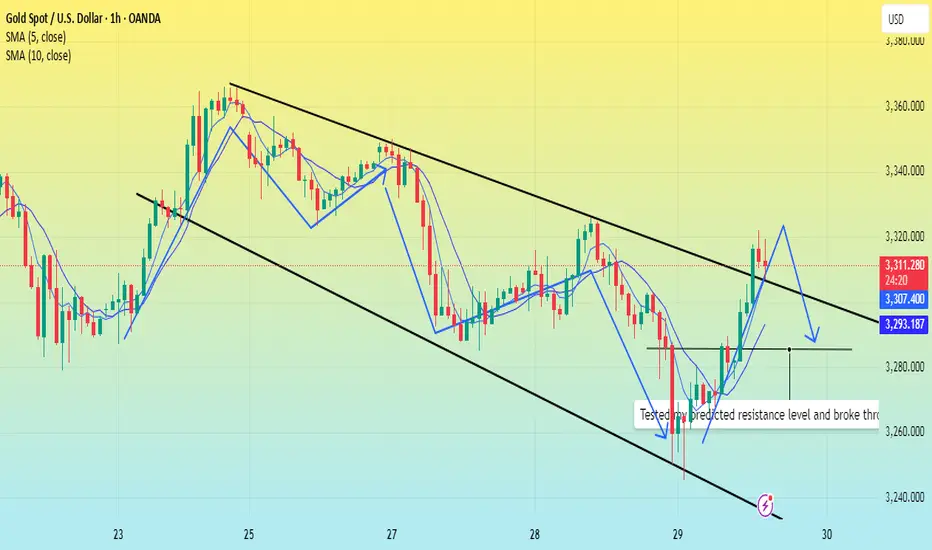
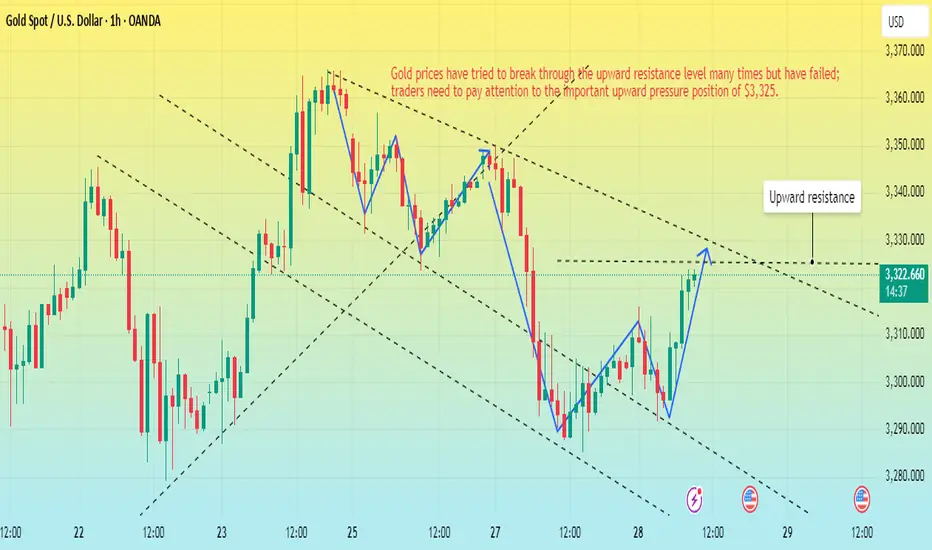
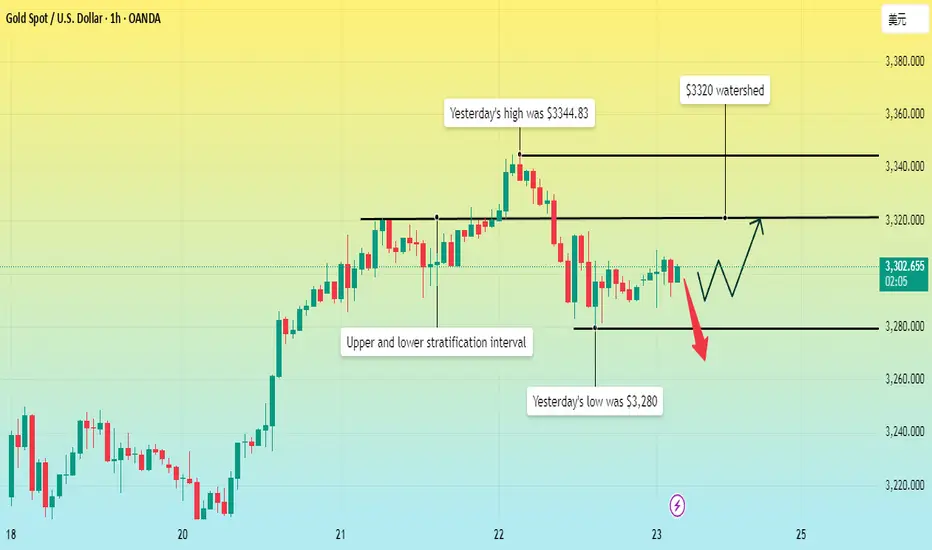
Gold is waiting for a breakthrough? A new trend?In the Asian market, gold has repeatedly tested the downward trend near $3,300. As of now, it has stabilized above $3,300 again. The current highest rebound is around $3,323. The price is under pressure at this position and keeps testing to break through this position.
From the hourly chart, the previous trend of falling from $3,365 was a decline and then rebound. The current trend from $3,350 is the same. The current market is around $3,325, which is the position we need to pay attention to.
If gold breaks through and stabilizes at $3,325 next, it will test the intraday high of $3,335.
Therefore, I suggest that you can maintain the 3,325-3,335 US dollars to enter the market for short selling. You can use yesterday's high of $3,350 as a defense. The target is the support of $3,300 below today.
Gold 3315 gains and losses are the key
📌 Driving events
From the news perspective, data released by the U.S. Department of Commerce on Tuesday showed that U.S. durable goods orders in April plunged 6.3% month-on-month, with an expected value of -7.8% and a previous value revised from 9.20% to 7.50%. Volatile commercial aircraft orders plunged 51.5% in April after rising in March. Boeing said it received only eight aircraft orders in April, the lowest since May 2024, far lower than the 192 orders in March, the highest since 2023. Affected by the sharp drop in commercial aircraft orders, U.S. durable goods orders fell more than expected in April, with core capital goods orders (excluding aircraft and military hardware) falling 1.3%, the biggest drop since October last year. Under the influence of uncertainty in tariffs and tax policies, corporate investment willingness is weakening.
Through the data, it is not difficult to find that American companies have shown obvious caution in assessing the demand outlook and have shifted their focus to cost reduction, which directly reflects the impact of uncertainty brought about by Trump's trade policy. At the same time, the tax legislation being debated in Congress has also put companies on the sidelines, further suppressing the impulse to invest.
📊Comment Analysis
After the pullback on Monday this week, the decline accelerated on Tuesday, and the continuous decline came back, changing the strong upward trend of last week
💰Strategy Package
In terms of operation, in the short term, long and short operations can be carried out in the range of 3315-3297 US dollars, and the support position of 3285/80 should be paid attention to below; medium and long-term investors can buy on dips and take advantage of geopolitical risks and the trend of weak US dollars to gradually establish long positions.
⭐️ Note: Labaron hopes that traders can properly manage their funds
- Choose the number of lots that matches your funds
- Profit is 4-7% of the fund account
- Stop loss is 1-3% of the fund account
Gold starts to go down? Double opportunities.Analysis of Asian market trend:
To summarize the short-term trend, "continue to step back and continue to seek key support". Gold rose and then fell in the Asian market yesterday, and the final rebound stopped at 3350. The trend is in line with our short-term bearish expectations. As for the market falling and breaking, it is a normal market. This means that the adjustment needs to continue. Today, the main focus below is still the support level of 3280. The early decline has approached this point, but it has not been completely touched; if this position is not broken, the bullish rebound is still there and it will rise at any time.
Operation adjustment, mainly low and high, supplemented by high and low, look at the shock sideways, wait for the market to break through the range and gradually look down; then the two main points of short-term focus, if the downward trend does not break 3280, then the rebound will first look at the high point of 3320. Strong breakthrough and stabilization at this position, if it does not break through yesterday's high point, it will continue to be mainly shocking; at the same time, unlike the previous consecutive rises in the past few weeks, this week's trend is slightly weak, and it is almost the weekend, so let's look at the amplitude of the range trend first.
Operation strategy:
Short around 3320, stop loss at 3328, target at 3290;
Long around 3280, stop loss at 3270, target at 3315.
Short-term trading is temporarily operated in this range, and a new layout will be made if it breaks.
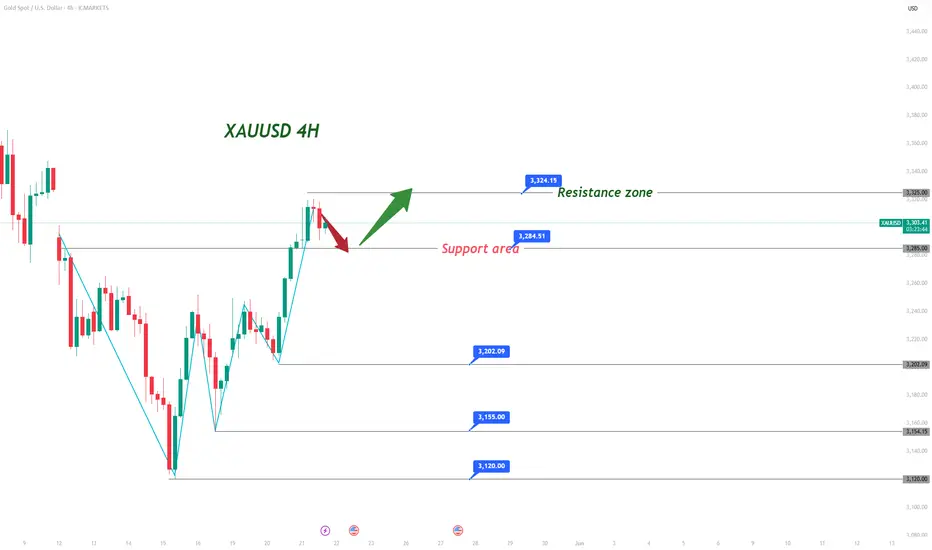
Gold Short-Term Trading StrategyYesterday, gold broke through the resistance at $3,252 and surged rapidly 🚀! It is now just a step away from the $3,330 bullish breakout target mentioned on Monday 🌟. Today's price has traded in a range of $3,285 to $3,320, and with the 4-hour chart closing lower, the market is likely to experience further consolidation ⏳.
Short-term support for gold is near $3,280 ⏬, while the upper resistance is at the existing high of $3,325 ⏫. A breakthrough above $3,325 would shift focus to the $3,350 area 🏹!
Trading recommendations:
buy@3280-3290
tp:3320-3330
Professional trading strategies are pushed daily 📊
Lock in precise signals amid market fluctuations 🚀
Confused about market trends? Stuck in strategy bottlenecks?
Real-time strategies serve as your "trading compass" 🌐
From trend analysis to entry/exit points, dissect market logic comprehensively
Refer now 📲
Help you move steadily forward in investments ✨
👇👇👇
Gold fluctuates, and the profit range is in this area
📌 Driving events
After a phone call with Trump yesterday, Russian President Vladimir Putin said that efforts to end the war in Ukraine are on track and Moscow is ready to work with Ukraine on a memorandum of understanding for a future peace agreement. The United States has begun serious trade negotiations with the European Union, which has slightly improved investor sentiment. These negotiations broke the long-standing deadlock and brought some hope for more deals after Washington signed a framework agreement with the United Kingdom earlier this month. Trump had previously said that he could also reach an agreement with India, Japan and South Korea, but the negotiations with Japan seemed to be deadlocked over the issue of automobile tariffs.
📊Commentary Analysis
Gold prices fluctuated narrowly throughout the day, mainly due to the weakening of the US dollar and safe-haven demand after Moody's downgraded the US government's credit rating.
💰Strategy Package
For intraday short-term operations, pay attention to the 3200 area for long opportunities and defend 3193. Pay attention to the 3235 area for short opportunities and defend 3242.
⭐️ Note: Labaron hopes that traders can properly manage their funds
- Choose the number of lots that matches your funds
- Profit is 4-7% of the fund account
- Stop loss is 1-3% of the fund account

Putin's phone call changed the market?
📌 Driving Events
Putin's "peace smoke bomb", gold is under short-term pressure
Just when gold was soaring due to risk aversion, a piece of news on Monday cooled the market instantly - after Putin and Trump talked on the phone, both sides released the signal that "Russia and Ukraine will soon ceasefire negotiations." Trump even announced loudly: "Russia and Ukraine will start ceasefire negotiations immediately!"
US President Trump said, "We will do everything we can to stop the conflict in Ukraine."
This news caused the market's risk appetite to rise briefly, and the gold price fell slightly to around $3,220 in the Asian market on Tuesday. But senior observers soon discovered that Putin's words were full of diplomatic rhetoric - he only said that the peace efforts were "on the right track" but did not promise a specific ceasefire time. Former Swedish Prime Minister Bilt pointed out: "This is Putin's victory. He successfully delayed the ceasefire pressure while continuing military operations."
Market truth: Geopolitical risks have not really subsided, and the safe-haven demand for gold is only a short respite.
📊Comment analysis
For investors, the question now is not "whether to buy gold", but "when to buy and how much to buy". At the moment when the global economic order is being reconstructed, the light of gold may have just begun to shine.
💰Strategy Package
Bullish breakout scenario: If the price breaks through the high of last Friday's rebound at $3,252 and continues to rise, you can go long with a light position near $3,260, targeting the $3,280-$3,290 range.
Bearish breakout scenario: If the price breaks below the key support level of $3,200 and further declines, you can go short near $3,190, targeting the $3,170-$3,160 range.
⭐️ Note: Labaron hopes that traders can properly manage their funds
- Choose a lot size that matches your funds
- Profit is 4-7% of the capital account
- Stop loss is 1-3% of the capital account
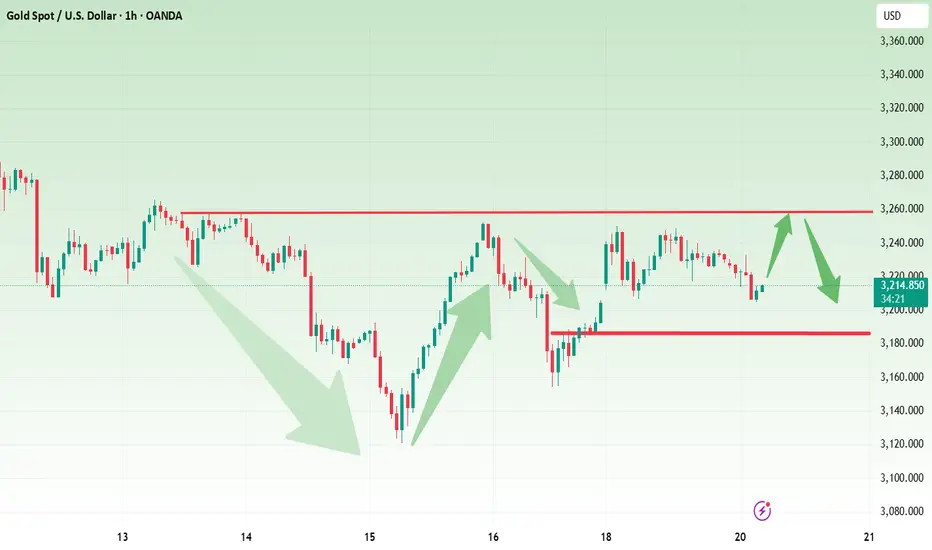
Gold sees strong high resistance; shorting on rebounds prevailsToday, gold can be described as fluctuating within a wide range, but overall it tends to be more bearish. Although gold rose at the opening on Monday, it suddenly made a sharp turn at the 3250 level, leaving those who chased long positions confused. We have analyzed that the upper resistance is strong, and the upside space is relatively limited. On the contrary, the downside space is larger, so shorting on rebounds remains the current short-term trend! If you are currently unsatisfied with your gold trading, I hope Barry can help you avoid detours in your investments. Welcome to communicate and exchange ideas!
From the hourly chart analysis, the support levels below should continue to focus on the 3170-3175 area, with strong support at the 3150 level. The resistance above is near 3253-3260. The overall trading approach remains centered on cyclic participation in shorting highs and longing lows within this range, with a core principle of exercising caution at intermediate levels – avoid excessive trading and impulsive order chasing. Be patient and wait for entry at key price points.
Gold Trading Strategies
sell@3240-3250
tp:3220-3200
buy@3170-3175
tp:3220-3230
Professional trading strategies are pushed daily 📊
Lock in precise signals amid market fluctuations 🚀
Confused about market trends? Stuck in strategy bottlenecks?
Real-time strategies serve as your "trading compass" 🌐
From trend analysis to entry/exit points, dissect market logic comprehensively
Refer now 📲
Help you move steadily forward in investments ✨
👇👇👇
Gold continues to trade sideways above the 3200 area
📌 Driving factors
The United States and China announced on Monday a 90-day suspension of tariff increases. According to statements made after the Geneva talks last weekend, the United States will reduce tariffs on Chinese imports from 145% to 30%, while China will reduce tariffs on US imports from 125% to 10%.
Meanwhile, on the geopolitical front, Russia and Ukraine are preparing for their first high-level face-to-face talks since 2022, scheduled to take place in Istanbul this week. The talks come as the international community is increasingly pressuring Moscow to accept a 30-day ceasefire. U.S. Secretary of State Marco Rubio and special envoys Steve Witkov and Keith Kellogg are expected to represent the United States in the talks.
Gold prices rebounded on Tuesday, driven by bargain hunting, while weaker-than-expected U.S. inflation data released that day also helped gold prices rise. However, trade optimism limited the strength of gold's rebound.
📊Comment Analysis
In the accumulation price zone, the gold price is sideways around 3200-3270, and the buyers and sellers are balanced
💰Strategy Package
🔥Selling gold area: 3282-3284 SL 3289
TP1: $3270
TP2: $3260
TP3: $3250
🔥Buying gold area: $3167-$3165 SL $3160
TP1: $3178
TP2: $3189
TP3: $3200!
Labaron believes
Guaranteeing the principal is the bottom line for survival, controlling risks is the armor for survival, earning profits is a stage medal, and long-term stable and continuous profits are the only proof that can finally stand up from the sea of corpses and blood.
Focus on shorting opportunities near 3250 in the US market
📌 Gold drivers
After two days of trade talks in Switzerland, the United States and China announced "substantial progress", marking a possible turning point in efforts to ease tensions between the world's two largest economies. Chinese Vice Premier He Lifeng called the talks an "important first step" toward stabilizing bilateral trade, and U.S. Treasury Secretary Scott Bessant expressed the same view, noting that the talks had made meaningful progress. The United States is expected to release more details on the results of the negotiations on Monday.
As the United States and China announced an agreement to cut reciprocal tariffs, the dollar strengthened, weakening the appeal of gold as a safe-haven asset. Spot gold fell 3% on Monday to a low of more than a week, hitting a low of $3,208 during the day, the lowest level since May 1, and the day's decline had reached $100. At the same time, the U.S. dollar index rose by more than 1%, making gold more expensive for holders of other currencies.
📊Comment Analysis
Gold still has room to go down, and the strength of gold bears is still there. Gold rebounded twice in the US market and fell back under pressure near 3250.
💰Strategy Package
At present, the US market still has a demand for a pullback, and the long position near 3220 can now be closed for profit. For the US market, we should first look at the area around 3250. After the pullback is in place, continue to play short orders to look at the target position of 3200. If it breaks upward, find a new point layout. This week's data market and news will have a further impact on gold. For real-time layout of accurate trading signals, please follow the free channel.
⭐️ Note: Labaron hopes that traders can properly manage their funds
- Choose the number of lots that matches your funds
- Profit is 4-7% of the fund account
- Stop loss is 1-3% of the fund account
XAUUSD GOLD LONG/BUYBy utilizing Fibonacci retracement levels, historical patterns, , we can formulate a hypothesis that the market might follow a similar trajectory if bullish sentiment prevails.
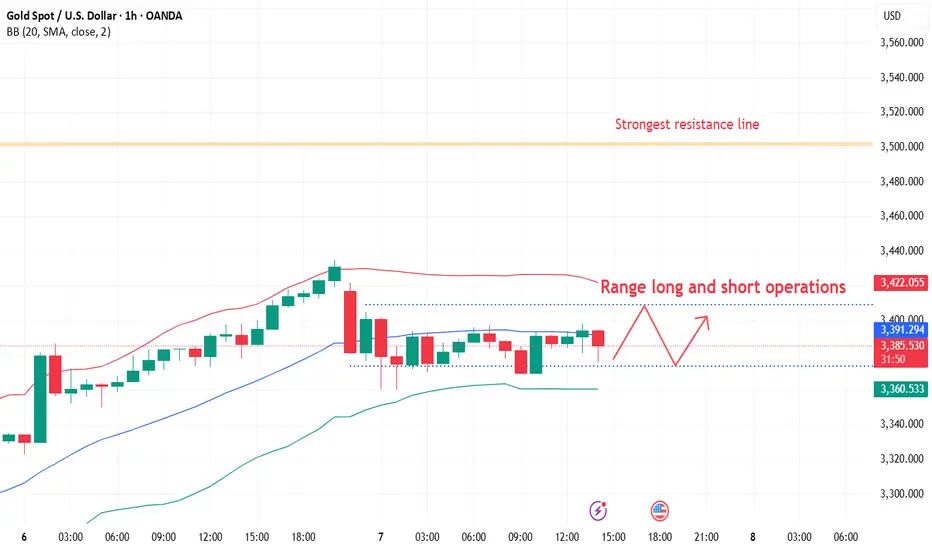
Gold fluctuates, long and short operations in the US market!
📊Comment analysis
At 14:00 on Wednesday, US time, Fed Chairman Powell will hold a monetary policy press conference.
The market generally expects that the FOMC will continue to remain on hold at this meeting, as the impact of tariff policies on inflation and the economy remains to be seen; the Fed may cut interest rates in June. Since this interest rate decision does not update economic forecasts, the focus will be on the Fed's accompanying comments on any signals of future interest rate cuts to support the economy. Since the decision to keep interest rates unchanged has been fully digested by the market, Powell's tone at the press conference will be the key to changing the market's expectations for interest rate cuts this year.
💰Strategy package
The US market is expected to remain volatile, and both long and short positions have opportunities. You only need to operate at a certain point. Go long on a short-term retracement to 3378 support, and go short when it reaches the upper resistance of 3408.
⭐️ Note: Labaron hopes that traders can properly manage their funds
- Choose a lot size that matches your funds
- Profit is 4-7% of the capital account
- Stop loss is 1-3% of the capital account
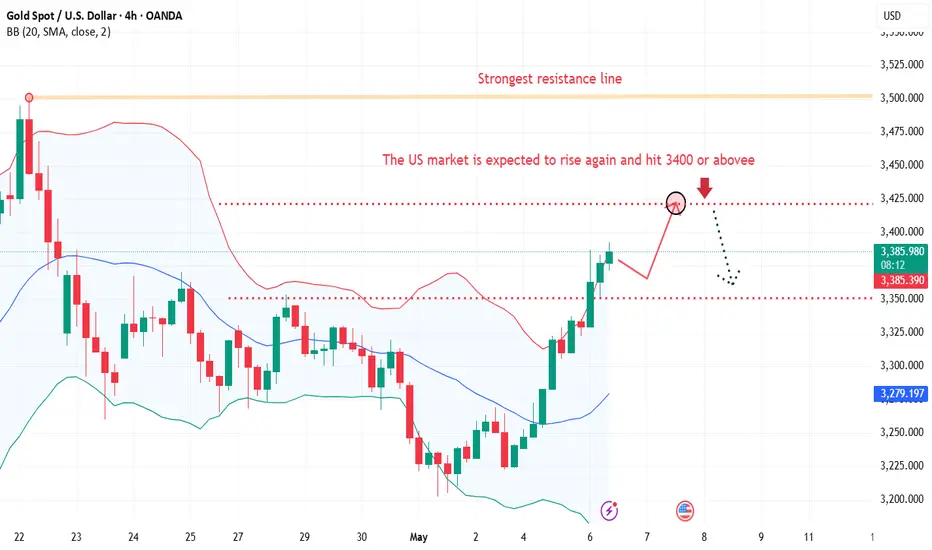
3420, gold prices can reach today
📌 Gold driving factors
Driven by the weakening of the US dollar and safe-haven demand, spot gold closed up $93.77 on Monday, up 2.9%, at $3333.32 per ounce.
On Monday local time, US President Trump signed an order on biomedical research, hoping to take the opportunity to promote the US pharmaceutical manufacturing industry. Trump also announced that tariffs on pharmaceutical products will be announced in the next two weeks.
Kitco Metals senior metals analyst Jim Wyckoff said: "We see continued inflows of safe-haven demand, keeping gold prices high. Gold prices will remain above $3,000 per ounce, at least in the short term."
Gold is often seen as a safe-haven tool in uncertainty and performs well in a low-interest rate environment. Gold prices have soared 26.3% this year and have set new historical highs many times.
📊Comment Analysis
Bulls regained their dominance, and the upward trend approached above 3400 before the market expected a rate cut
💰Strategy Set
🔥Sell Gold Area: 3418-3420 SL 3425
TP1: $3410
TP2: $3400
TP3: $3385
🔥Buy Gold Area: $3323 - $3321 SL $3316
TP1: $3330
TP2: $3340
TP3: $3358
⭐️ Note: Labaron hopes that traders can properly manage their funds
- Choose the number of lots that matches your funds
- Profit is 4-7% of the fund account
- Stop loss is 1-3% of the fund account
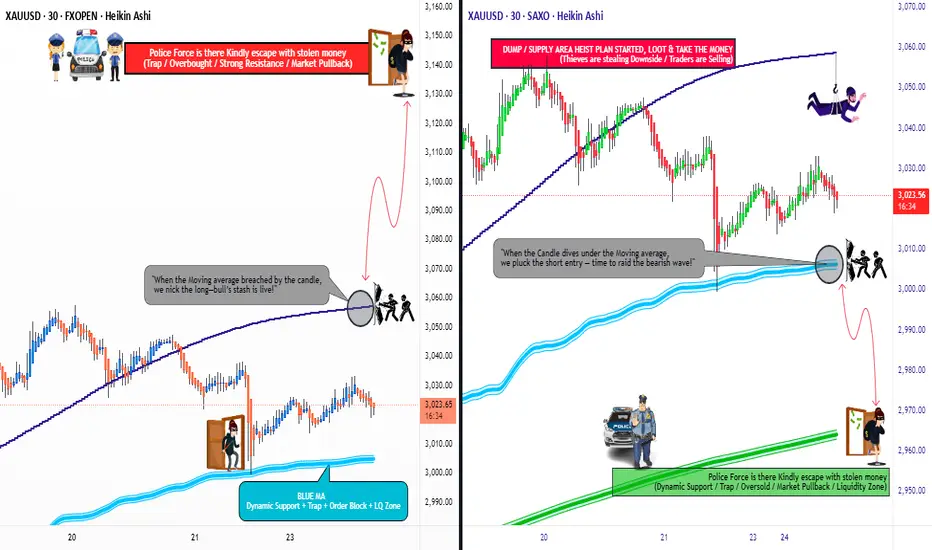
XAU/USD "The Gold" Metal Market Heist Plan (Scalping / Day)🌟Hi! Hola! Ola! Bonjour! Hallo! Marhaba!🌟
Dear Money Makers & Robbers, 🤑💰✈️
Based on 🔥Thief Trading style technical and fundamental analysis🔥, here is our master plan to heist the XAU/USD "The Gold" Metal Market. Please adhere to the strategy I've outlined in the chart, which emphasizes long entry and short entry. 🏆💸Be wealthy and safe trade.💪🏆🎉
Entry 📈 :
"The loot's within reach! Wait for the breakout, then grab your share - whether you're a Bullish thief or a Bearish bandit!"
🏁Buy entry above 3060
🏁Sell Entry below 3000
📌However, I recommended to place buy stop for bullish side and sell stop for bearish side.
Stop Loss 🛑:
🚩Thief SL placed at 3020 for Bullish Trade
🚩Thief SL placed at 3040 for Bearish Trade
Using the 30mins period, the recent / swing low or high level.
SL is based on your risk of the trade, lot size and how many multiple orders you have to take.
Target 🎯:
🏴☠️Bullish Robbers TP 3140 (or) Escape Before the Target
🏴☠️Bearish Robbers TP 2970 (or) Escape Before the Target
XAU/USD "Gold vs U.S Dollar" Metals Market Heist Plan is currently experiencing a neutral trend,., driven by several key factors.
📰🗞️Get & Read the Fundamental analysis, Macro Economics, COT Report, Seasonal factors, Sentimental Outlook, Positioning and future trend.....👉👉👉
⚠️Trading Alert : News Releases and Position Management 📰 🗞️ 🚫🚏
As a reminder, news releases can have a significant impact on market prices and volatility. To minimize potential losses and protect your running positions,
we recommend the following:
Avoid taking new trades during news releases
Use trailing stop-loss orders to protect your running positions and lock in profits
💖Supporting our robbery plan 💥Hit the Boost Button💥 will enable us to effortlessly make and steal money 💰💵. Boost the strength of our robbery team. Every day in this market make money with ease by using the Thief Trading Style.🏆💪🤝❤️🎉🚀
I'll see you soon with another heist plan, so stay tuned 🤑🐱👤🤗🤩
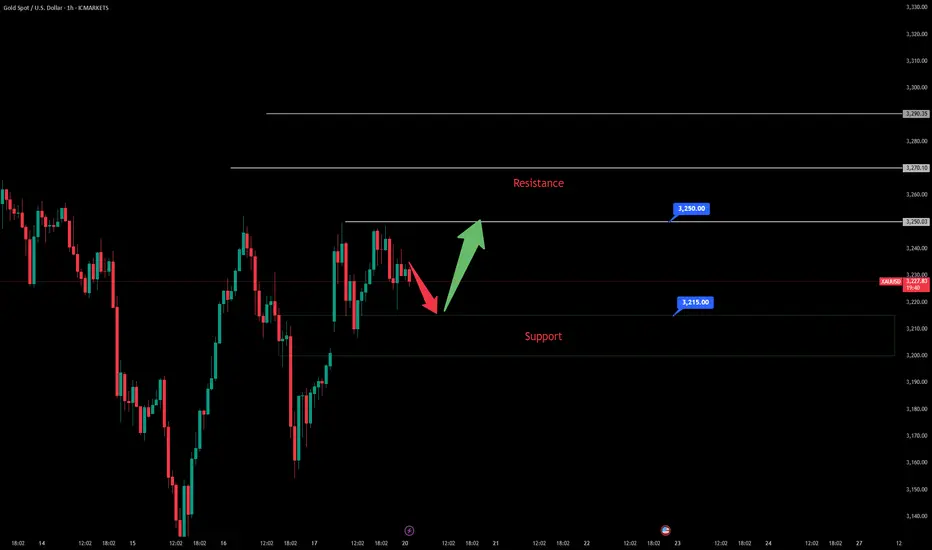
NFP market, looking for opportunities to short goldFundamentals:
Mainly focus on today's NFP market;
Technical aspects:
Gold rebounded near 3200 and has gradually rebounded to around 3265. This wave of rebound is not surprising. After all, I have been insisting on short-term long gold since yesterday, and I have also gained a good profit. As gold falls and breaks through many key supports, my expectations for the magnitude of this rebound are not high. In the short term, it will first face resistance in the 3270-3275 area, and secondly, it will face resistance in the 3285-3295 area.
Moreover, the rebound and rise of gold before the NFP market is very confusing in itself. It is not ruled out that it is to pave the way for the sharp drop in the NFP market. Once gold falls again, it is likely to fall below 3200 and continue to around 3180.
Trading strategy:
1. Consider shorting gold when it rebounds to 3270-3280, TP: 3240-3230;
2. Consider continuing to short gold when it rebounds to 3280-3290, TP is the same as above.
NF shows a volatile downward trend
📌 Gold Information
China's Ministry of Commerce announced on Friday that the United States has recently initiated communication through official channels, expressing interest in restarting tariff negotiations. Beijing is currently evaluating the proposal, which has sparked optimism that a solution to the long-standing tariff deadlock between the world's two largest economies is imminent.
New hopes for a breakthrough in trade negotiations helped the dollar rise to a three-week high on Thursday, pushing gold prices down towards the $3,200 mark. However, the dollar's bullish momentum remains weakened as the market increasingly digests expectations that the Federal Reserve may cut interest rates further, especially with the closely watched US non-farm payrolls data about to be released.
📊Comment Analysis
NF news volatility is certain, having accumulated significantly since last week. Gold price confirmed the trend after breaking through 3267, and fluctuated downward below 3200
💰Strategy Package
TP1: $3290
TP2: $3280
TP3: $3270🔥
Buy gold area: $3175 - $3177 SL $3170
TP1: $3185
TP2: $3200
TP3: $3210⭐️
⭐️ Note: Labaron hopes that traders can properly manage their funds
- Choose the number of lots that matches your funds
- Profit is 4-7% of the fund account
- Stop loss is 1-3% of the fund account
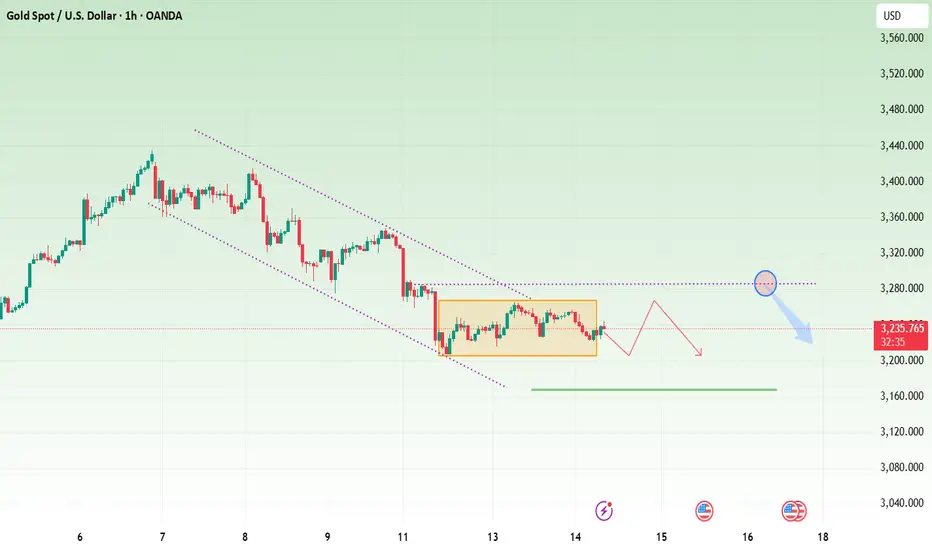
Gold starts a unilateral decline?
📌 Gold information
U.S. stock indexes fell sharply in midday trading due to disappointing U.S. economic data. On Friday, the U.S. Department of Labor will release the crucial monthly employment report. This is likely to be the most important U.S. data point so far this year.
In other news, Dow Jones News Service reported: "Tariffs are beginning to bring pressure, prompting the Eastern giant to increase stimulus to support economic growth.
📊Comment analysis
For international gold, what you need to do now is to follow the market. Don't think about bottom fishing. You can do a short-term rebound during the day. When the market has clearly broken the structure, you should choose to believe in the technical side, rather than speculate on the next support. This will only be endless. At this stage, if you fail to bottom fishing, are you still ready to try again near the integer of 3200? This is not over yet. Even if it falls below 3200, the 3180 horizontal support will be immediately below.
This round of decline is about to completely give up the second rise in the front end, depending on 3180. This is why I just said that 3200 will immediately encounter a new support. The reason why many people choose to go long above 3240 is also because it is the first stage of the high platform of the front-end surge, and it is necessary to defend. Unfortunately, the defense is not successful now. In other words, if you want to go short next, you have to look at the continued decline. What are the characteristics of the continued decline? You certainly can't tolerate it having an excessive rebound, so don't think about any high-altitude trading strategy.
💰Strategy Package
Short position:
Actively participate at 3230 points, and the profit target is around 3200 points
⭐️ Note: Labaron hopes that traders can properly manage their funds
- Choose the number of lots that matches your funds
- Profit is 4-7% of the capital account
- Stop loss is 1-3% of the capital account

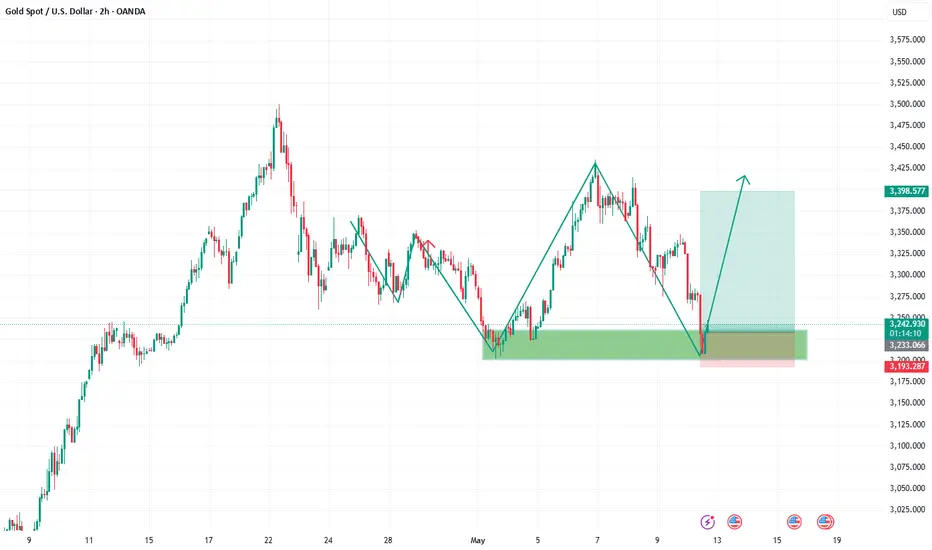
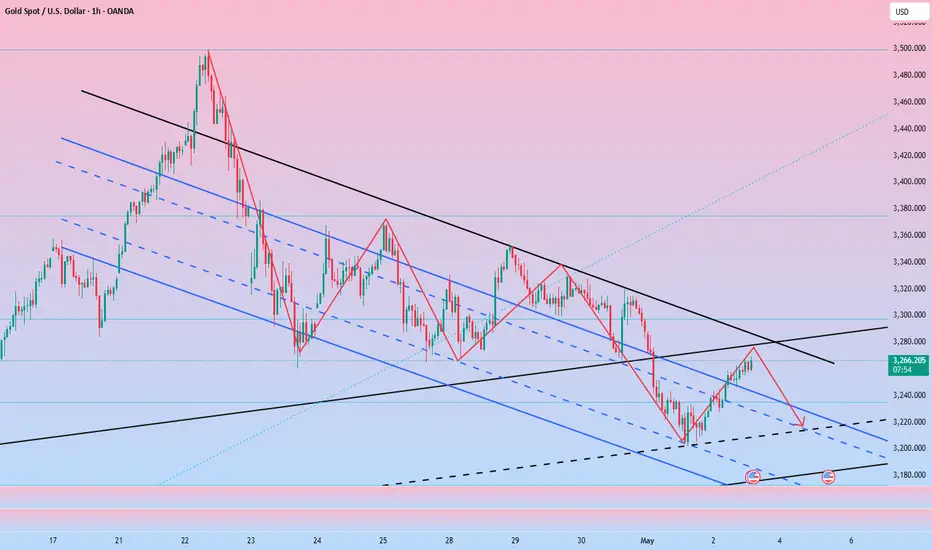
XAUUSD quick BUY tradeHi fellow traders, XAUUSD will be ready to make a move higher from the blue box after completing the correction. Target the 3334.67 level. Good luck and trade safe!
