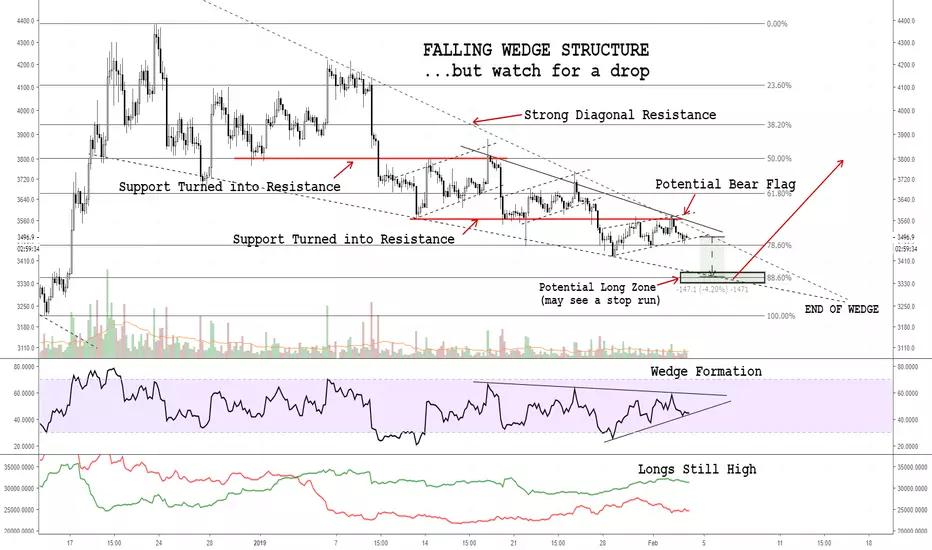
Bitcoin - Wedge Structure With a Potential For One More DropHello Traders!
The end of this wedge set up is closing in within the next 3 days.
Bitcoin is yet again forming another potential ABC Bear Flag Formation as it has two previous times.
We also saw a strong support/resistance flip as it tested both the diagonal and resistance as well as the horizontal resistance.
Currently we are sitting on the 78.6% fibonacci level and sitting within the RSI wedge on the 4 hour time frame.
I'm not in a position at the moment and may look for a long position on a breakout from the wedge and a potential short scalp if we break the 78.6% level.
Ideally, the best entry here may be at the $3350-$3390 zone after a 4% drop.
The main bullish point I see is the TD 9 on the 3 day is showing a buy candle, which is the 4th time in the past year since it hit the $20,000 high.
We REALLY need this 200MA hold on the weekly to maintain any bullish hope for the short term and mid term.
I'll be updating over the next 5 days as we see this wedge structure play out.
Let me know what you think below and where you see Bitcoin's price heading.
Xbtusdt
XBTUSD Excellent short opportunity setup, Limit orders setupCurrently developing the E-Wave, all signs point to overall bearish. Looking for the final leg upwards before the next drop downwards. Great Shorting opportunities!!
I have my short entries set at XBTUSD: Kraken 5(X) leverage:
Entry Short (set up limit orders for the following positions) : 3475/3500/3550/3600/3650 ---> also increase the amount added to each short as the price advances. Make your base position entry at 3475.
SL: none/ only commit 20% of your funds to this position- if it goes above (highly unlikely) 3650/ take more short positions until 3850 --> unlikely
T1: 3300
T2: 3250
Sideways, Boring, Perfect for the End of a Crash PatternA crash pattern's end is accompanied by a period of reduced price volatility and volume on top of an institutional benchmark. We are seeing those symptoms in full force.

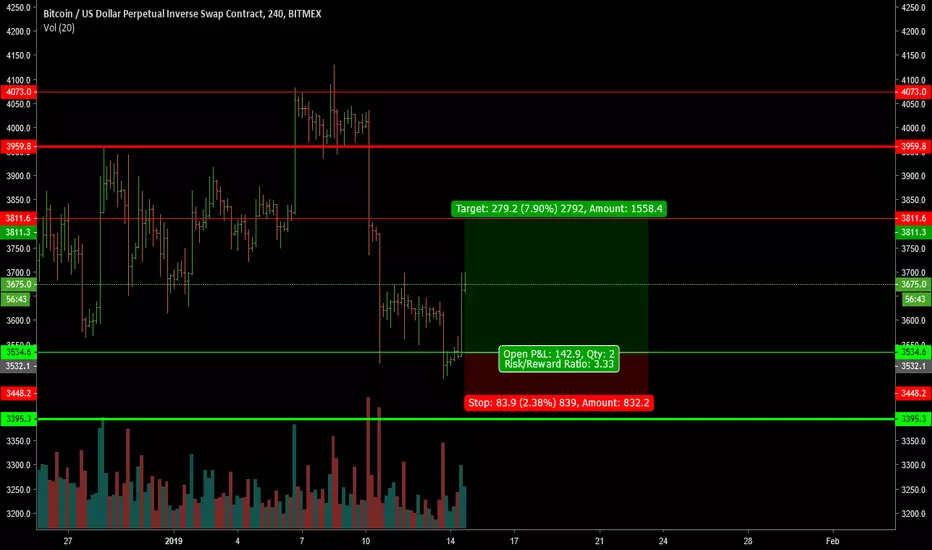
Layering in Longs for the BullrunAn excellent time to get some futures contracts open on BTC, the profit ratios here are insane.

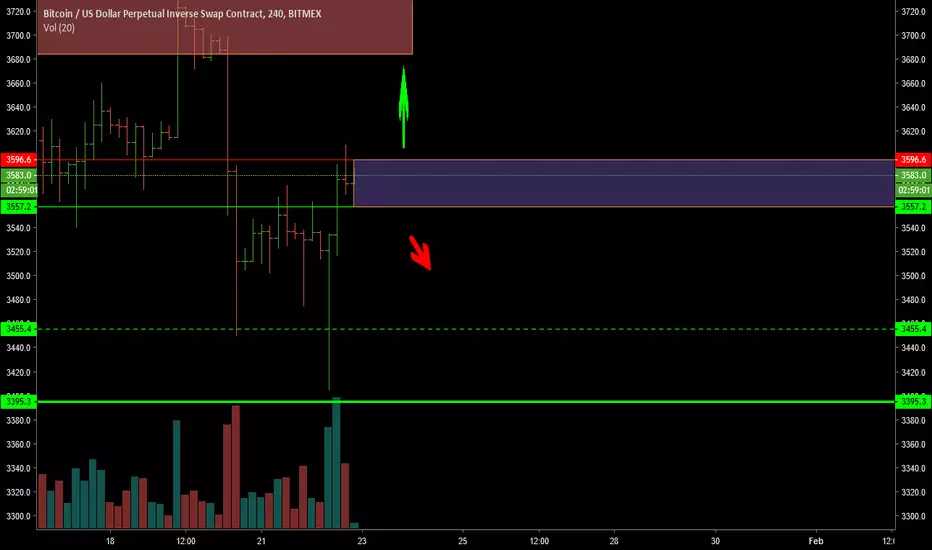
XBTUSD Update near miss of major support.That was some Price action there. Missed by $10. No problem. Currently it's in no mans land. a break and close above red line will give bulls the upper hand.
Break below the thin green line is back in control of the bears. In between expect some sideway action.
XBTUSD updateXBT broke down and currently retesting it's resistance.
I doon't think the resistance is going to hold and probably some new bottom buyers might come in later. Possible to reach 3807.
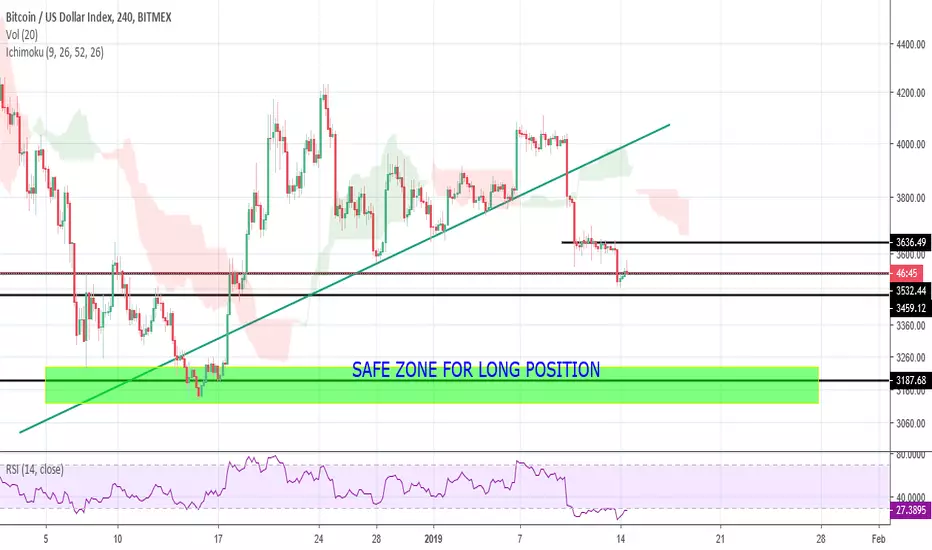
IMPORTANT UPDATE ON XBT BTChello guys
after hanging almost one weak btc just break down of crucial support of 3550$ now the next stop for opening the long position is 3450$ but that's not a strong support foe opening long position, the next strong support for my is 3150$-3200$ this is a strong support and will give enough confident for opening the long position,before that support opening a long position is like a gambling
#DYOR
thanks and best of luck
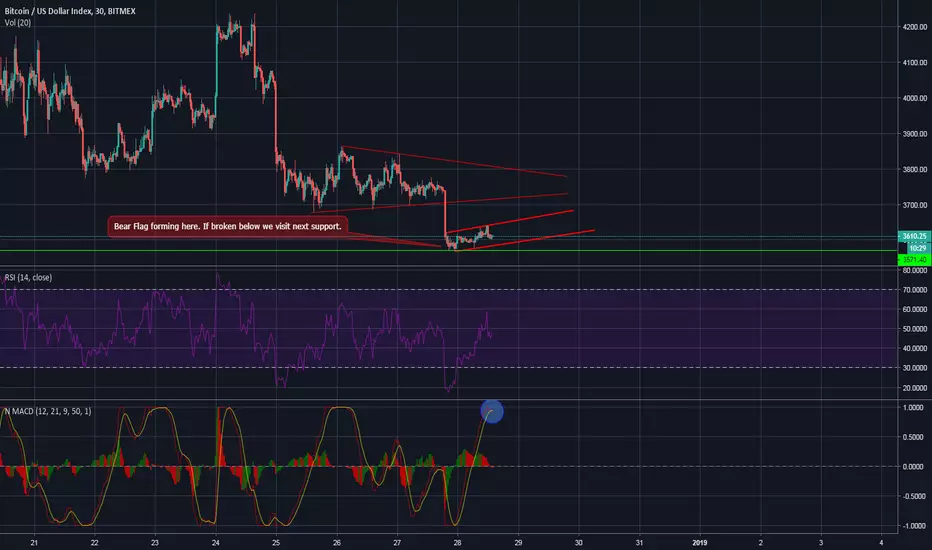
Buttcorn needs some helpBitcoin needs a catalyst in order to send us up. People keep selling and we will be stuck in this bear market until we get something worthy of a reversal.
-BTC seems to be forming a bear flag on plenty of time frames.
-MACD is crossing down on the 30min chart.
-We could see a bit of movement down to the next support. From there we will have re evaluate the situation there.
-MACD crossing down on the 1D time framer
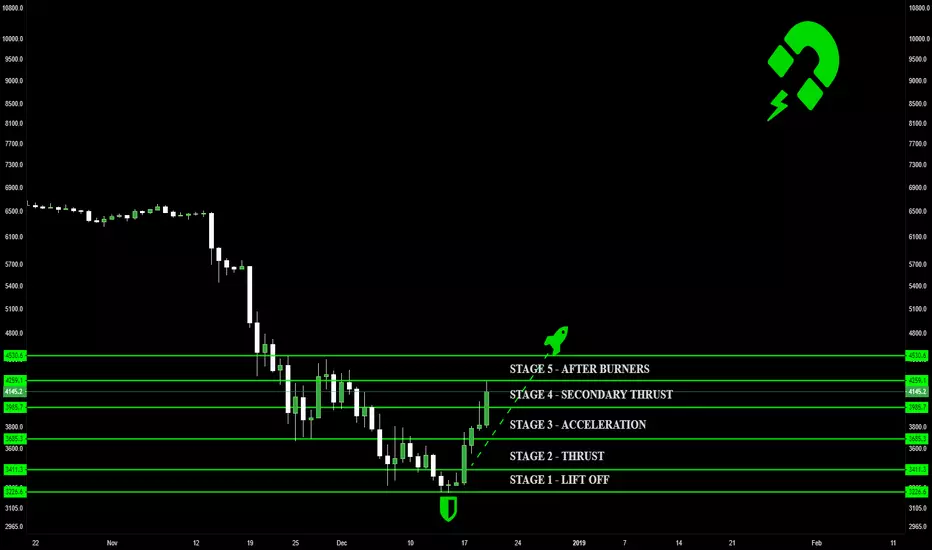
A Rocket Ship Full Of Salt and Tears... Saved By a MagnetAn Ode To The Magnet:
When all was at a loss, and salt was at a high,
The magnet showed up, to pull us to the sky.
The hero we needed, but certainly don't deserve.
Our prayers were answered, our calls were heard.
When darkness loomed, all feared the worst.
Short sellers calling $1000, Bloomberg the hearse.
"Bitcoin will never die", the magnet said to us,
Load the ship with your salt, and I'll STILL carry it up.
Most laughed and snickered, as I posted my chart,
$5,000 they said - HA!, Market Makers are too smart!
They snorted and shorted, but soon felt the burn,
As Arthur and my magnet, liquidated all that they've earned.
Bring me your tired, your weary and your rekt.
I will lift you all, while the shield will protect.
All looked up, and asked the magnet 'when moon?'
The magnet looked down, and simply said 'soon.'
+1 Like To Continue To Power This Magnet.
Bitcoin Up 30% since original post.
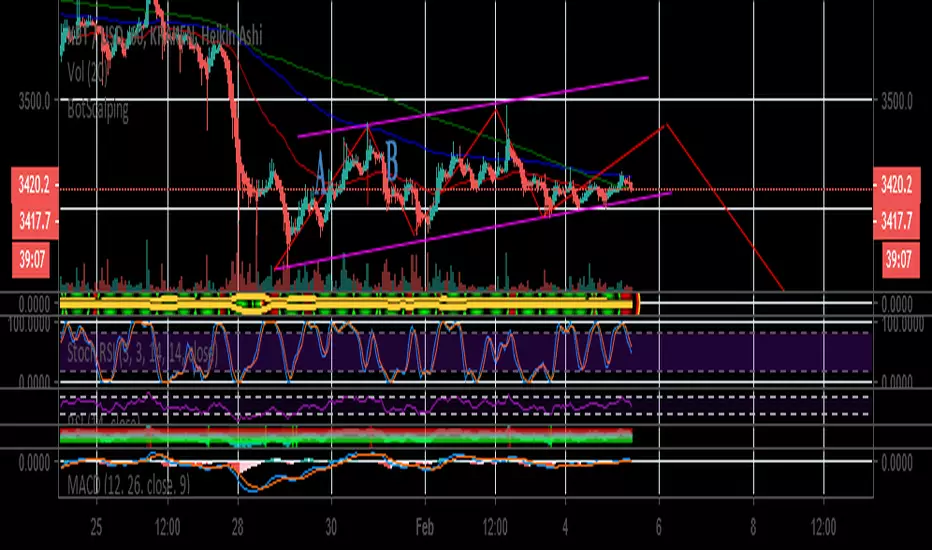
Am i very bearish ?
Hi traders,
Last 1k dump really made me sick and bearish.
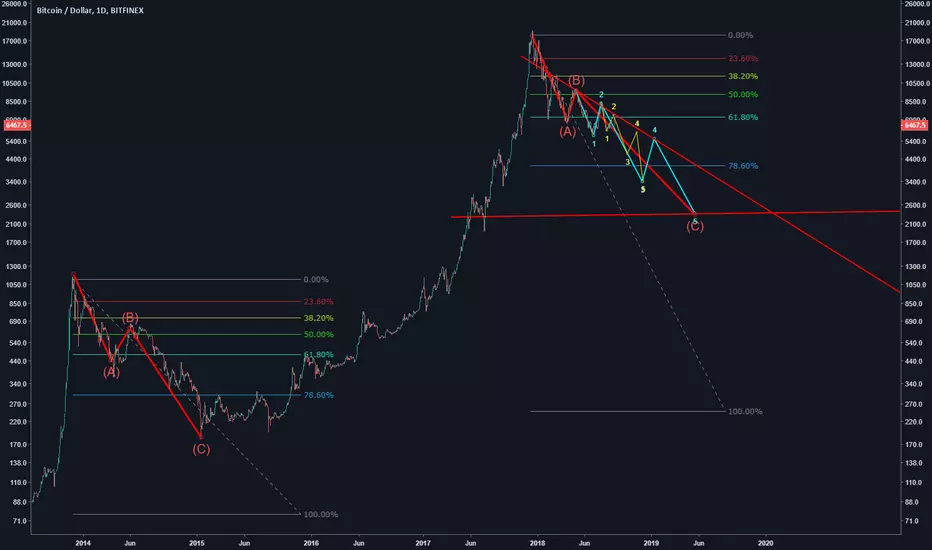
I counted correction waves of 2014 crash and i see a lot of similarities within current btc crash waves.
My suggestion that we are currently in C wave of ABC correction.
I thing my wave count for 2014 crash is OK. The ratios of waves to each other are almost ideal. And similar wave count and pattern is seen in 2018 crash.
A and B waves of ABC correction have already occurred and now we are in C wave.
Crash in may would be start of impulse subwave 1 of C wave (blue waves), and crash at the beginning of august would be starting point of impulse subwave 3 of C wave.
Current crash probably started another impulsive subwave 3 (yellow waves) within impulse subwave 3 of C wave.
To cut short, if this purely bearish counting is working, dip is at 2.5k region, and this would be true bottom of triangle. If the bull comes, if it really comes, it might come up if it breaks this huge triangle up.
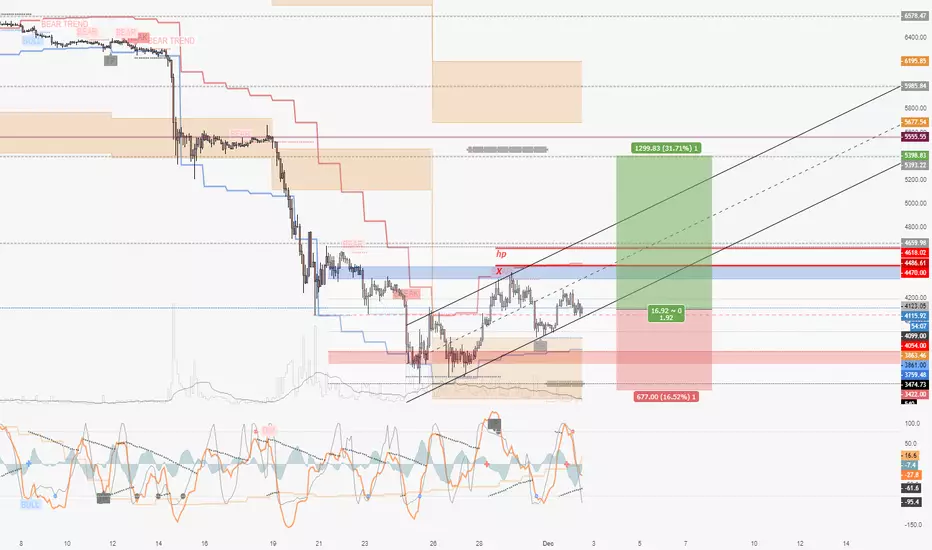
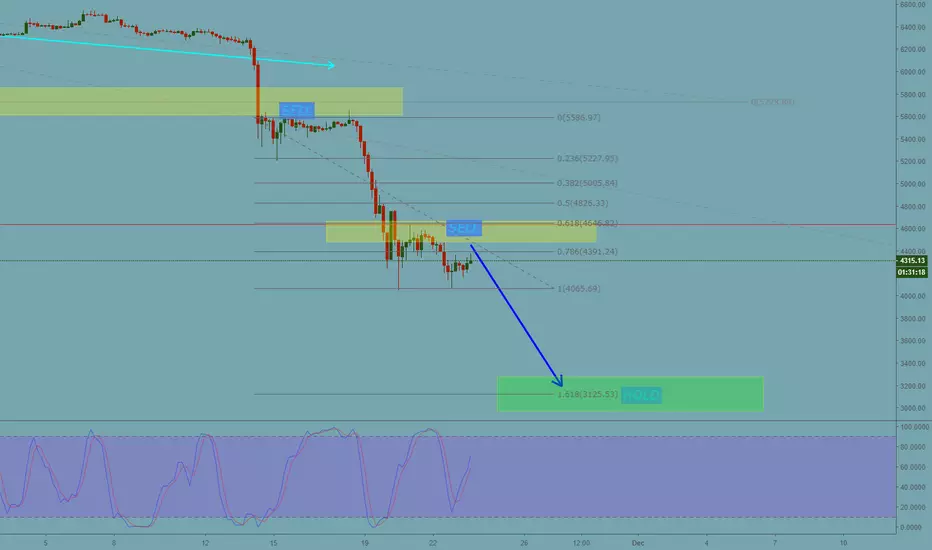
Buy the breakout or the 0.65BTC might be correcting the impulse from 4010 to 4656 and the best price to buy is between the 0.5 and 0.65. If this holds, btc will create and IHS with a pretty high target. (4800, 5050, 5300)
definitely NOT a good timing to long
For big whale to earn money, the easiest way is to destroy the market and make the long position all rekt .
I don’t think it’s a good idea to long for now. Because what normal people think about that extremely low rsi? They will probably think its the bottom and make a long position.
But think like a big whale, if most people believe it’s a bottom , and most of them long at these area. Then Isn’t this another huge chance for big whale to make money?
YES , probably whales will drop the market again, and they will make those people who longed getting rekt again, to accumulate at a far lower range.
So guys, it’s a very risky time to hold position. Remember if you want to have position you need to have strictly having enough reasons and confirmations.
Bitcoin falling & wedgingBitcoin fallingwedges to new breakout after that last bouncy drop retest it seems, herewith a tip called $SPRTS for the $DOGE traders PM me if u need to know more.
wow much tip very secret
such shitcoin #doggonacci
