Energy Sector going Down. XLEImmediate targets 60, 58, 57 .
We are not in the business of getting every prediction right, no one ever does and that is not the aim of the game. The Fibonacci targets are highlighted in purple with invalidation in red. Fibonacci goals, it is prudent to suggest, are nothing more than mere fractally evident and therefore statistically likely levels that the market will go to. Having said that, the market will always do what it wants and always has a mind of its own. Therefore, none of this is financial advice, so do your own research and rely only on your own analysis. Trading is a true one man sport. Good luck out there and stay safe
XLE

$PXD at PCZ of Bearish Alt-Bat with Bearish DivergenceWe have Multiple Instances of Bearish Divergence on both the MAC and RSI at the PCZ of a Bearish Alternate Bat and at Price Level Resistance I expect to see a significant Bearish pullback from here.

$CTRA: Lower Low Hidden Bearish Divergence Monthly ContinuationWe have Hidden MACD Bearish Divergence on the Monthly and if proceeded by follow-through price action we can be in the midst of breaking through the confirmation line of a 3 Rising Peaks. Upon Breaking through i suspect it will give us an ABCD BAMM movement all the way down to a minimum 88.6% retracement but at a maximum it could go slightly lower than that.

Bearish Divergence on US DollarThis is a long term monthly chart of the US Dollar. There was a bullish divergence back in the 1980's that preceded a long term strengthening dollar throughout the 90's. There's a bearish divergence that started in 2014 and is intact today. I don't like to put to much emphasis on inter-market analysis because it can cause paralysis by analysis. However, wouldn't this question the breakouts we see in banks? Would this confirm the breakout we're seeing in energy continuing from last year? If the dollar does weaken even with higher interest rates does that mean that inflation is here to stay? I have no idea. LOL. I'm no economist but I think this chart is interesting. Thoughts?

Week 4: Sector ETF Expectations I use sector ETFs in my IRA account. Currently, I hold XOP and XLF, and I wish I held XLE. I will try to buy XLP (Which shouldn't be a problem) next week.
For Week 4, I'm expecting XLF to firm up and XOP to come in a bit. XLE would be kind to give me an entry point at prior resistance/ support, but we'll see. Oil looks darn strong at the moment.
XLF (Held), hurt me Friday, but held support.
XLE on fire
XOP (Held), can it hang on and break through resistance?

Energy ($XLE) Relative to S&P 500 ($SPY)The energy sector is looking to breakout of a 2-year consolidation phase. Perhaps 3rd time is a charm. Largest components of $XLE include: Exxon Mobil ($XOM), Chevron ($CVX), EOG Resources ($EOG), Schlumberger ($SLB), & ConocoPhillips ($COP).

$SLB — ShortEnergy has been on an absolute tear lately but it can't rise to the sky.
It is very overbought according to the oscillators and RSI.
I also am eyeing that open gap which lines up right with the 0.50 fib channel retracement level.

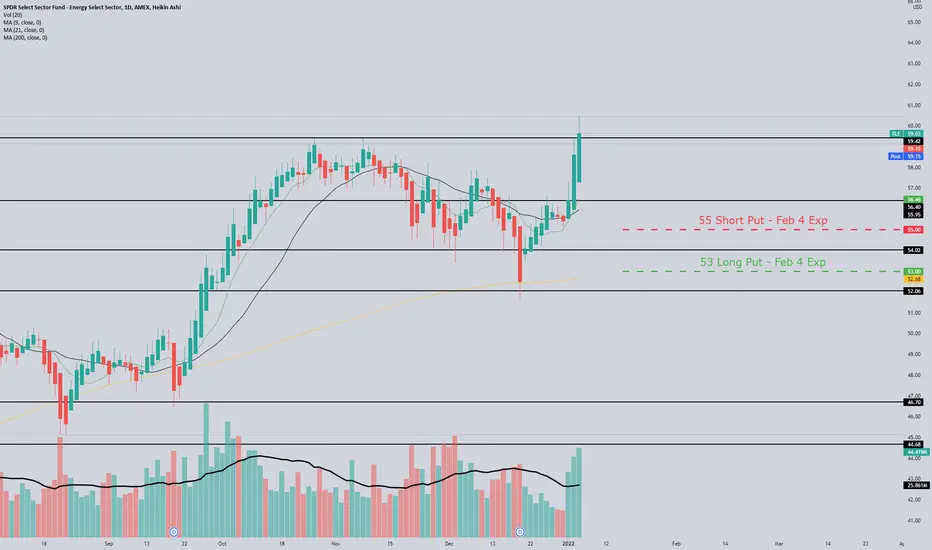
XLE 55/53 Put Credit SpreadOpened for a 0.25 Credit
XLE is making a strong move upwards, this filled on the afternoon pullback. If this pulls back in the next few days I will add the call side to turn this into a IC. This will provide me delta neutrality and allow me to play the range from 55-60.
$XLE $SXLE 2022 Setup Perfect formation and setup for Energy stocks which I expect bullish performance till end of Q2 2022 and by then most likely 2 interest hikes will be already done. Then as of Q3 also due to base effect inflation will start to come down and rotaion will be from value to growth stocks.
on Weekly chart it is even more visible. My 2022 portfolio will be on precious metals gold and silver (more on silver) and energy stocks till June-July and then switching to beaten down tech stocks like ARKK, ARKG, SE, LSPD NOW etc.

TOPUP Buying The Dip Strategy //This is just a TOPUP Buying The Dip Strategy that you can incoporate with your existing DCA type investments
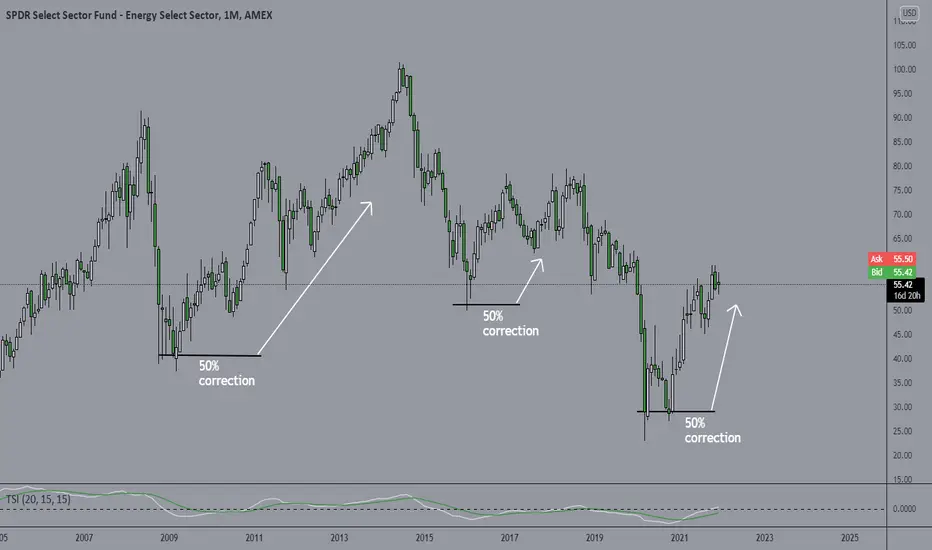
What I like about trading Commodity based ETF (i.e Oil and Gold), every falling price will always means its just a correction. Meaning, after a dip it will again rally. Unlike stocks, it's difficult perhaps borderline impossible for commodity price to fall below zero (in this case for oil, it did but not for long) hence ETF that tracks the price of Oil will never go below zero.
Everytime this ETF make 50% correction, you buy the ETF shares. That's the strategy. Now I do not recommend to use a buy and hold strategy here. You need to decide how you want to take profit as soon as you buy the shares. Percentage based? Momentum based? trailing stop? fundamentally based? All up to you
The whole point of this post is to show every correction/falling price, its an opportunity to buy. This is a monthly chart and such opportunity only occured 3 times in the last 20+ years.. hence why I call this just a TOPUP strategy.
This can work with other commodity based ETF and you even can use this for SP 500 but waiting for 50% correction would be very rare but perhaps shorter corrections like 6-8%
Halal way to trade the movement of the Oil prices : ETFI am a Muslim so there are issues about the halal-ness in trading CFD, particularly the Brent CFD (BCOUSD in Oanda)
My solution for this is to buy an ETF that tracks oil companies (Oil companies stock price movement generally moves almost the same as the price movement of Brent and WTI). I found either FENY and XLE as great ETF for this. Unfortunately USO and UCO are tracking Brent futures.
I will use the Brent price chart to determine when I will swing trade FENY or XLE ETF. Look at the chart and it is self explanatory
Cool thing is sometimes FENY will perform slightly better than Brent CFD (13.87% for Brent / 16.85% for FENY for this particular timeframe)

SPDR Energy Sector Fund pulling back momentarily. XLEConsolidating here to the third degree and looking for an eventual downward Wave B. Even if its a shallow pull back, there is still much time and space for this thing to drop in the coming days or weeks.
We are not in the business of getting every prediction right, no one ever does and that is not the aim of the game. The Fibonacci targets are highlighted in green with invalidation in red. Fibonacci goals, it is prudent to suggest, are nothing more than mere fractally evident and therefore statistically likely levels that the market will go to. Having said that, the market will always do what it wants and always has a mind of its own. Therefore, none of this is financial advice, so do your own research and rely only on your own analysis. Trading is a true one man sport. Good luck out there and stay safe!

$ERII: Midstream Dream$ERII setting up with a really nice base in the energy space, I'm being very selctive about $XLE and energy names due to political risk and potential commodity gluts.

Elliott Wave View: Energy ETF (XLE) Wave 5 In ProgressShort-term Elliott wave view in Energy ETF (XLE) shows a 5 waves impulse structure from August 19, 2021 low. Up from there, wave 1 ended at 49.69 and pullback in wave 2 ended at 46.47. The ETF then extended higher in wave 3 towards 59.41 and pullback in wave 4 is also proposed complete at 57. The 1 hour chart below shows the internal subdivision of wave 4 as a zigzag Elliott Wave structure.
Down from wave 3, wave (i) ended at 58.78 and rally in wave (ii) ended at 59.36. Wave (iii) ended at 58.50, rally in wave (iv) ended at 58.94, and final leg lower wave (v) ended at 57.94. This completed wave ((a)) of 4 in higher degree. The ETF then bounced in wave ((b)) of 4 which ended at 58.82. Wave ((c)) of 4 lower completed at 57 with internal subdivision also as a zigzag.
The ETF has turned higher in wave 5, but it still needs to break above wave 3 at 59.41 to avoid a double correction. Up from wave 4, wave (i) ended at 57.79, pullback in wave (ii) ended at 57.23, wave (iii) ended at 58.03, wave (iv) ended at 57.75, and wave (v) higher ended at 58.35. This completed wave ((i)) in higher degree. Pullback in wave ((ii)) ended at 57.23. Up from there, wave (i) of ((iii)) ended at 58.62. Near term, while dips stay above 57, expect the ETF to extend higher.

XLE - Short Term Bearish Overbought on the daily and reaching top of both daily and weekly channels. Not to mention printing one ugly bearish weekly candle. Looking for a pullback towards $51-$52 area but will need some market weakness to happen. 54.50 - 54.80 support will need to be broken as well and where I plan to reduce 50% of my short position from Friday.

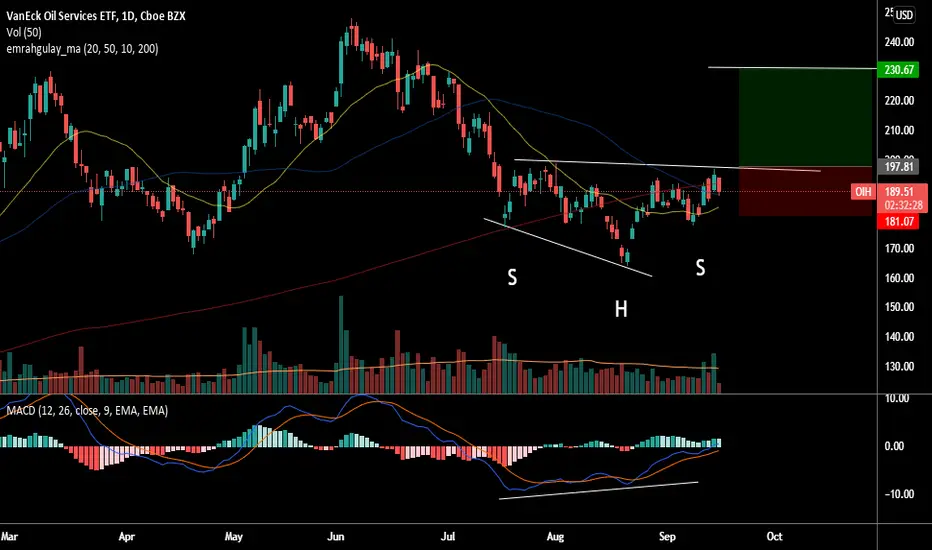
Oil ETF, $OIH with a "head & shoulders" patternA lot of analyst have been publishing bullish outlooks for AMEX:XLE . But we have AMEX:OIH in our portfolio for long term position and now is also making several bullish signs. Bullish divergence with the MACD, above average buying volume and price action making a head & shoulders pattern (reversal pattern).
This trade would be a short term trade. The buy point is on the breakout above $197 and the target for profit taking is at $230 for a 16% profit. The projection for price target comes from the rules of the "h&s" pattern. According to the Bulkowski Chart Pattern Ranking (thepatternsite.com), this pattern is Rank #1 with a 50% chances of a throwback after the breakout, so be aware.
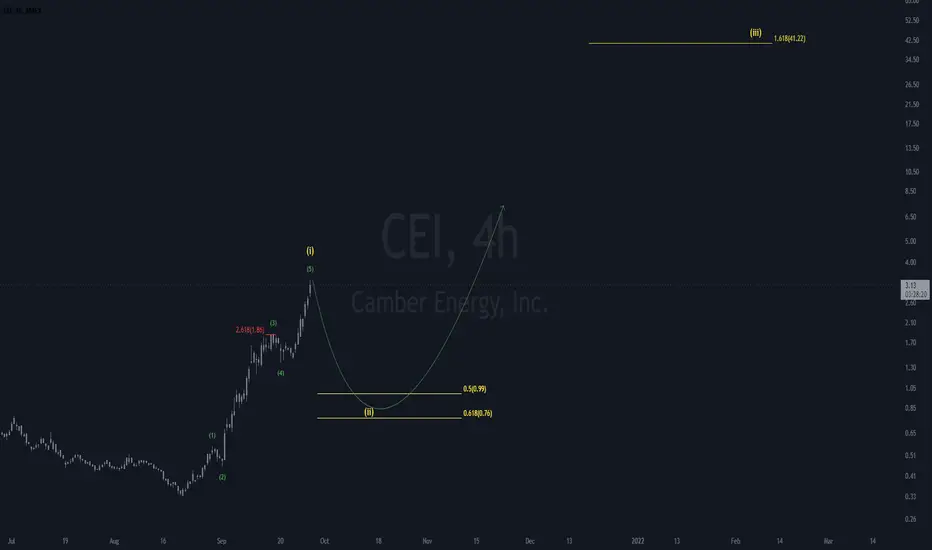
you don't cei?cei has turned into the next big trending meme stonk,
but like all stonks,
it moves up in 5 waves
wave 5 is either in, or is about to be in.
-buying cei at a dolla in the near future, secures a pretty big trade to the upside.
if you manage to grab it for a dolla, it's a long hold.
$XLE Plan for this weeksolid orange are intraday actionable plays
dotted are take profit targets
Harmonic pts are for longer dated positions

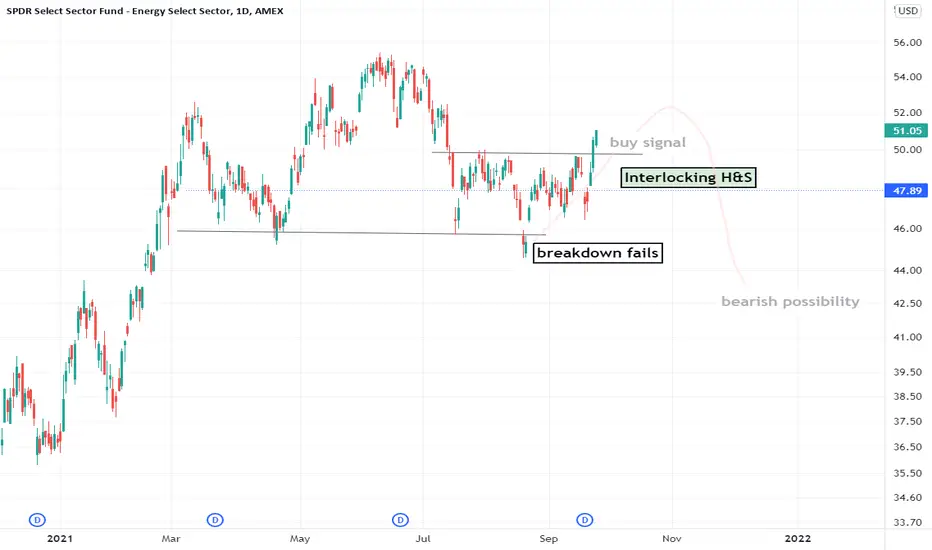
Energy flashing a buy signal (Technical Analysis)AMEX:XLE
NYMEX:CL1!
NYSE:XOM NYSE:AMPY
Energy stocks, crude oil, and the XLE energy ETF all flashing buy signals. $100 oil looks invitable.
From failed moves come fast moves, and oil/energy stocks failed an attempted breakdown below the neckline.
A few favorite long ideas: $LPI, $AMPY, $XLE, CL1 (futures), $XOM
Sector Winners and Losers week ending 9/17Energy (XLE) topped the sector list this week after the OPEC Monthly Report on Monday projected that demand for oil would exceed pre-pandemic levels by next year. The sector also got a boost from Crude Oil Inventories data released on Wednesday that showed much higher demand than expected.
Consumer Discretionary (XLY) moved into second place after great Retail Sales data on Thursday.
Utilities (XLU) and Materials (XLB) were the bottom two sectors for the week. Although markets were lower this week, investors did not flee to defensive sectors.

Sector Winners and Losers week ending 9/3Defensive sectors led the sector list during a week where employment data kept investors guessing on the Fed's timeline for bond tapering.
Real Estate (XLRE) led the list throughout the week. The sector is benefiting from low interest rates while it also remains a good hedge against inflation. The Fed continues to put full employment ahead of inflation as the priority for interest rate hikes, so the sector will continue to perform if labor recovery slows.
Health Care (XLV) was the second best sector, following by Consumer Staples (XLP) and Utilities (XLU).
The cyclical sectors ended the week lower with Financials (XLF) and Energy (XLE) sitting at the bottom of the sector list. The slowing labor market and missed PMI numbers this week showed some weakness in the economy.

XLE LongUpdate to previous XLE long. XLE following early reflation trade fractal in Q4 2020.
Invalidated without a clear bounce in coming weeks.

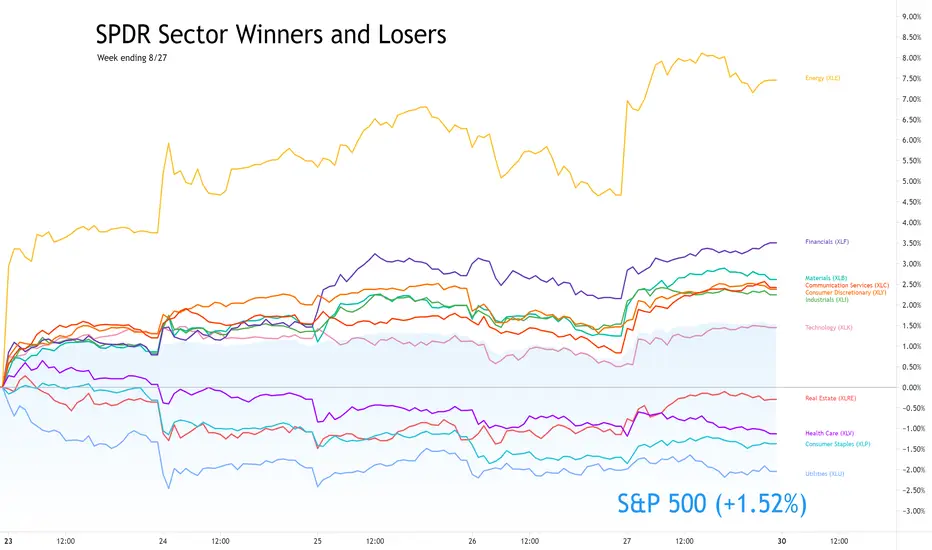
Sector Winners and Losers week ending 8/27A mix of growth and cyclical sectors topped the list this week. Defensive s all sectors declined for the week after topping the sector list last week.
Energy (XLE) held the lead among sectors for the entire week, despite a pullback on Thursday. The sector completely recovered from last week's decline and marked a higher high this week.
All of the cyclical and growth sectors had solid gains, with Financials (XLF) ending the week in second place. Technology (XLK) trailed the other gaining sectors, underperforming the overall S&P 500 but still finished with a +1.45% gain.
Utilities (XLU) was the worst-performing sector for the week as investors rotated out of defensive positions and back into bullish cyclical and growth positions.