Update on XLE: Uptrend test, TA signaling a correctionThe ETF's recovery is starting to show its first cracks as we have dropped from Yesterday's highs and closed without an attempt to buy the dip. Volumes were the around the average for the day and the fall could be mostly a result from long covering.
But there are some technicals that suggest we may return back inside the range. RSI and MACD have bearish crossovers and RIS is also below 50. MACD's histogram is going negative.
Current price is sitting on two major supports and today's price action will be an important one. This is an area for caution.
XLE

Sector Winners and Losers week ending 1/22Communications (XLC) led the week with a big +5.44% gain, but only after a big pullback the week prior. The sector was led by Alphabet (GOOGL) and Facebook (FB) with +9.55% and +9.21% gains respectively. Those two companies make up 44% of the ETF. Netflix (NFLX) also had a huge gain of +13.49% but only represents 5% of the ETF.
Technology (XLK) finished the week in second place, also with the mega-caps, Apple (AAPL) and Microsoft (MSFT) contributing the most to the gains.
Financials (XLF) continued to underperform as more financial institutions reported earnings and disappointed investors.
Energy (XLE) was the worst performing sector of the week. There is probably some influence from the new administration policies. However, the more immediate impact was from surprise surplus in oil supplies, signaling much lower demand for oil than anticipated.
The only significant pivots during the week were on Wednesday, January 20th which was inauguration day. That day saw a spike in Communications, Technology and Real Estate (XLRE).
The pivot for Communications and Technology were likely reinvestment into mega-caps that didn't seem to be in the crosshairs of any new policies, alleviating some fears of policies that would hurt big tech.
The Real Estate pivot was driven by the additional assistance for renters proposed in the new stimulus package. The stimulus approved in December only covered the estimated amount of back rent owed, but the new stimulus package would extend rental assistance into the future.

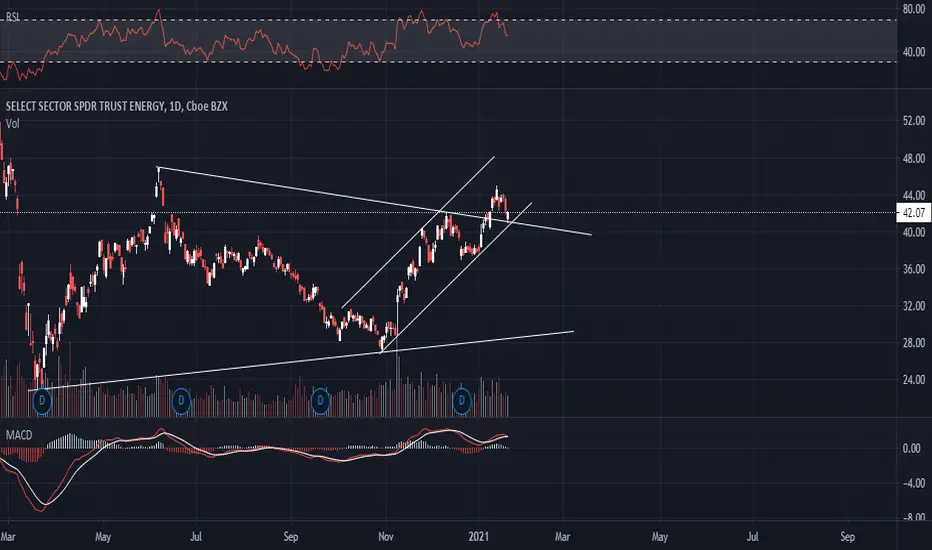
Update on XLE: Potential continuation of the uptrendTaking a look back at XLE we can see that the ETF has returned to test the area of breach of the symmetrical triangle (or the current support of the descending trend line). Pick up in volume shows that the activity has risen and market participants are getting excited. A breach was made a classical follow-up test was made. Currently, we are sitting at the support and overall there was no attempt in Yesterday's market session to push below it. The dip was bought and XLE closed firmly with a fresh high for the day. Even though here RSI and MACD are laying out the perspectives for a deeper correction it may be "skipped". Recovery in energy assets may pull up the ETF away from the support for the uptrend to continue.
My personal view is that trend will continue and XLE will rise, but it won't be wise not to forecast a negative scenario as well.
The outlook will shift to negative if we see a strong push back inside the triangle. Fundamentals are still shaky with the COVID-19 pandemic still raging. This may raise the question of additional lockdowns or stopping global flights again, which will hit oil and energy prices overall.
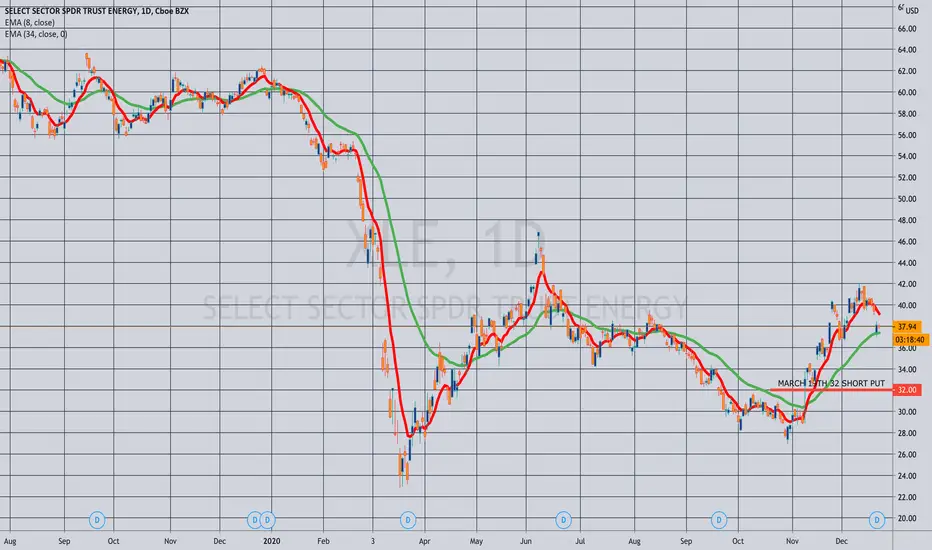
OPENING (IRA): XLE MARCH 19TH 32 SHORT PUT... for a .78/contract credit.
Notes: Continuing to build 2021 positions ... . Have some on in the February cycle, so going out to March with 30-day implied at 40.1%, expiry-specific at 41.3%. 2.47% ROC at max as a function of notional risk.
OPENING (IRA): XLE FEBRUARY 19TH 34 SHORT PUT... for a .71/contract credit.
Notes: Highest background implied on my exchange-traded fund board with 30-day at 40.2%, expiry-specific at 41.6%. I've already got some January stuck out there, so am basically laddering out a smidge by selling the 16 delta out in the February monthly. ROC: 2.13% as a function of notional risk at max; 10.65% annualized at max.

XLE (US energy sector) 10% correctionAwaiting 10% correction to complete wave B of ABC(uptrend correction)
Very similar to SPY (SNP500)

THE WEEK AHEAD: HAL, NFLX, AA, UAL EARNINGS; EWZ, XLE, SLV, IWMHIGHLY LIQUID OPTIONS SINGLE NAME EARNINGS (LISTED CHRONOLOGICALLY IN ORDER OF ANNOUNCEMENT AND SCREENED FOR >50% 30-DAY IMPLIED):
HAL (13/61/13.9%),* Tuesday, before market open
NFLX (25/50/11.3%), Tuesday, after market close
AA (18/69/15.9%), Wednesday, after market close
UAL (13/64/14.8%), Wednesday, after market close
From a bang for your buck perspective: AA ranks first, UAL, second, followed by NFLX, and HAL.
I already have a covered strangle on in UAL and don't anticipate putting on more single name risk in the IRA (which is my primary focus running into retirement), but will naturally post a play should I get into one.
EXCHANGE-TRADED FUNDS WITH >35% 30-DAY AND RANKED BY THE PERCENTAGE THE FEBRUARY AT-THE-MONEY SHORT STRADDLE IS PAYING AS A FUNCTION OF STOCK PRICE:
EWZ (18/45/10.3%)
XLE (23/42/9.7%)
SLV (25/42/9.4%)
GDX (12/38/9.2%)
XBI (18/37/8.7%)
KRE (16/36/8.7%)
EWW (15/36/7.5%)
I'm already in everything here but for KRE and EWW (the lowest bangs for your buck on the list) and the February monthly is a bit short in duration here for me (34 days) and March a tad long (62 days), so I may not do much this week in these, although going out to March with another rung in my GDX, SLV, and XBI positions isn't out of the question.
BROAD MARKET RANKED BY 30-DAY IMPLIED:
IWM (24/32/6.8%)
QQQ (22/30/6.4%)
SPY (16/24/4.8%)
DIA (13/23/4.6%)
EFA (14/20/3.8%)
In spite of the fact that IWM and/or RUT have the higher 30-day, I may look at adding a July (181 days) rung to the SPY short put ladder I have on in the IRA, targeting the strike paying at least 1% of the strike price in credit (which would currently be something like the 240), and do the kind of "opportunistic rolling" I've been doing with shorter duration rungs. (See Post Below). Although most frown upon going out this far in time, it's a way to deploy otherwise underutilized buying power that will earn something >0% while I work shorter duration setups or wait for a higher implied volatility environment and/or greater weakness. Additionally, my goals for the IRA are somewhat modest from a return on capital standpoint: I'm not looking to hit homers or be an incredibly attentive investor, opting for a once a week or even a once a month schedule of looking at things, making adjustments as appropriate, and/or taking off stuff approaching worthless that doesn't merit hanging onto due to the amount of time left in the contract.
* -- The first metric is the implied volatility rank or percentile (i.e., where the 30-day is relative to where it's been over the last 52 weeks); the second, thirty day implied; and the third, the percentage the at-the-money short straddle in the February monthly is paying as a function of stock price.

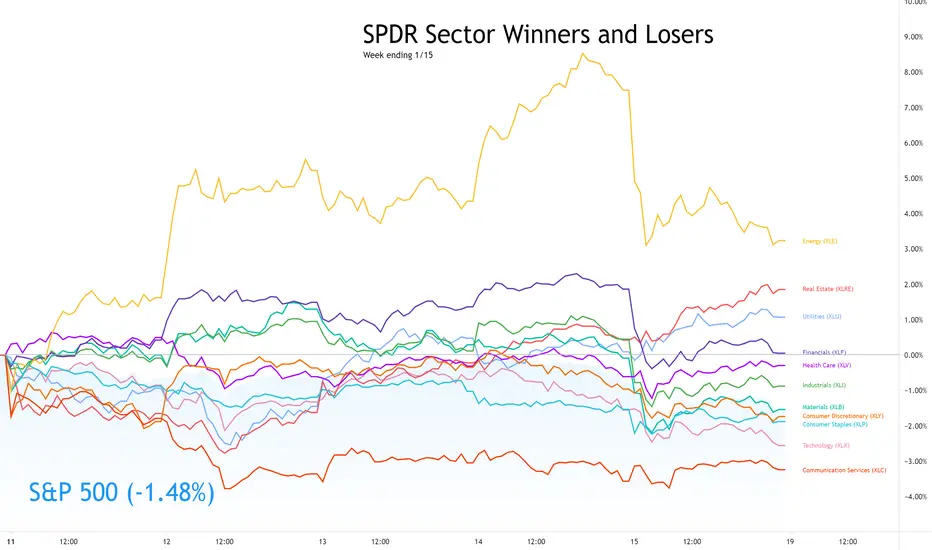
Sector Winners and Losers week ending 1/15The sectors had a wild race this week with the backdrop of a up and down market with several rotations between small caps, mid caps and large caps.
Energy (XLE) would ultimately be the winner, supported by production cuts in Saudi Arabia, higher than expected demand for oil, and some positive news from OPEC. There was a significant pullback on Friday after SEC announced an investigation into Exxon Mobile (XOM) which makes up 23% of the XLE ETF.
Financials (XLF) led must of the week as investors expect higher treasury yields boost performance for big banks. That turned upside down on Friday when Citigroup (C) and Wells Fargo (WFC) disappointed on revenue despite beating expectations on earnings.
It was Real Estate (XLRE) and Utilities (XLU) that started to climb on Tuesday and were top performers on Friday. Those two sectors are defensive plays for equity investors. Both are expected to suffer less from market pullbacks.
Materials (XLB) and Industrials (XLI) were also doing well earlier in the week, but pulled back on Friday. It could be that the nearly $2 trillion of stimulus promised by President-elect Biden is seen as a delay to the expected investments in infrastructure. Just a theory.
Technology (XLK) and Communications (XLC) were at the bottom. The big tech mega-caps went up and down in price all week as money moved in and out of the segment. Communications, which includes companies like Facebook (FB) and Twitter (TWTR) suffered the most as investors fear negative impact of recent actions related to Donald Trump.


The next resistance zone in XLE is...Check out the weekly chart of XLE with a potential resistance zone to focus on in the coming weeks/months

Revisiting XLE and the recovery of the energy sectorUpdate from a previous post: XLE developing nicely as the price has managed the get out of the range and yesterday we opened with a gap and there almost no attempt to push the price down and to fill the small gap. MACD's crossing is widening and the histogram is expanding as well. RSI moving to the overbought zone, but there is some more room for additional movement North before any correction. The energy sector is starting to recover more and more and demand for the ETF is rising as well. Volumes support the recent movement. My short-term target is $47.

THE WEEK AHEAD: KBH, DAL, ICLN, SLV, EWZ, KRE, XLE, IWM/RUTEARNINGS:
There aren't a ton of earnings next week. Some financials are announcing, but I generally don't play those a ton for volatility contraction, since they never really frisk up that much, and all are below 50% 30-day implied here. KBH provides the best bang for your buck with the implied metrics I'm generally looking for (>50%), followed by DAL. Both, however, are at the low end of their 52-week range, in part due to the massive vol spike we experienced in March, which will make that metric somewhat misleading here.
KBH (18/56/14.5%),* Tuesday after market close.
DAL (7/53/12.9%), Wednesday before market open.
C (17/44/9.8%), Friday before market open.
JPM (14/32/7.8%), Friday before market open.
WFC (22/44/10.6%), Friday before market open.
EXCHANGE-TRADED FUNDS RANKED BY PERCENTAGE THE FEBRUARY 19TH AT-THE-MONEY SHORT STRADDLE IS PAYING AS A FUNCTION OF STOCK PRICE:
ICLN (14/79/20.0%)
SLV (31/48/11.3%)
EWZ (16/44/10.6%)
XLE (22/41/10.2%)
KRE (17/42/9.9%)
BROAD MARKET:
Pictured here is an IWM short put out in March at the strike paying at least 1% of the strike in credit. An IRA trade, I would look to roll up intraexpiry to lock in realized gain with >45 days 'til expiry, take profit on approaching worthless (<.20), and sell call against if assigned. Currently 67 days 'til expiry, it is understandably a bit long in duration, but I already have some on in the February monthly.
IWM (26/34/7.6%)
QQQ (21/31/6.9%)
DIA (14/24/5.2%)
SPY (11/24/5.0%)
EFA (14/21/4.7%)
* -- The first metric is the implied volatility rank or percentile (i.e., where implied is relative to where it's been over the past 52 weeks); the second, the 30-day implied volatility; and the third, what the at-the-money short straddle is paying as a function of the stock price.

Sector Winners and Losers week ending 1/8Energy (XLE) finds itself back at the top of the sector list for the first week of 2021. It's not something you might expect as the blue wave hit US politics, which doesn't bode well for traditional energy stocks. However, crude oil is over $50 a barrel for the first time since April after Saudi Arabia surprisingly cut output.
The blue wave did have some expected impact this week. After the Georgia run-off results showed Democrats would take control of the senate, US Treasury Bond yields took off as investors expect more stimulus that would further impact the US Dollar. That caused Financials (XLF), especially big banks, to have big gains on Wednesday and Thursday.
Materials (XLB) benefited from the blue wave news, as we can expect big investments in US infrastructure with the new administration.
Industrials (XLI) also had a boost on Wednesday, with some benefit from infrastructure spend, but also several segments like airlines likely to benefit from further stimulus. However, Industrials did not continue the rise and ended the week behind the S&P 500.
Consumer Discretionary (XLY) got a boost on Friday, perhaps from higher than expected Consumer credit numbers on top of the promise of new stimulus. Quite a few people had a good Christmas it seems.
At the bottom of the list is Real Estate (XLRE) which is likely to suffer in the bottom line from the higher interest rates.
Technology (XLK) had the opposite reaction to the blue wave on Wednesday but regained from losses on Thursday and Friday to end the week just behind Industrials.
Also notable is Utilities (XLU) which lost for the week, but had gains on Friday as a defensive move heading into a likely emotion filled weekend for the United States.

The revival of Energy - XLE on the riseXLE has been in a range for quite some time with the fall of Oil price from the first lockdown. But as thing recover and demand for Oil is returning to somewhat normal levels, the ETF is starting to give signs of life as well.
RSI well above 50 and is moving slowly into overbought territory, but this means that there is more room for the price to rise.
MACD has made a crossover and the histogram is turning positive.
Resistance level circa 40 has been breached.

Sector Winners and Losers for 1/5 and 1/6I normally publish this chart on weekly basis as part of my Week in Review work but I thought it was interesting to look at it today, in the context of the Georgia run-off election results. There is also the turmoil in DC, but that did not seem to impact the sector leaders list (the afternoon dip impacted all equally).
Energy (XLE) is leading over the two days, although was in third place for Wednesday. This position is not related to politics, but rather that crude oil prices moved past $50 for the first time since February. A much smaller part of Energy is the solar stocks which will benefit greatly from a Democratic controlled congress and presidency. However, the solar stocks make up a small part of XLE and are not the reason for the sector performance.
Materials (XLB) is the next sector on the list. Materials sector will benefit greatly from expected spend on infrastructure in the US.
Financials (XLF) was the winner on Wednesday, as yields on treasury bonds rose, bringing higher interest rates that will benefit banks.
Industrials (XLI) got a boost from both the outlook for infrastructure spend, but also the promise of more stimulus that would easily pass through congress and signed by the president.
The sectors that did not fair well with the news included Communication Services (XLC) and Technology (XLK) which both include "big tech" names that are likely to take a hit from higher bond yields. Similarly Real Estate (XLRE) will incur higher costs due to the higher interest rates.

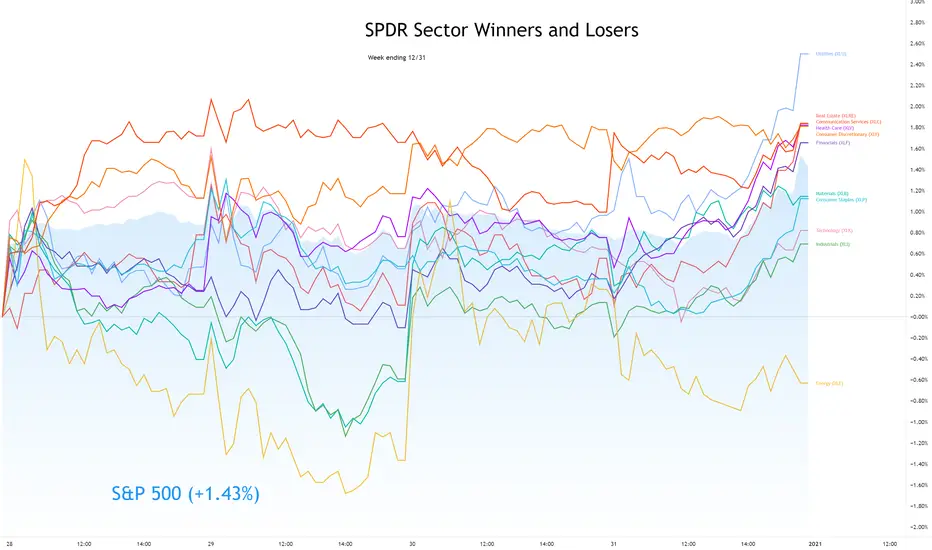
Sector Winners and Losers week ending 12/31Communications (XLC) and Consumer Discretionary (XLY) spent about half the week each at the top of the sector list.
But it was Utilities (XLU) that would rise at the end of the week as the winner. No doubt a defensive play going into the long weekend and a turn of the clock to a new year.
Energy (XLE) had a very short-lived time at that top on Monday morning, but ended the week as the worst performing sector. Energy was the only sector to end the week with a loss.
XLE: Divergence->left turn->slow burn uphill?-ST divergence in the fall- confirmation of trend change to at the VERY least follow the boring, ascending slowly yellow floor???????
-test of yellow trend again->slow burn
-bounce off 50% gap followed by BO, Retest, Resumption of Red
-BO-R-R off green, up to fill the gap from the crash and 83
-insolvency crisis in 21 to bring it back down yellow?
-gunna watch this one, oil is going no where

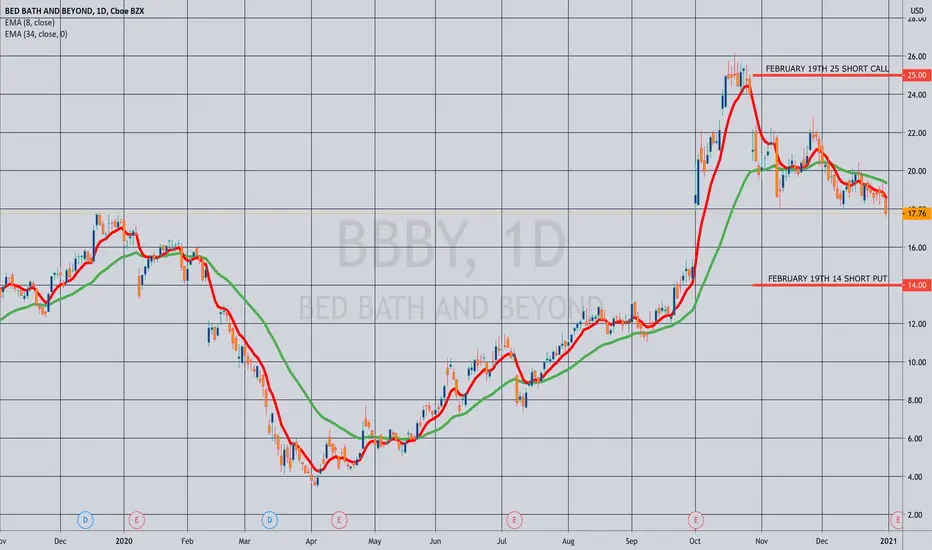
THE WEEK AHEAD: BBBY, MU EARNINGS; ICLN, SLV, XLE, IWM/RUTEARNINGS:
I've culled down all of next week's earnings announcements to options highly liquid underlyings where the 30-day is >50% and am left with two potential candidates for volatility contraction plays: BBBY (23/99/26.3%)* and MU (23/53/14.0%).
BBBY announces on Thursday before market open, so look to put on a play in the waning hours of Wednesdays session; MU, announces on Thursday after market close.
Pictured here is a delta neutral short strangle in the February cycle (49 days), which was paying 1.27 at the mid price as of Friday close with break evens wide of two times the expected move on the call side and slightly above the 2x on the put and delta/theta of -1.07/3.12. Naturally, you can see the call side skew here, with the similarly-delta'd short put 3.76 away from current price, but the call 7.24 away, so the underlying may merit a look at alternative plays that take advantage of this.
In contrast, the shorter duration January 15th 15/22.5 (14 days) was paying 1.02, with delta/theta metrics of .21/7.91, with the natural trade-off's being less room to be wrong, but a quicker resolution of the trade should you be right.
With MU, I'd look at a Plain Jane 2x expected move short strangle, which here would be the January 15th 68.5/85, paying 1.71 or the February 19th 62.5/90, paying 2.30.
EXCHANGE-TRADED FUNDS RANKED BY PERCENTAGE THE FEBRUARY 19TH AT-THE-MONEY SHORT STRADDLE PAYS AS A FUNCTION OF STOCK PRICE:
ICLN (9/51/15.0%)
SLV (33/48/13.6%)
XLE (23/41/11.4%)
XBI (27/39/11.2%)
EWZ (14/39/11.1%)
GDX (15/38/11.1%)
XME (14/38/10.7%)
BROAD MARKET:
IWM (25/31/8.1%)
QQQ (19/27/7.1%)
SPY (15/22/5.4%)
EFA (20/21/5.2%)
BOND FUNDS:
TLT (16/18/4.4%) (Yield: 1.609%)
HYG (7/13/2.0%) (Yield: 4.917%)
EMB (4/7/2.0%) (Yield: 4.024%)
AGG (28/8/1.7%) (Yield: 2.252%)
* -- The first number is the implied volatility rank or percentile (i.e., where 30-day implied is relative to where it's been over the last 52 weeks); the second, 30-day implied; and the third, what the February 19th at-the-money short straddle is paying as a function of stock price.
Short Energy sector 🛢️ - Swingtrade, high Risk/Reward trade If you like the idea, do not forget to support with a 👍 like and follow or comment.
Leave a comment that is helpful or encouraging. Let's master the markets together.
Hi fellows, just one of my today swingrades:
As you can see ERY bottomed out and forming a bull flag pattern.Rising bull momentum is there clearly represent by divergence on Momentum and CCI indicators. Today will be good opportunity to get in.
------------------------Trade setup ---------------------------
Entry: 34.34
Stop Loss: 32.75
Profit target: 39.76
Time stop: 5 days
------------------------------------------------------------------

OPENING (IRA): XLE JANUARY 15TH 32 SHORT PUT ... for a .51/contract credit.
Notes: The exchange-traded fund with the highest implied 30-day on my board. 1.6% ROC at max; 13.0% annualized. Will add "rungs" in subsequent cycles (i.e., Jan/Feb/March) if implied hangs in there.

Sector Winners and Losers week ending 12/25The short trading week was not without its excitement.
Financials (XLF) was the big winner of the week. The fed stress test last week resulted in banks being allowed to resume share buy bank programs, giving some tailwinds to the sector.
Technology (XLK) took the lead on Tuesday, but fell back into second place at the open on Wednesday.
All other sectors underperformed the S&P 500 for the week.
Energy (XLE) was the leading sector for Wednesday's session but was the worst performing sector on the other days, coming in last for the week.
