Sector Winners and Losers week ending 10/23This week it was all about Communication Services (XLC) with the positive earnings beat from Snap (SNAP) driving growth in many of the social platform company stock prices.
Utilities (XLU) continues to be a safe bet for investors as a sector that is consistently performing well over the past few weeks.
Financials (XLF) also had a great week as bond yields are increasing which is usually a good sign for performance of banking stocks.
Consumer Discretionary (XLY) started the week on top but backed off a bit before coming back with some good gains on Friday.
Energy (XLE) had a huge Thursday that put it at the top of the the sectors, but it could not hold the lead, backing off a bit on Friday.
It's not often that we find Technology (XLK) at the bottom of the list for weekly sector performance. Keep an eye on it as many technology companies will have earnings in the next two weeks.
XLE

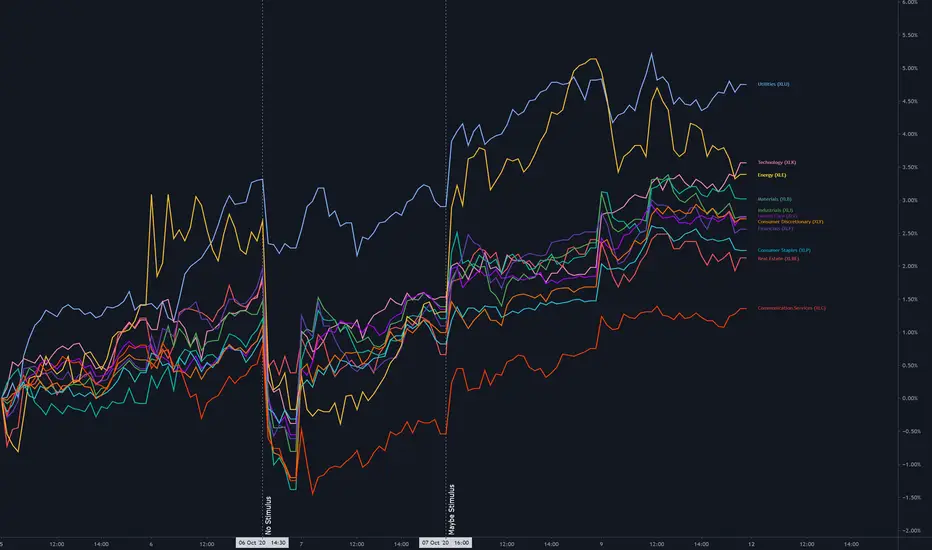
Sector Winners and Losers week ending 10/9Utilities (XLU) was the steady winner throughout the week, even during the pullback caused by fears of no stimulus deal being reached. For money that wants to stay in equities in lieu of low interest rates and uncertain inflation, utilities is seen as the safest sector. So even as stimulus fears mounted, XLU continued to stay strong compared to the S&P 500.
Energy (XLE) also had a great week with a big one day gain of 3.75% on Thursday thanks to stability in crude oil prices and analyst projections of strong demand for at least two decades. XLE growth still lags far behind recent gains in crude oil futures. It will take some time to burn off over supply and the tech bubble continues to weigh down this sector (redux of 2000 energy story).
However, Technology (XLK) rallied on Friday to take over the second place spot. Advance/Decline lines showing great breadth as big tech shares the love with their smaller siblings.
Communications (XLC) was the week's loser, with Facebook (FB) having the most weight in the index. FB did not have a great week, possibly impacted by political focus on the platform.
Oil and Energy Markets finding a Perfect Storm?It wasn't market makers who named the latest U.S. Hurricane "Delta," but they probably would have suggested the same name if anyone asked them. With the storm about to hit the gulf shores in the U.S. causing lockdowns in oil and gas facilities in the region, supplies of oil and natural gas are both constrained. This comes right at time when demand is increasing in the U.S. economy, and buyers are returning to the market. It could be a perfect storm for the Energy sector AMEX:XLE in U.S. stocks, and for commodity currencies such as the Aussie FX:AUDUSD , Loonie FX:USDCAD , and Pound FX:GBPUSD .

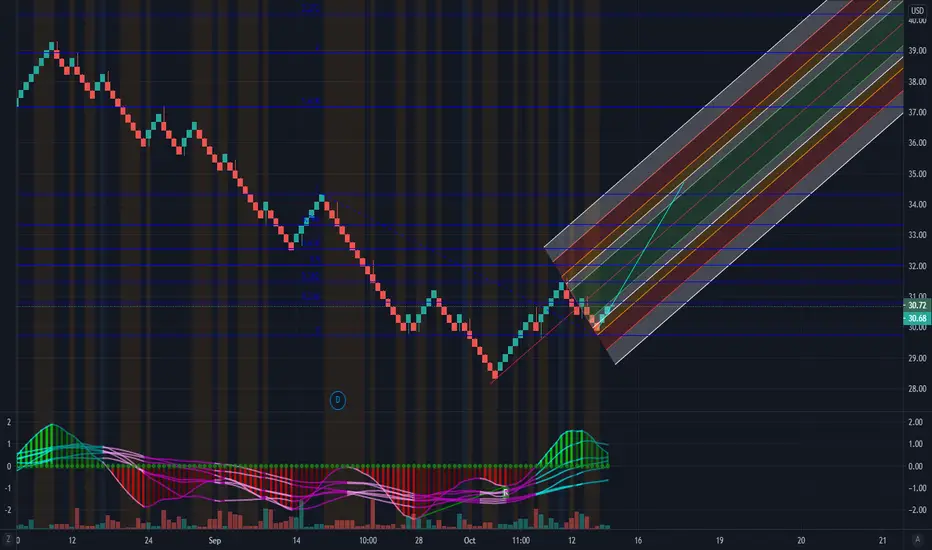
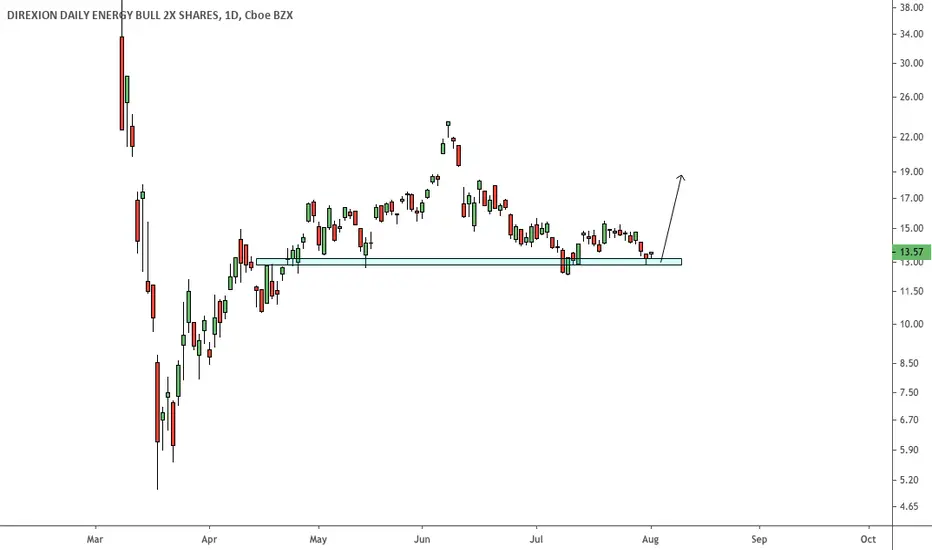
XLE break to the upside. Target 31.50Plotting the XLE index with 4 hour candles, we observe a clear downward tendency since mid August. However, the 20 MA suggests a bottom at around 29.75, with the price closing above the MA for the last 8 candles (roughly 4 days). If the price can close above 31.50 tomorrow, we are bullish towards 32.50 as our first objetive.

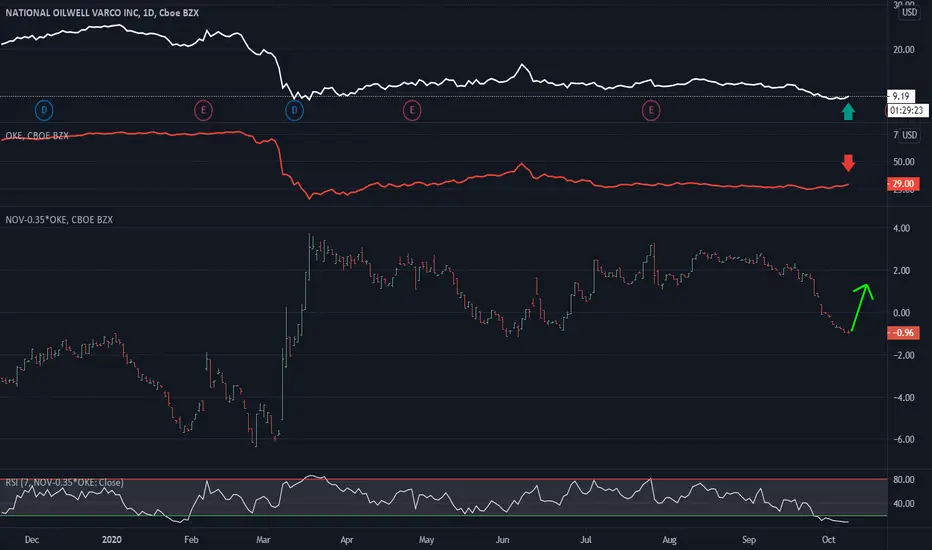
NOV-0.35*OKE $OKE (Oneok Inc) vs. $NOV (National-Oilwell) Quantamental Tools for Proprietary and Retail Investors.
Statistical Arbitrage Opportunities Delivered to Your Inbox.
QuantChart. io
Long 100 $NOV
Short 35 $OKE
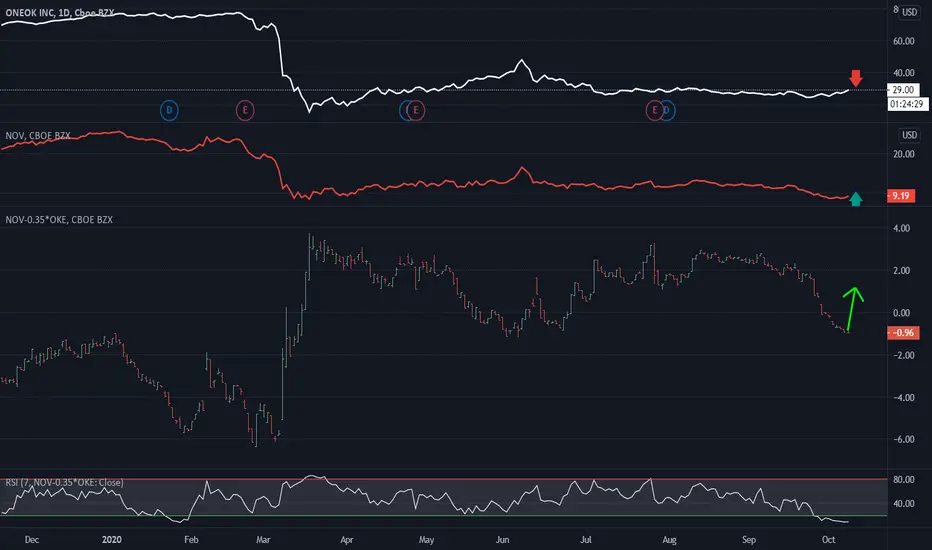
NOV-0.35*OKE $NOV (National-Oilwell) vs. $OKE (Oneok Inc)Quantamental Tools for Proprietary and Retail Investors.
Statistical Arbitrage Opportunities Delivered to Your Inbox.
QuantChart. io
Long 100 $NOV
Short 35 $OKE
Energy and Financials Adding To SPX Strength In ATH RunSPX with a key back test of the 3389 level overnight as it's trying to break up over the 3411 level. If it can over 3411 it should trigger a test of the key 3425 level. This is a key level from our double top back in September.
SPX is opening stronger than NAS and this is mainly because of energy and financials. If energy and financials are able to join this rally, SPX will run to ATH's and beyond. October is shaping up to be a very bullish month with the potential for a very large rally.

Sector Winners and Losers week ending 10/2It was a back and forth race for the SPDR ETFs this past week. In the end, Real Estate (XLRE) was the winner.
Utilities (XLU) had a week of steady growth but could quite beat out Real Estate.
Technology (XLK) did well earlier in the week but sold off at the end on bad news.
Energy (XLE) had relatively big gains on Friday, but overall still a loser for the week.

OPENING (IRA): XLE NOVEMBER/DECEMBER/JANUARY 26/27/28 SHORT PUT... ladder for a total of 2.17 in credit.
Notes: 30-day implied at 39.47% with expiry-specific implied at 43.4%, 42.9%, and 43.4% for November, December, and January, respectively. Current yield of 6.71%, so am fine with taking on shares and covering or just keeping the premium.

Sector Winners and Losers week ending 9/25Here are the sector winners and losers for this week. XLK (Technology) was up and down as it took the Nasdaq for quite a ride. XLF (Finance) was down from the beginning of the week due to news of suspicious transfers not being blocked by large international banks. XLE (Energy) continues to be a loser despite the increase in crude oil prices. Good to keep an eye on that.

Good opportunity to short XLE on this recent popXLE looks extremely bearish. Might be a good idea to sell some call credit spreads to benefit from the last pop and ride it more to the downside.

Price of Oil rising while XLE fallsFutures on crude oil is increasing while XLE is flat or declining. The gap is widening. Bottom indicator is taking the 100 day % change of each and comparing.
How much does XLE need to move to catch up?
Is the tech bubble holding XLE down?
How resilient would XLE be against the market further correcting?

Market Rotation Into Energy (XLE) The past week there was rotation into Energy (XLE). There is precedent for rotations into energy marking tops and continuing as safe havens during corrections.
In the bottom chart, you see the rotation happening in September 2018, just before three months of market declines (21% on S%P 500 and 24% for Nasdaq).
Looking back further to the 2000 tech bubble, look at stocks like CVX, XOM and SLB. These stocks are going up or sideways while the market is crashing around them.
On the other hand, 2018 these stocks fell along with the market.
So the question is are we in a correction?
If so, is it more like 2000 or 2018?
Have energy stocks been held down while the tech bubble grew?
Will we see energy stocks climb over the next few months?


LONG XLE Nice long here. XLE broke (purple) triangle bearish but saw no follow through as it got bid up from 35.30 support on 08/27. Huge support between 34.26 & 35.30 with 34.88 being the 50% retracement of Covid low to high of Covid bounce. This support area has held since early May and should continue to hold unless we see a significant sell off in the broader markets. Falling wedge (yellow) coinciding with this support also. Could really see an explosive move here, and accompanied with a hard 34.30 stop Risk/Reward is highly favorable.


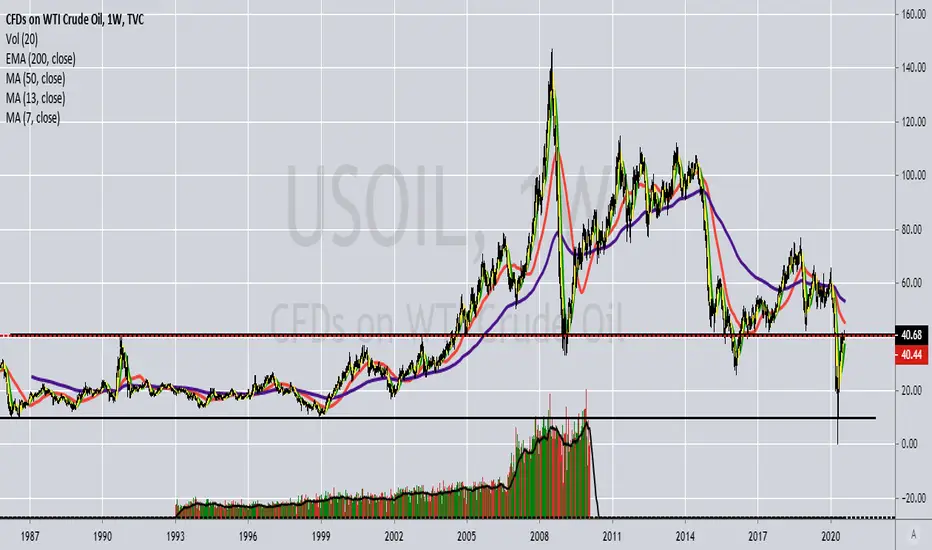
WTI at pivotal level, key moment for the market Technically, CL2! is at crucial level as it is challenging a key resistance area, corresponding to 2018 lows. A breach above this resistance could have major bullish implications for oil prices and for the weak energy sector (XLE), over the coming months. Significant increase in oil prices could be seen as inflationary, pushing yield to the upside and increasing value stock appetite. On the other end, a failure to surpass those levels would call for the continuation of the underperformance of the energy compartment. We are at crucial levels. Stay tuned.


$USOoil is back near it's 1987, 2000 and 2003 highs and being rejected by it's 2015 multilows and 2008 low. may just range for years now between 50 and 15 $XLE $XOP
Tech vs. (Financials & Energy)Is it Growth versus Value or Tech versus Financials and Energy
EW Tech vs. (EW Financials + EW Energy)
Divergences from Growth vs. Value have been notable in the past

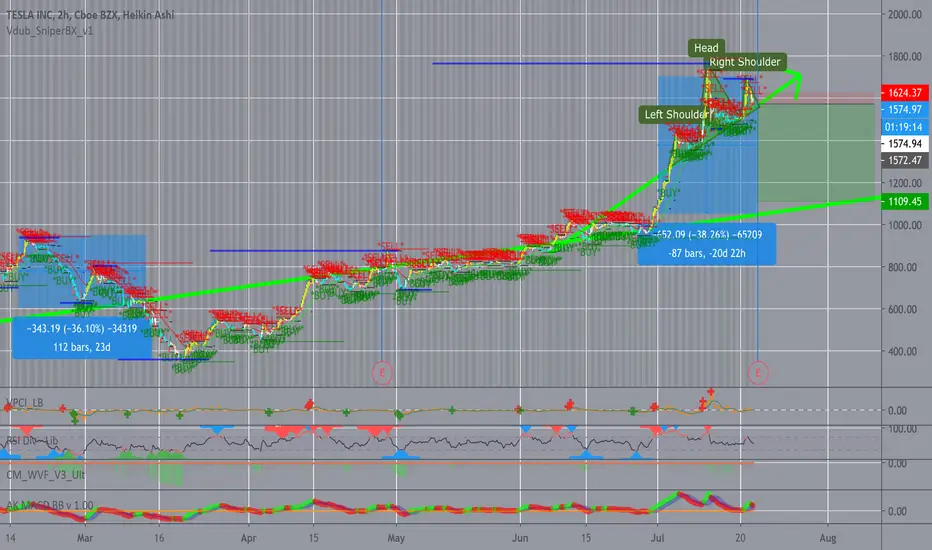
TSLA Short! Target: $1000 - $1200 NASDAQ:TSLA
It seems pretty clear based on valuation standards that many tech companies are significantly overbought. Over the past two weeks there has been significant capital outflow from the technology sector while there has simultaneously been large capital inflow into commodity markets, especially oil and natural gas.
Head and shoulders pattern forming on the 2hr and 4hr charts. Looks like a great short set up to return to the longer-term price trend.
I'm not a TSLA hater, I like Elon Musk, but I think this is a great short set up. Just an idea, do your own research!