XLE
THE END of the FOSSIL FUEL AGE?[MULTI-FACTOR Simple Crude Guide]Brief analysis on crude in 3 bullet points(chart will be updated continuously) ; Series on Commodities - 21st of November
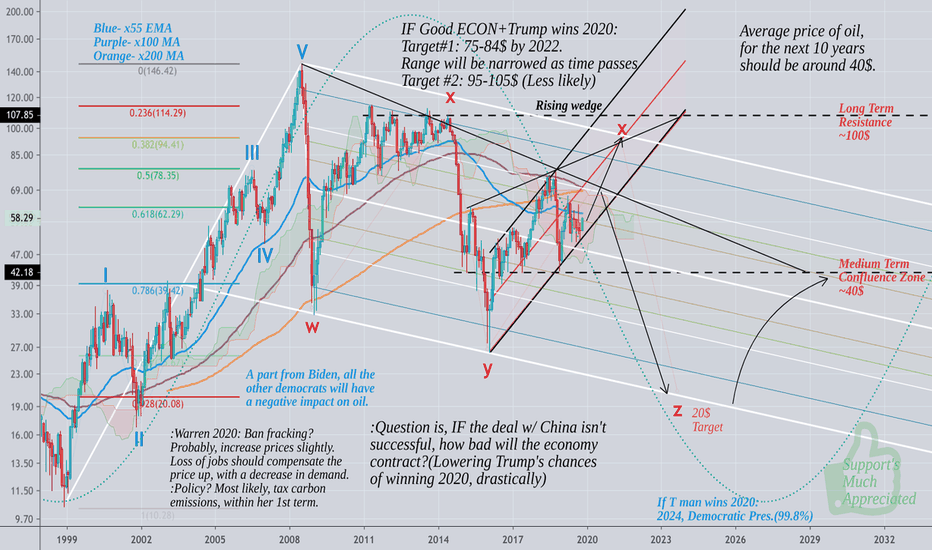
I do realize most people trade oil on daily frames. Oil prices heavily impact global growth, and this is the primary purpose of this chart. It's a necessity and it's essential to know the macro trend, even in trading. Before I get into the chart technicals, these are the few fundamental bullet points analysing demand and price action for the next 10 years:
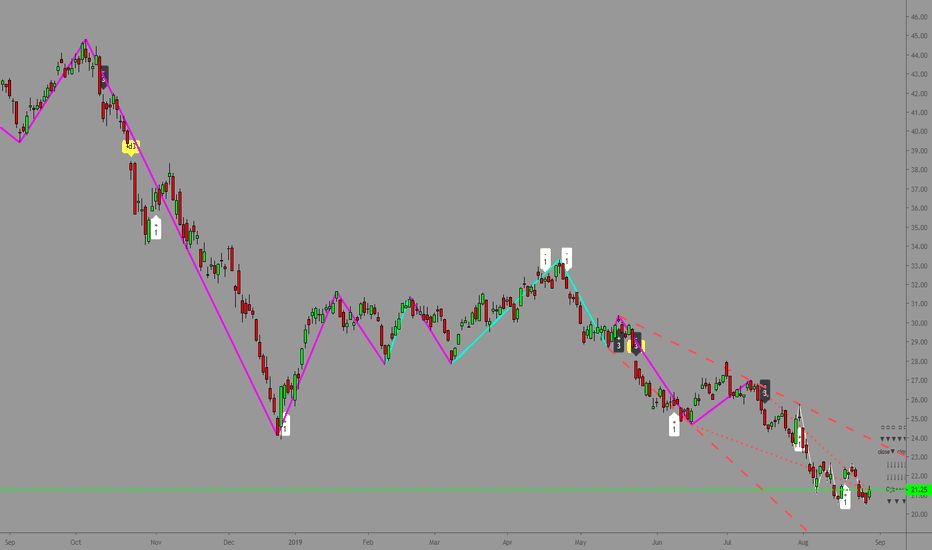
1. Crude is expected to have an average drop of approximately 10% annually in demand going forward to 2025 (by multiple sources). This is nothing unexpected. Demand from emerging economies is still growing (India), however, more and more economies that are currently heavily dependant on crude are looking for alternatives (China). Overall, this should have quite a negative effect on crude . This can easily be seen by the performance of the whole energy sector(XLE):
2. Currently we are in the late cycle (Ref #1, Fed rates analysis) , and since the demand for oil is heavily cyclical, I am expecting that based on these current economic conditions- the global economy should linger until the 2020 elections, before something major occurs(arrows guidance on the chart). This is my investing tree for oil for the next 5 years for oil : ibb.co Geopolitical risks are included in the chart.
3. In terms of the supply, OPEC is certainly weakening. This implies that these countries have an incentive to push supply even further, i.e 2014. Moreover, crude production in the US has doubled. On the other hand, the rise of renewables as one of the outcomes of the last recession has been exponential. Nevertheless, we'll get to a point when lithium will certainly become too expensive . That's just how cycles work. My hope is that as the outcome of the next cyclical downturn, we will start focusing on nuclear energy, and develop safe and cost effective models (referencing small modular reactors here-SMR's) . Additionally, further enhancing the efficiency and use of other biofuels should be a must.
To wrap up this oil investing guidance, it should be quite simply, since oil's correlation to the cycle historically is extremely high(depending on the cycle ~70%). There's evidence this has somewhat changed recently, perhaps because of the rise of renewables. The ESG trend should continue to grow exponentially . Nevertheless, oil consumption will never completely phase-out. The technical side of the chart is well labelled, it should follow the pitchfork, this is one of the better ones I've drawn so far. We are currently in a rising wedge, the outcome of the 2020 election should give a clue of the direction we're going. Currently it's neutral, leaning bullish. For the past 120 years, oil prices have behaved in ~29 year cycles, which would give us the bottom of the cycle at around ~2025.
-Step_ahead_ofthemarket-
________________________________________________________________________________________
>>I do not share my ideas for the likes or the views. This channel is only dedicated to well informed research and other noteworthy and interesting market stories.>>
However, if you'd like to support me and get informed in the greatest of details, every thumbs up and follow is greatly appreciated !
References and Disclosure
1. FED rates Supercycle :
Disclosure : This is just an opinion, you decide what to do with your own money. For any further references or use of my content for private or corporate purposes- contact me through any of my social media channels.
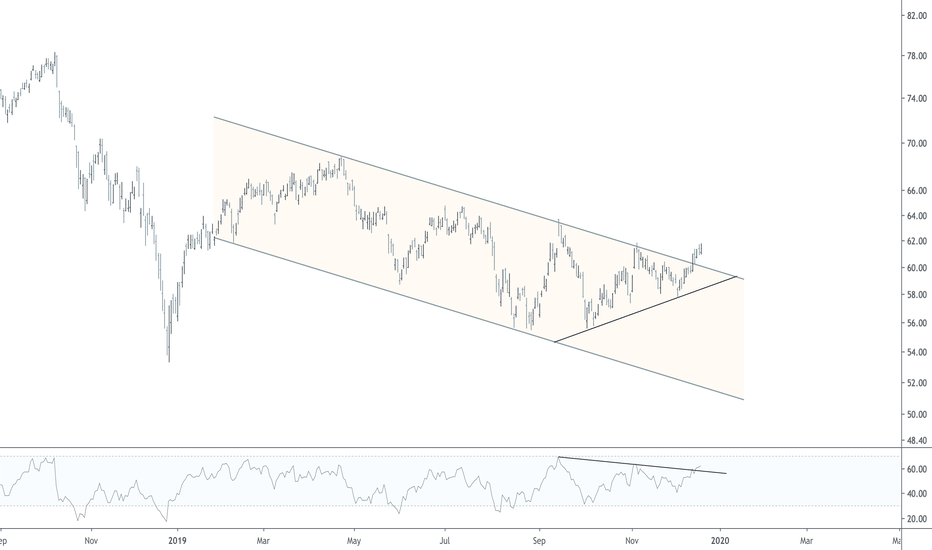
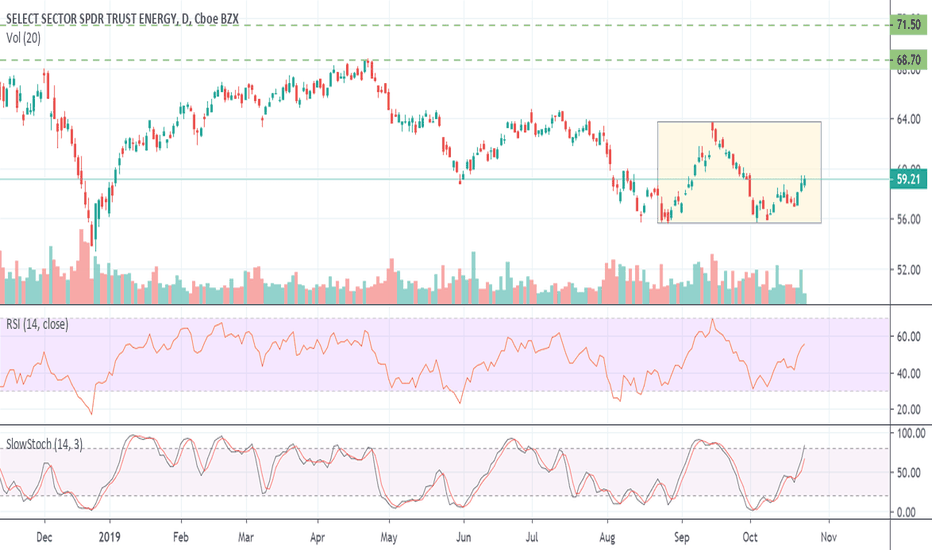
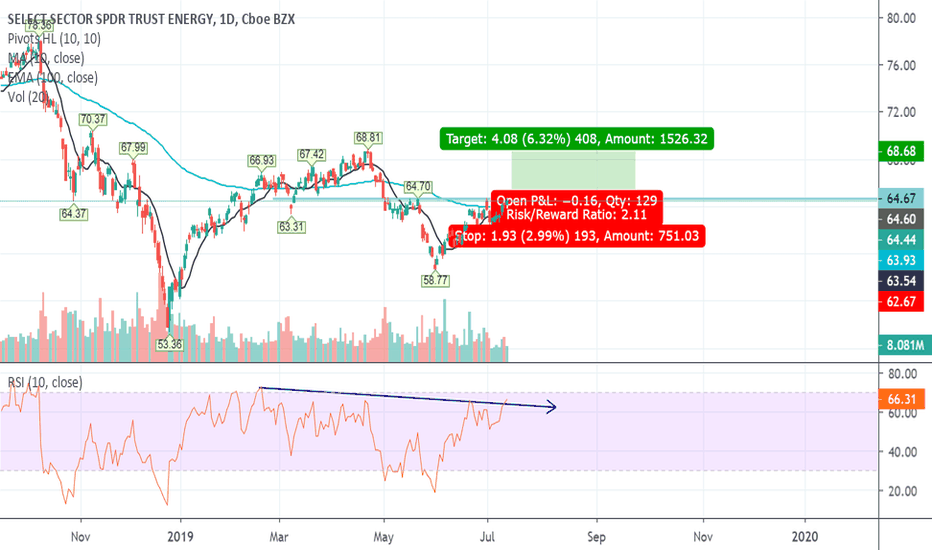
XLE - Just a boost of energyThere is a double bottom pattern dating back to late August. Energy has been the laggard YTD & is the only sector in the red over the last year. This may be the beginning of the sector finding some strength.
If you take the Fibonacci 161.8% extension that gets you to a target of $68.79. The actual pattern breakout price target would be $71.60.
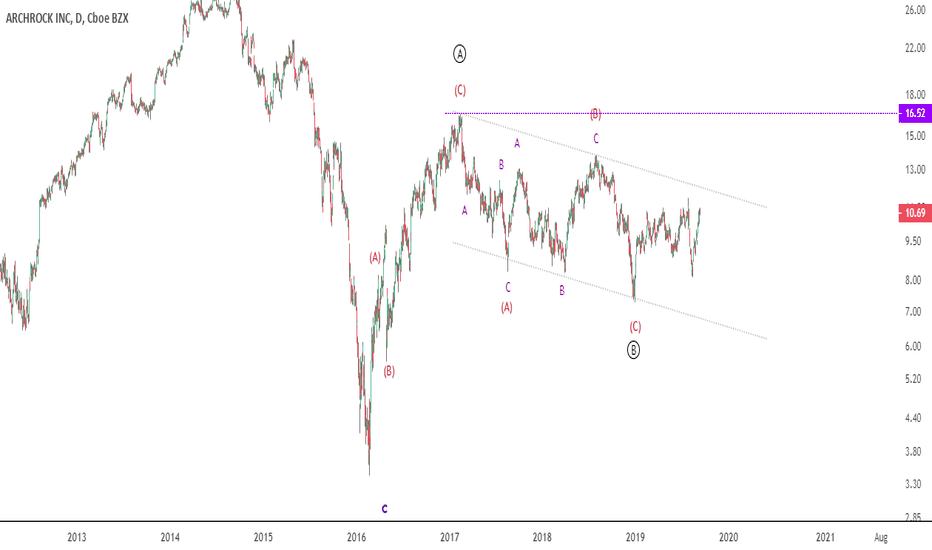
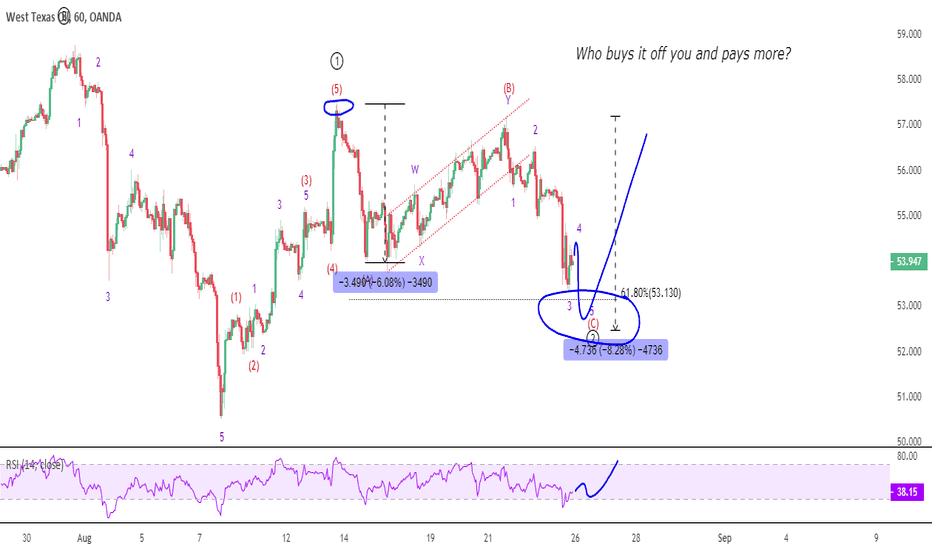
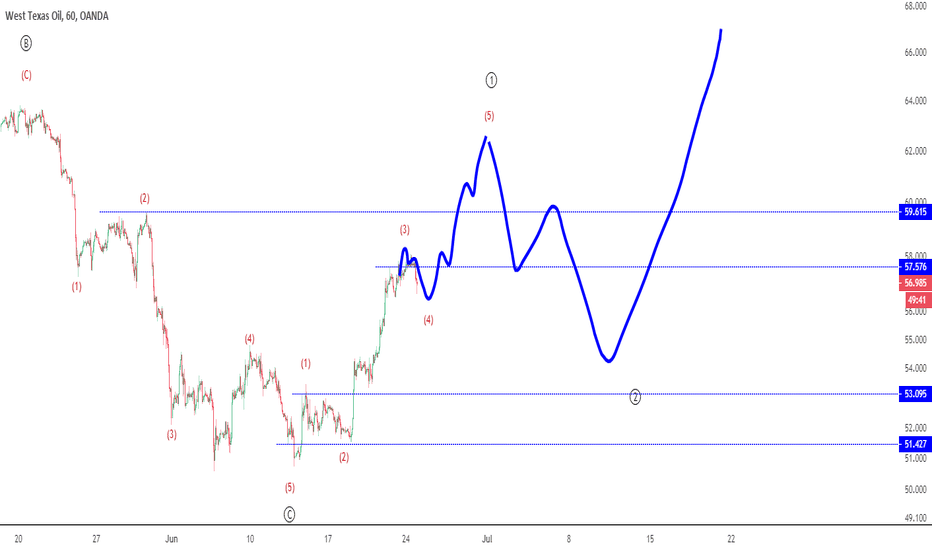
Part 3: Using Elliott Wave to time a position (AROC Long)The final part of the puzzle is overlaying a chart pattern that lines up with your fundamental view. Once all ducks are in a row (Macro, Economic, Bottom-Up analysis) we can look to Elliott Wave to help us to enter a trade at a low-risk entry point and take advantage of a high probability trade opportunity.
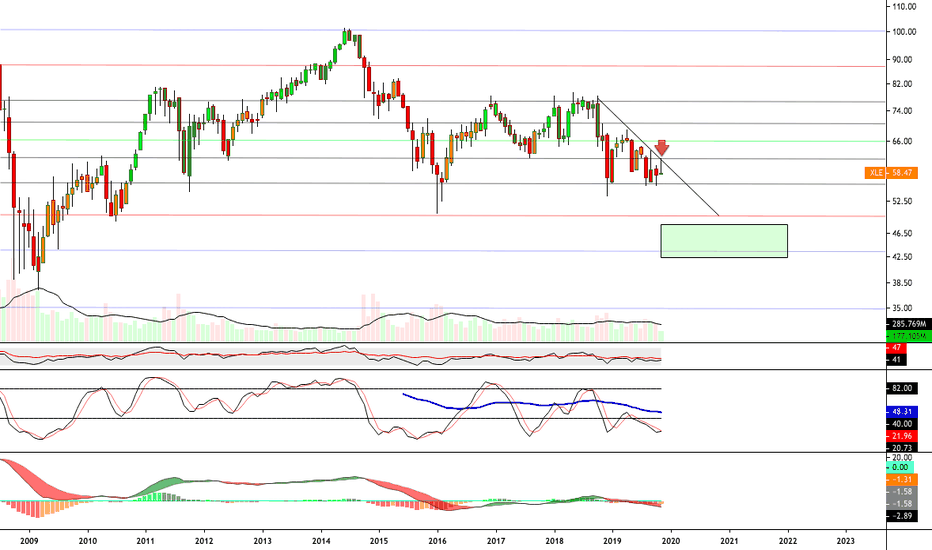
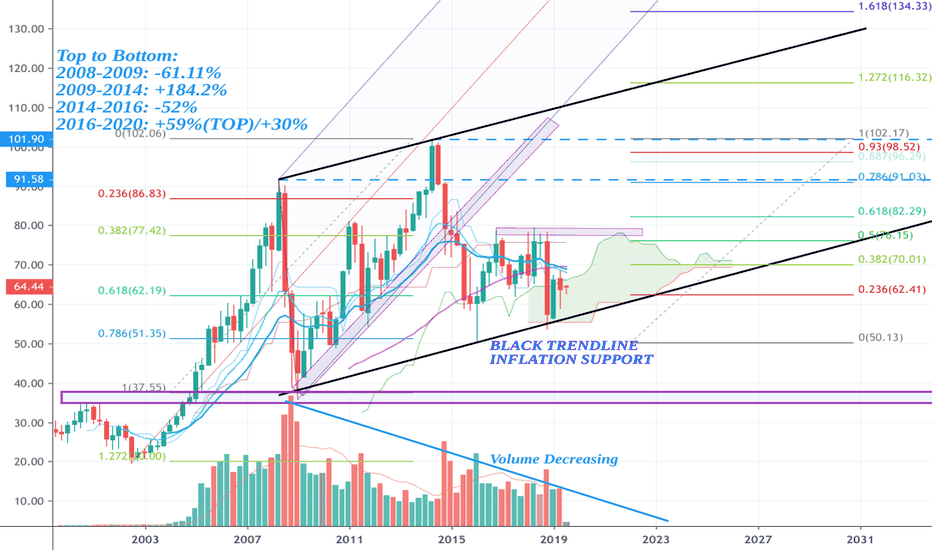
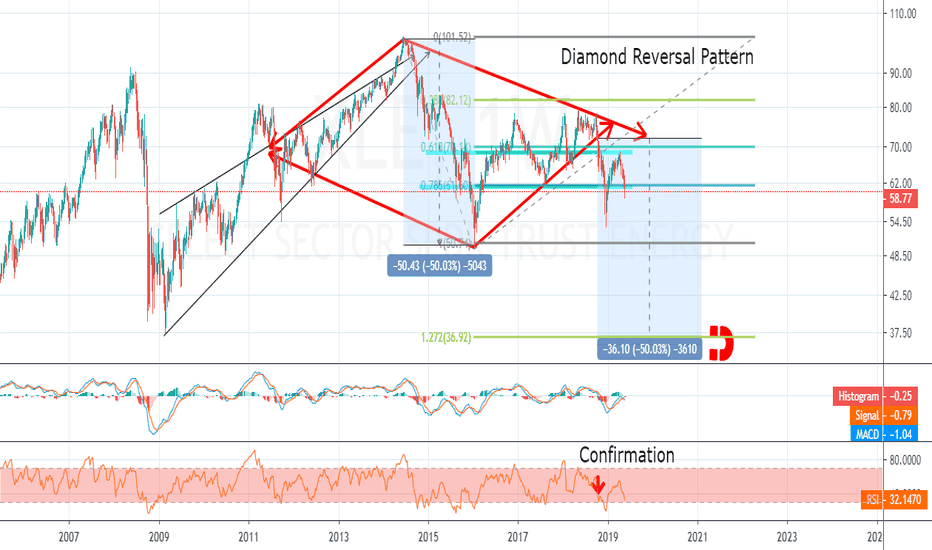
QUARTERLY XLE-ENERGY STRUCTURALLY DETAILED TA-2019 (+MACD/RSI)Safe to say that post 2014 (and even earlier) the renewables have become a serious competition to the traditional part of the XLE sector(coal/gas/oil).
Crucial note: Breaking of the black trendline, could symbolize the start of a recession as this would mean that inflation expectation have decreased.
In any case, this is just a brief analysis, everything is on the chart. There's really not much to say, XLE hasn't performed well in the last 5 years(blue text) compared to other sectors.
>>If you liked this idea give it a thumbs up! Every follow is much appreciated!>>
Full Disclosure: This is just an opinion, you decide what to do with your own money. For any further references- contact me.
Oil stocks look bullish to me. XLE weekly log You can see we have had a long sideways consolidation which to me looks like a 5 wave triangle . If US Dollar continues to drop as I favor and with all the global turmoil in oil producing countries it is fertile ground for oil to rise. The dotted horizontal lines I see as resistance. Strong weekly candle last week and break of short term down trend line.
Have great week.
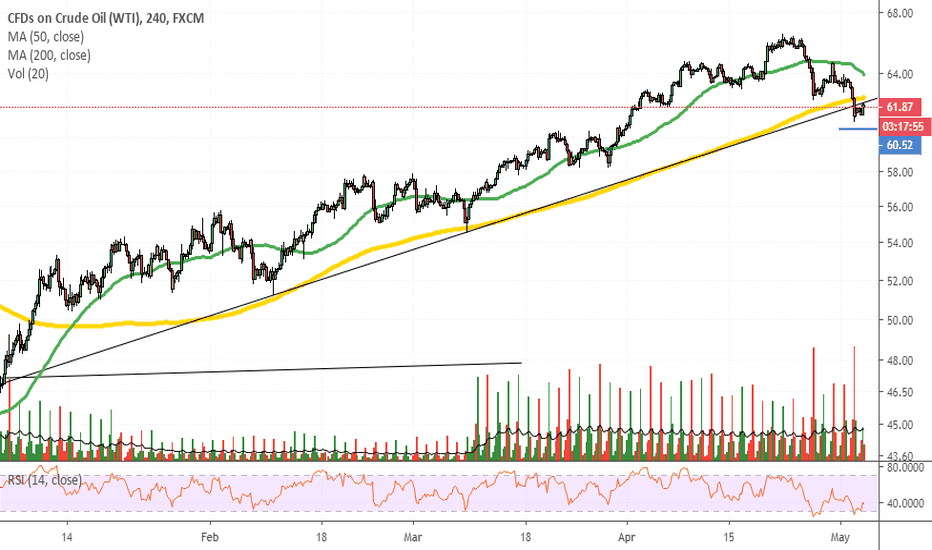
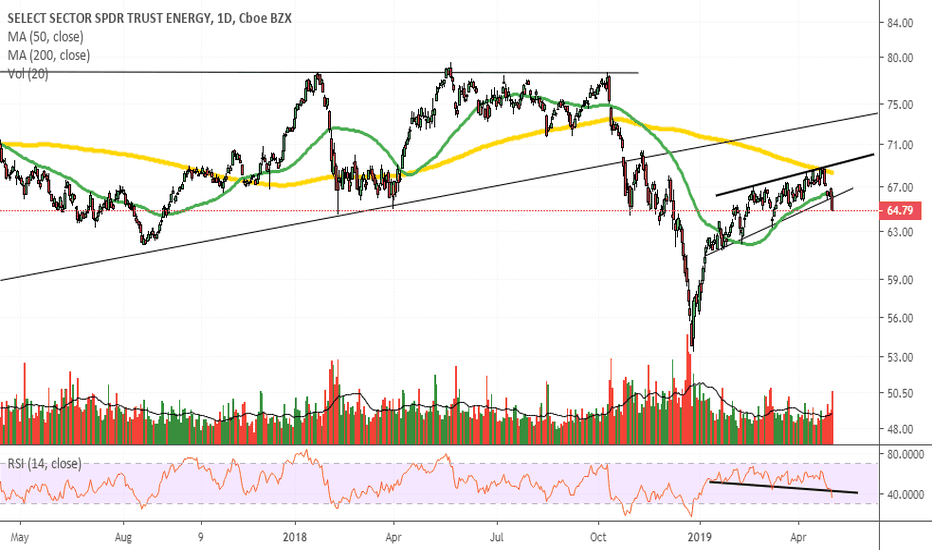
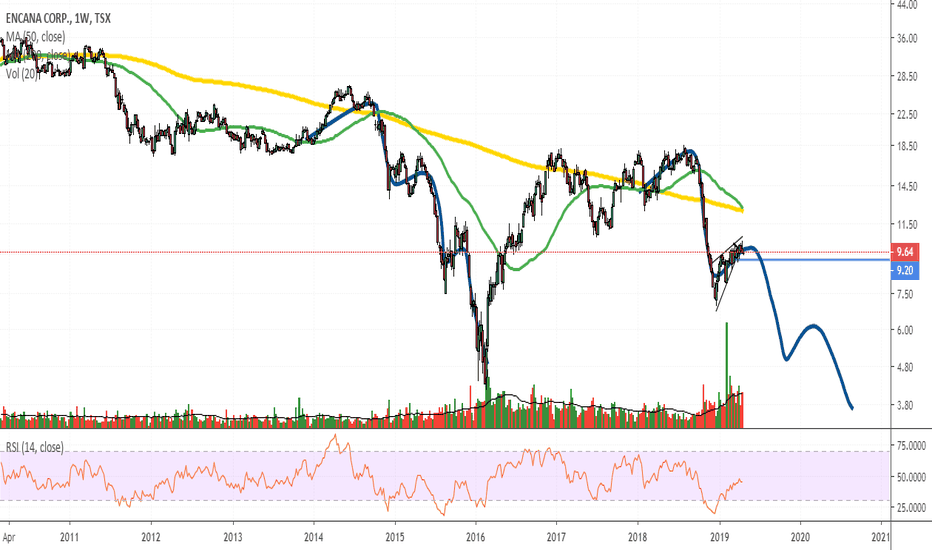
death cross on weeklyoil at potential inflection point, watching for a sharp move lower $ECA $XLE $XOP
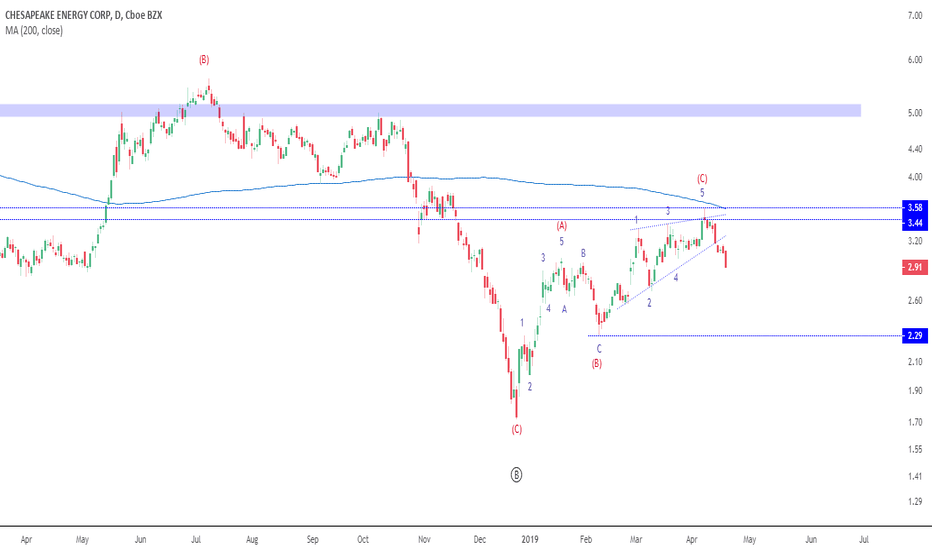
CHK Update: Uranium producers await US presidential decisionReflecting on our positions and where this trade is likely to trade
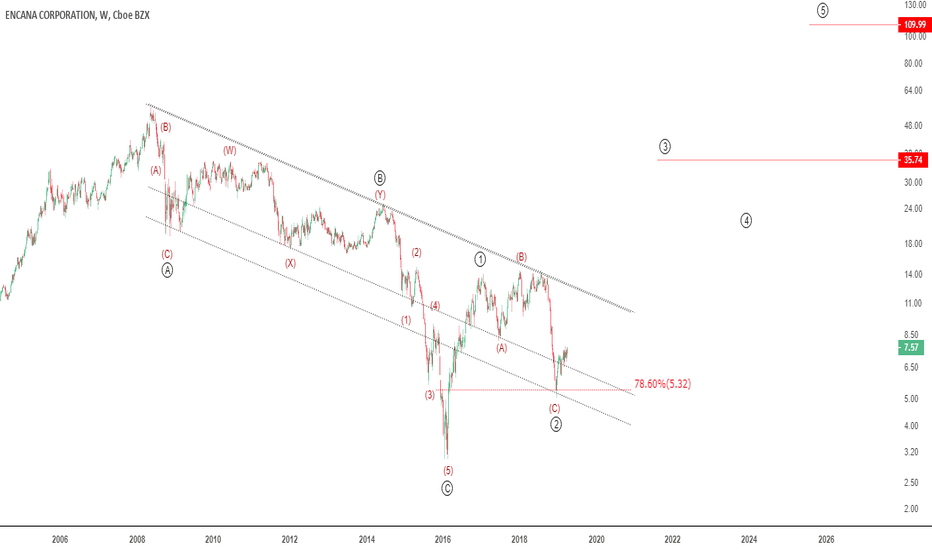
Encana Corporation: Stup*d CHEAP!!!Consistent growth, profitable, SUPER cheap relative to broad valuations! A rising oil price over the coming years will lead to earnings estimate increases!
