Opened (IRA): XLE April 19th 88 Covered Call... for a 85.43 debit.
Comments: Looking to attempt to grab the March dividend, which has been averaging around .80 over the past four distributions.
Metrics:
Buying Power Effect/Break Even/Cost Basis in Shares: 85.43
Max Profit: 2.57 ($257)
ROC at Max (ex. dividend): 3.01%
ROC at Max (w/dividend): 3.94% (assuming an .80 distribution)
ROC at 50% Max (ex. dividend): 1.50%
ROC at 50% Max (w/dividend): 2.44% (assuming an .80 distribution)
XLE

S&P500 Sector ReviewDiscussing all the sectors of the S&P500 sectors. Looking for capital rotation trades.
DJT
XLB
XLC
XLE
XLF
XLI
XLK
XLP
XLRE
XLU
XLV
XLY

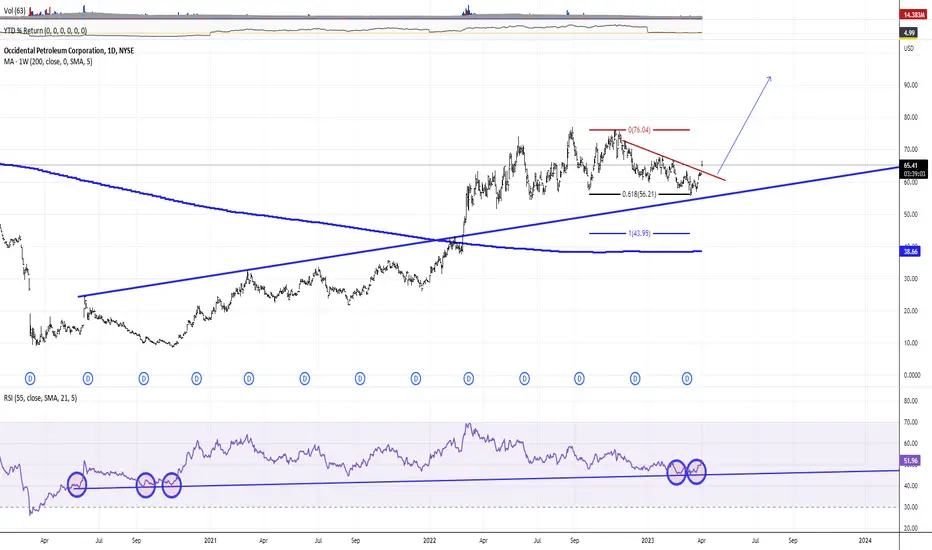
Occidental Petroleum Corp.: Bullish Bias. ContinuationTo be successful on Wall Street, it is important to be flexible and be able to recognize changing market winds - the patterns that tell investors when to get in and out of the market.
Sometimes a breeze is a warm and inviting wind: assets rise in value, and it seems that everyone is making money.
Other times, it turns into a violent storm, leaving in its wake financial destruction, memories of the past, and hope that better times are yet to come.
Occidental Petroleum Corporation (often abbreviated as Oxy in reference to the symbol and logo) is an American company engaged in hydrocarbon exploration in the United States and the Middle East, as well as petrochemical production in the United States, Canada and Chile.
The oil company, among other Value Investing Assets, has become one of the main beneficiaries of the weakening and reversal of WFH ("Working From Home") disinflationary trends that quickly shook the entire financial world against the backdrop of the Covid-19 pandemic in Q1 2020. But faded also just as quickly, while since the first quarter of 2021, in two years, many growth assets have been undermined, rocked by scandals, or completely destroyed.
It was revealed in March that Warren Buffett's Berkshire Hathaway added more shares to an already large bet on Occidental Petroleum, according to an SEC Form 4 report released on March 7, 2023.
The Buffett conglomerate bought nearly 5.8 million shares of the oil company over multiple trading sessions in March, at prices ranging from $59.85 to $61.90, according to the documents.
Berkshire now owns 200.2 million shares of Occidental, totaling 22.2% of the oil company's shares, up from 21.4% previously.
Occidental shares are currently among the top 10 Berkshire holdings. The energy company outperformed the S&P 500 index last year, more than doubling in price.
In March, Occidental CEO Vicki Hollub said in an interview with CNBC that she met with the 92-year-old investor, noting that they talked about the oil and gas industry and related technologies.
Last August, Berkshire received regulatory approval to buy up to 50% of Occidental, sparking speculation that Berkshire could eventually buy out the entire Occidental company.
Berkshire also owns $10 billion of preferred shares in Occidental and has warrants to buy another 83.9 million shares of common stock for $5 billion, or $59.62 each. The warrants were obtained as part of the company's 2019 deal that helped finance the purchase of Anadarko Occidental.
While many investors even now continue to believe in the crypto-snow that melted without a trace the winter before last, the technical picture indicates the possibility of Growth comtinuation in value investment assets, incl. Occidental Petroleum - after the completion of the 0.618x Fibonacci retrace to the Growth that began later to Russian President "Special Military Operation" announcement in Q1'22.
Also, the support of weekly SMA (200) in CL1! - Crude Oil Futures adds bullish bias to market participants.
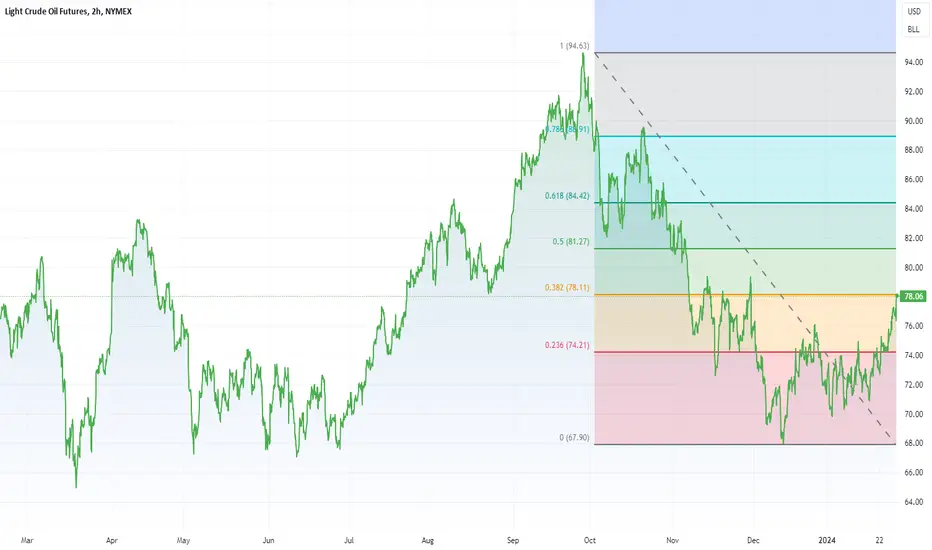
WTI Jumps to $78, Key Fibo Level - The Next Big Risk?Mega-cap tech’s climb to jumpstart 2024 fooled many strategists who called for value, cyclical, and small-cap niches to outperform. The same old playbook has been in full swing, but could that be about to change? Consider that banks, not chips, ended this week at fresh multi-year highs following a late-week pullback among the big semiconductor names.
But there’s more action out there that few are paying attention to. Have you seen WTI crude oil recently? Tensions in the Red Sea have been ongoing for many weeks, but it has just been over the last few sessions that WTI has taken flight. The prompt month now trades near $78. Gasoline futures, meanwhile, rose above $2.30, implying a national retail pump price average near $3.25 over the coming weeks.
Consumers might not like that, and it would come immediately after a sanguine set of University of Michigan Surveys of Consumers for January. We will get an updated read on that Friday next week. I also point out in today’s featured chart that US light sweet crude oil is now at a pivotal Fibonacci retracement level on the chart. Watch how the bulls and bears battle it out as the calendar flips to February. If we rally through $78, and hold it on pullbacks, a rotation in the market could very well take place, right as mega-cap tech reports Q4 results.
XLE Energy stocks, time to buy? Oil has been creeping up lately. Today it triggered a bullish intraday pattern.
This intraday pattern if completes, sets up for a larger bullish daily chart pattern.
If this breakout in oil happens were going to see some energy stocks make moves liek the Semiconductors did today.
Many names like RIG, XOM, HAL, XLE put in daily bottoming tails.
Some energy stocks have much higher beta than others..be careful.
Not FA advice.

oil and the secondary wave of inflation.before you read any further read my post from may:
---
in may of 2023 i called the top on oil and projected we come down into the $50-60 range. we ended up playing it out quite flawlessly. a lot of people were very angry at me for whatever reason back when i was calling for the top, probably due to their elevated levels of confidence and greed. those people got wiped out.
today, i bring to you a follow-up prediction, in line with my us10y prediction.
---
i'm predicting that oil hits $181 per barrel over the next year, which will cause a secondary wave of inflation.
---
oil w5 algo = $181

Natural GAs makes epic reversal, Oil Pummeled. Nat Gas made an epic reversal today after being down over 6%.
Oil got pummeled today despite a weak dollar.
Is the energy market breaking down?

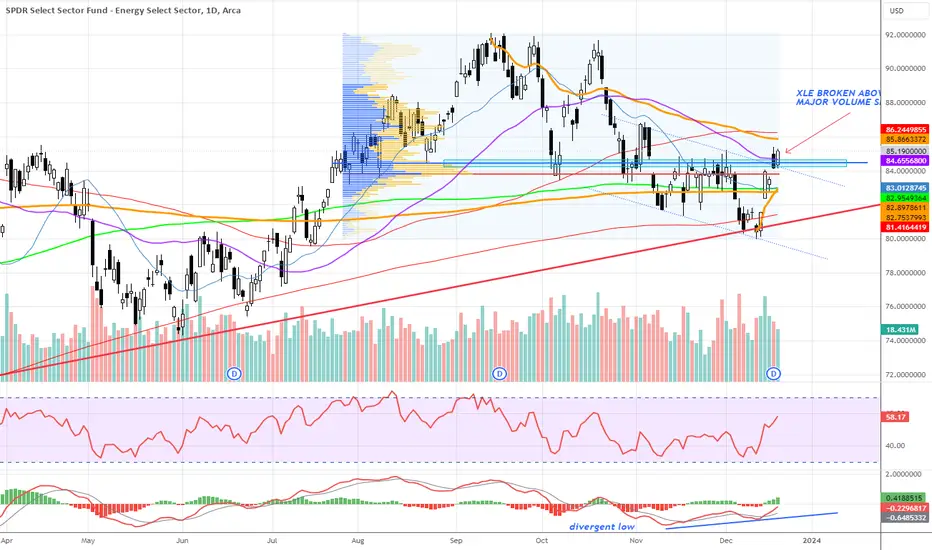
#XLE broken above resistance and major volume shelf - more to goXLE ETF has broken above both a major resistance level (horizontal and channel) as well as a major volume shelf. In addition it's come off a divergent low which has propelled it higher. I think energy names have some legs here..
Nat Gas & Oil reversing Lower!Nat Gas saw a decent 4% decline today.
It made a lower high in the trend which leaves it vulnerable.
Oil hitting resistance and turning negative.

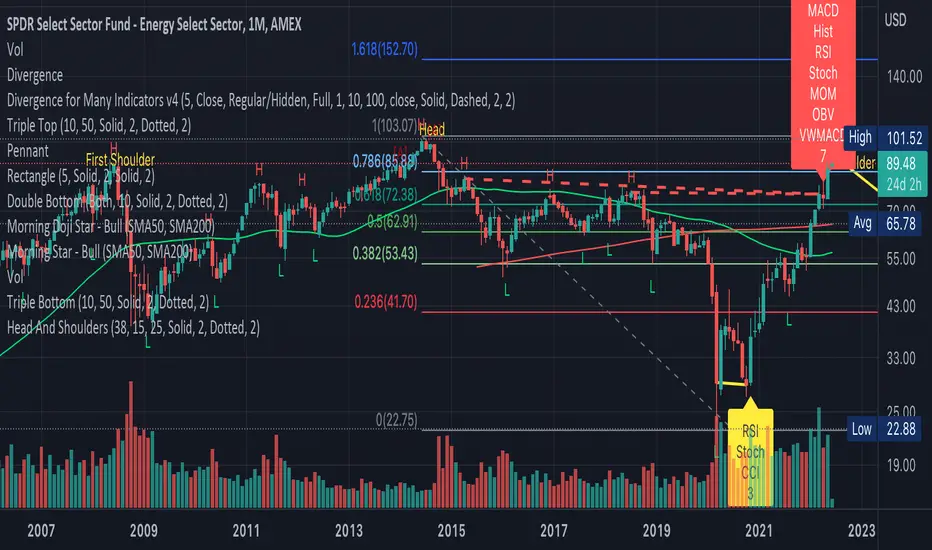
XLE Nasty Setup From a technical level, the XLE is showing a potential head and shoulders setup on a monthly chart. Combine this with major bearish divergence leaves shorting this basket of stocks as the trade of the year.
Any potential good news on the Ukraine/Russia front would be devastating on a fundamental level.
Everyone is long energy. Be brave, be bold. AMEX:XLE
Is energy about to surge or collapse?Oil Looking very weak!
Natural GAs is almost ready to accumulate on the long side.
XLE putting in bearish consolidation!

Natural Gas & Oil looking heavyThe energy market may see some headwinds in the next 1-2 weeks.
Natural Gas storage update on Thursday.
Oil has triggered a head & shoulder pattern

Tech stock Vs Energy stocks. The Competition for Decades This is an education-style publication where the main graph is a comparison (ratio) between two ETFs (funds) managed by State Street Global Advisors Corporation, the creator of the world’s first ETF (well-known in nowadays as AMEX:SPY ) and an indexing pioneer.
The first one ETF is The Technology Select Sector SPDR Fund, AMEX:XLK .
👉 AMEX:XLK seeks to provide investment results that provide an effective representation of the Technology sector of the S&P 500 Index SP:SPX .
👉 AMEX:XLK seeks to provide precise exposure to companies from Technology hardware, storage, and peripherals; software; communications equipment; semiconductors and semiconductor equipment; IT services; and electronic equipment, instruments and components.
👉 AMEX:XLK is a place where securities of American World-known Technology companies like Apple Inc. NASDAQ:AAPL and Microsoft Corp. NASDAQ:MSFT , like Nvidia Corp. NASDAQ:NVDA and American Micro Devices NASDAQ:AMD , like Cisco Systems Inc. NASDAQ:CSCO and Adobe Inc. NASDAQ:ADBE meet together.
👉 In contrast with other Technology-related ETFs like NASDAQ:QQQ (Invesco Nasdaq 100 Index ETF) or NASDAQ:ONEQ (Fidelity Nasdaq Composite Index ETF), stocks allocation in AMEX:XLK depends not only on their market capitalization, but also hugely on Technology industry allocation (like software, technology hardware, storage & peripherals, semiconductors & semiconductor equipment, IT services, communications equipment, electronic equipment instruments & components).
That is why allocation of Top 3 holdings in AMEX:XLK ( Microsoft Corp. NASDAQ:MSFT , Apple Inc. NASDAQ:AAPL and Broadcom Inc. NASDAQ:AVGO ) prevails 50 percent of Funds assets under management.
👉 Typically AMEX:XLK holdings are Growth investing stocks.
The second one ETF is The Energy Select Sector SPDR Fund, AMEX:XLE .
👉 AMEX:XLE seeks to provide investment results that provide an effective representation of the energy sector of the S&P 500 Index SP:SPX .
👉 AMEX:XLE seeks to provide precise exposure to companies in the oil, gas and consumable fuel, energy equipment and services industries.
👉 AMEX:XLE allows investors to take strategic or tactical positions at a more targeted level than traditional style based investing.
👉 AMEX:XLE is a place where stocks of American World-known Oil companies like Exxon Mobil Corp. NYSE:XOM and Chevron Corp. NYSE:CVX , like EOG Resources Corp. NYSE:EOG and ConocoPhillips NYSE:COP , like Valero Energy Corp. NYSE:VLO and Phillips 66 NYSE:PSX meet each other.
👉 Weight of Top 3 holdings in AMEX:XLE (Exxon Mobil Corp. NYSE:XOM , Chevron Corp. NYSE:CVX and EOG Resources Corp. NYSE:EOG ) prevails 45 percent of Funds assets under management.
👉 Typically AMEX:XLE holdings are Value investing stocks.
The main graph represents different stock market stages of work
🔁 Early 2000s, or post Dot-com Bubble stage, that can be characterized as Energy Superiority Era. There were no solid Quantitative Easing and Money printing. U.S. Treasury Bond Interest rates TVC:TNX , TVC:TYX as well as U.S. Federal Funds Rate ECONOMICS:USINTR were huge like nowadays. Crude oil prices TVC:UKOIL , TVC:USOIL jumped as much as $150 per barrel.
The ratio between AMEX:XLK and AMEX:XLE funds collapsed more than in 10 times over this stage.
🔁 Late 2000s to early 2010s, or post Housing Bubble stage, that can be characterized as a Beginning of Quantitative Easing and Money printing. U.S. Treasury Bond Interest rates TVC:TNX , TVC:TYX as well as U.S. Federal Funds Rate ECONOMICS:USINTR turned lower. Bitcoin born.
The ratio between AMEX:XLK and AMEX:XLE funds hit the bottom.
🔁 Late 2010s to early 2020s, or post Brexit stage, that can be characterized as a Continuation of Quantitative Easing and Money printing. U.S. Treasury Bond Interest rates TVC:TNX , TVC:TYX as well as U.S. Federal Funds Rate ECONOMICS:USINTR turned to Zero or so. Crude oil turned to Negative prices in April 2020 while Bitcoin hit almost $70,000 per coin in 2021.
Ben Bernanke (14th Chairman of the Federal Reserve In office since Feb 1, 2006 until Jan 31, 2014) was awarded the 2022 Nobel Memorial Prize in Economic Sciences, jointly with Douglas Diamond and Philip H. Dybvig, "for research on banks and financial crises", "for bank failure research" and more specifically for his analysis of the Great Depression.
The ratio between AMEX:XLK and AMEX:XLE funds becomes great and respectively with monetary stimulus hit the all time high.
🔁 Early 2020s, or post Covid-19 Bubble stage, that specifically repeats early 2000s Energy Superiority Era. There is no again Quantitative Easing and Money printing. U.S. Treasury Bond Interest rates TVC:TNX , TVC:TYX as well as U.S. Federal Funds Rate ECONOMICS:USINTR are huge nowadays like many years ago. Commodities prices like Wheat CBOT:ZW1! , Cocoa ICEUS:CC1! , Coffee ICEUS:KC1! , Crude oil prices TVC:UKOIL , TVC:USOIL jump again to historical highs.
The ratio between AMEX:XLK and AMEX:XLE funds is fading to moderate levels that can be seen as 200-Month simple moving average.
💡 In a conclusion.. I wonder, how the history repeats itself.
This is all because markets are cyclical, and lessons of history always still remain unlearned.
💡 Author thanks PineCoders TradingView Community, especially to @disster PineCoder for its excellent and simple script Quantitative Easing Dates .
Based on this script, Easing Dates are highlighted at the graph.

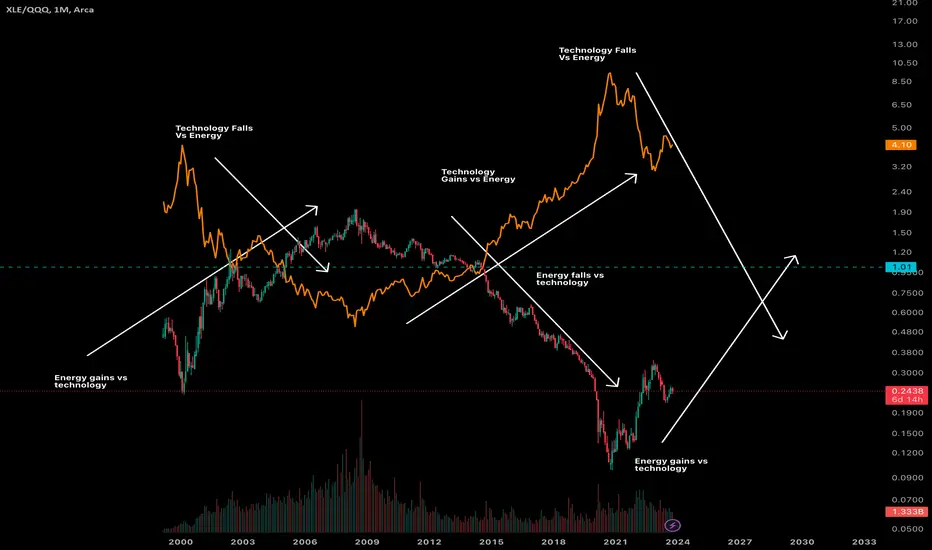
Technology to Energy RatioEverything is cyclical. Every asset has its own cycle eventually in its own time. From Crypto to Real estate and Technology.
I crossed compared the Energy sector to the Technology Sector. XLE/QQQ
Then overlaid the Technology Sector to the Energy Sector QQQ/XLE
As you can see there is many clues where one will always outperform the other.
You just have to hold these assets where one is gaining vs the other.
One asset will suck the liquidity of the other and visa versa until one completes the cycle then it repeats
Hard assets are primed for outperformance.
Happy Investing
Looming Threats to Food and Energy SecurityThe global food and energy markets face growing uncertainty and volatility in the coming years due to converging factors that could lead to supply shortages, price spikes, and potential shocks.
One concern is the impact of declining sunspot cycles on the climate. Scientists predict that a grand solar minimum could occur in the coming decades, causing global cooling and disruptive weather patterns, negatively affecting grain production in key agricultural. With grain supplies tightened, any further demand increases would send prices a lot higher.
Global grain consumption has grown steadily, increasing by over 2% in the last 25 years. Rising disposable incomes in developing countries have enabled consumers to add more protein foods like meat and dairy to their diets. However, this dietary shift puts pressure on grains, since over 8 pounds of grain is needed to produce just 1 pound of beef. Hence, increased meat consumption indirectly leads to higher demand for grains.
The ongoing war in Ukraine has severely impacted global grain markets, compounding the risks. Combined, Russia and Ukraine account for nearly 25-30% of worldwide wheat exports. With both countries blocking or threatening to destroy grain shipments, the conflict poses a huge threat to food security especially in import-dependent regions like North Africa and the Middle East. Export restrictions like India's recent rice export ban to protect domestic food security are also tightening global grains trade. As supplies dwindle, agricultural commodities become more vulnerable to price shocks.
These supply uncertainties make soft commodities like cocoa, coffee, and sugar especially at risk of price spikes in coming years. Prolonged droughts related to climate cycles like La Niña and El Niño could severely reduce yields of these crops grown in tropical regions of Southeast Asia, Africa, and South America. For instance, a drought in West Africa's prime cocoa-growing areas could significantly impact production. Cocoa prices are already trading near 6-year highs in anticipation of shortages. If drought hits key coffee-growing regions of Vietnam and Brazil, substantial price increases could follow.
Similar severe drought potential exists in the U.S. Midwest this summer. Lack of rainfall and moisture could cause severe yield reductions in America's corn and soybean belts. Since the U.S. is the world's largest corn and soybean exporter, this would cause severe upward price pressures globally. The rise in agricultural commodities ETF Invesco DBA likely reflects investor concerns about impending supply shortages across farming sectors, and its price might be leading the spot price of agricultural commodities.
Fertilizer prices also contribute to food market uncertainty. In 2021-2022 fertilizer prices skyrocketed due to energy costs rising, directly raising the cost of food production. When fertilizer prices surge, it puts immense pressure on farmers' costs to grow crops and indirectly influences food prices. However, falling fertilizer prices do not necessarily translate into lower food costs for consumers. Fertilizer prices have dropped substantially over the last year, without that meaning everything is fine with fertilizer production. Dropping fertilizer prices could actually indicate a slowdown in agriculture, as, lower demand for fertilizers could mean fewer farmers are investing in maximizing crop yields. In that case, food production may decline leading to higher prices due to supply and demand fundamentals. At the same time, if other farm expenses like machinery, seeds, or labor rise due to factors like high energy costs, overall production costs could still increase even as fertilizer prices decline.
The energy markets face a similar mix of uncertainty and volatility ahead. Despite substantial declines in prices, the energy sector ETF XLE has held up well, suggesting investors anticipate a rebound in oil and natural gas. Fundamentally, both commodities could trade a lot higher in the long term, however in the medium term I believe that oil is poised to drop further to the $55-60 area before tightening supplies lead to much higher prices. Essentially what’s missing is a capitulation to flush bullish sentiment, and then lead to much higher prices. At the moment the market has found a balance between a weakening global economy and OPEC+ supply cuts.
A key uncertainty is China's massive oil stockpiling in recent years, now totaling nearly 1 billion barrels. If oil exceeds $80-85 per barrel, China could temper price rallies by releasing some of these reserves, as it did in 2021. With China's economy in turmoil, further reserve releases may be needed to stimulate growth, but it’s unclear whether its economy will be able to come back easily. Weak demand from China is already an issue for the oil market, and releases from the Chinese SPR could restrain oil prices over the next year. However, on the bullish side, the world remains heavily dependent on fossil fuels lacking viable large-scale alternatives, even as ESG trends continue. OPEC's dwindling spare production capacity raises risks of undersupply. Even an economic recession may only briefly dampen oil prices before supply cuts by major producers again tighten markets.
Ultimately, sustained high energy prices will restrain broader economic growth by reducing demand across sectors. The outlook for food and energy markets remains uncertain, with significant risks of continued volatility over the next few years. Multiple converging factors point to potential supply shortages and price spikes across agricultural commodities and fossil fuels. While prices may fluctuate in the short-term (6-12 months), the medium-term trajectory appears to be toward tighter supplies and higher costs for food and energy (2-5 years). To close on a more positive note, I believe that food and energy prices will see significant deflation as extreme technological progress pushes prices down in the long term (5+ years).

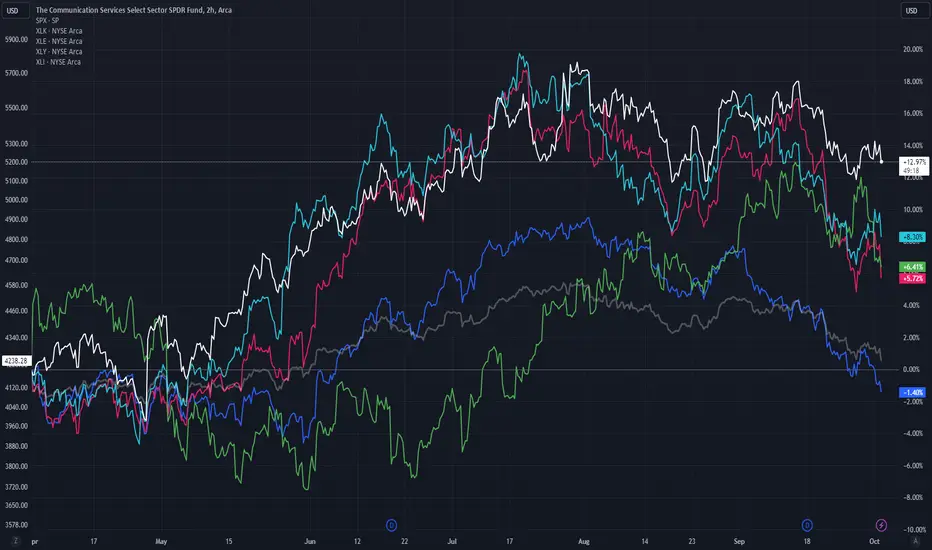
Will communications $XLC lead the next leg up? In the last 6 months AMEX:XLC is the leading sector in the $SPX.
And with the recent sell of in the energy sector AMEX:XLE , communications is the only sector without lower lows.
There are various stocks that confirm this strength in AMEX:XLC , some are NASDAQ:MATH , NASDAQ:ATVI , NASDAQ:META , NASDAQ:CHTR and many others.
Let's wait and see.
Make Exxon Great Again. As Here's A Hundred Fold OpportunityElectric vehicles are growing so fast that Exxon Mobil is preparing for a future when "customers don’t need that gasoline".
Exxon Mobil Corp., which operates one of the world’s biggest oil-refining networks, is trying to be more responsive to changing consumer demands as the energy transition gathers pace. The changes it’s considering include potentially replacing some gasoline production with chemicals.
The oil giant has long pursued a strategy of upgrading refineries to expand production and make higher-value products from crude oil such as lubricants and plastic feedstock. But it now sees those projects potentially helping the company to move away from traditional fuels, demand for which is likely to wane in coming decades.
The strategy, discussed in August 2023 by executives at a presentation to investors and media, shows how even Exxon, one of the leading proponents of fossil fuels, is being forced to reckon with a future in which electric vehicles significantly eat into gasoline consumption.
Exxon has already reduced production of fuel oil and high-sulfur petroleum at refineries in Singapore and the UK. Over time, it’s open to cutting output of gasoline, the focus of the company’s refining business since Henry Ford introduced the Model T nearly 100 years ago. The goal is to produce more chemicals, found in everything from paint to plastic, for which there are few low-carbon alternatives.
"We’re planning on modifying some of that yield from gasoline to distillate and chemicals feed," Jack Williams, Exxon senior vice president, said earlier this year at the company’s office in Spring, Texas. "We’ve got projects that we know we would do to take those steps."
Exxon gets most of its earnings from oil and natural gas production but refining has always been in its corporate DNA, right back to its original incarnation as part of John D. Rockefeller’s Standard Oil, which was established in the 19th century.
Refining allows Exxon to earn money right along the fossil fuel supply chain, from the wellhead to the gas tank. But with traditional fuels such as gasoline under threat from EVs, refineries worldwide are being forced to adapt quickly. Some European plants shut down during the pandemic, while others in the US switched to biodiesel.
Exxon wants to take a more nuanced approach by upgrading facilities to switch in and out of products depending on demand. To give an example, an Exxon refinery in Singapore used to produce fuel oil that sold for $10 per barrel below the price of Brent crude, but after a recent upgrade, the facility produces lubricant base stocks that sell for $50 above Brent.
Exxon has upgraded and added to its refineries at Fawley in the UK and Beaumont in Texas to produce more diesel, which is used for heavy-duty transportation and is less vulnerable to competition from electric vehicles.
"You just have more variables now due to the energy transition," said Jay Saunders, a natural resources fund managers at Jennison Associates, which has $186 billion under management. "Having a high-quality refining asset with flexibility will be very important."
Exxon’s refining and chemicals footprint is at least double that of its Big Oil competitors, potentially making it more vulnerable to a speedy energy transition, and especially the growth of electric vehicles. But executives believe the potential for reconfigurations is far greater than that of its peers, providing an opportunity to profit in a low-carbon future.
"This really allows us to pivot as demand evolves," said Karen McKee, President of Exxon’s Product Solutions division.
Biodiesel is particularly attractive to Exxon because reconfiguring its existing refineries costs about half as much as building a new plant, said Neil Hansen, senior vice president of product solutions. Demand for biodiesel, which is manufactured from vegetable oil or recycled restaurant grease, is expected to quadruple to 9 million barrels a day by 2050, he said.
Exxon is halfway through an eight-year plan to overhaul its fuels and chemicals division, which also involves cutting costs, improving operational performance and selling assets that don’t make the grade. Exxon will operate just 13 refineries worldwide by the end of 2023 after selling five in the past four years to focus on the biggest and lowest-cost operations.
Chemicals will be key to the strategy’s success. Exxon sees demand growth for its high-performance chemicals at about 7% a year, contrasting sharply with gasoline, which is expected to peak globally by the end of the decade. To keep up with this demand, Exxon plans to build a new dedicated chemical plant every four to seven years, Williams said.
The company’s refineries provide an additional means to make chemicals, but they will focus on responding to consumer preference rather than making a big bet on any particular product, Williams said.
"We’re not going to do it while the demand is still there," he said. "We’re going to it at a time when the demand trends are clear and customers don’t need that gasoline."
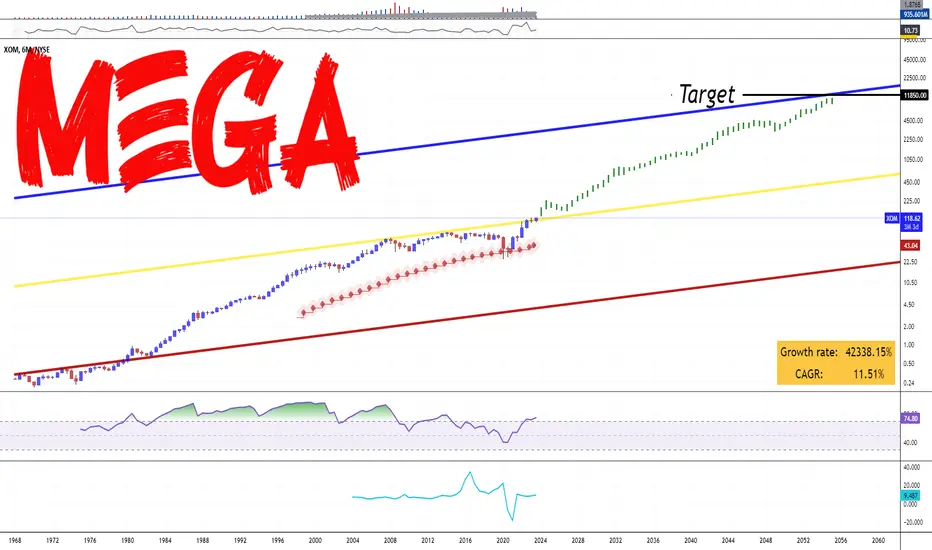
At the same time technical picture in Exxon stocks (dividends adjusted) illustrates Exxon got a huge support of 30-years SMA, and right here is a key Multiyear breakout.
Further a hundred fold growth is right there to come. Make Exxon Great Again.
#MEGA
XLE - true breakout or fakeout?Oil has been ripping lately and trying to establish a new consolidation range. Keep in mind this rally in energy has occurred as the DXY has had 9 weeks of consecutive upside.
The energy sector has been a bullish piece of the market and is at a critical support level.
If this breakout in XLE is to hold we could see some significant upside.
A weekly & daily breakout has been confirmed but when you zoom out to the monthly chart this could be signalling a failed Double top reversal.
Seeing how XLE closes the monthly candle will be telling for the market as oil has been the main increase in the CPI and inflation expectations.

$OXY - Rising Trend Channel🔹Breakout resistance at 65.90, indicating a potential further rise, and potential support at 65.90 in case of NEGATIVE reactions.
🔹POSITIVE volume balance indicates higher volume on rising days.
🔹The RSI curve indicates a positive trend, indicating a rising trend.
🔹Technically POSITIVE for the short term.
Chart Pattern:
◦ DT: Double Top | BEARISH | 🔴
◦ DB: Double Bottom | BULLISH | 🟢
◦ HNS: Head & Shoulder | BEARISH | 🔴
◦ REC: Rectangle | 🔵
◦ iHNS: inverse head & Shoulder | BULLISH | 🟢
Verify it first and believe later.
WavePoint ❤️

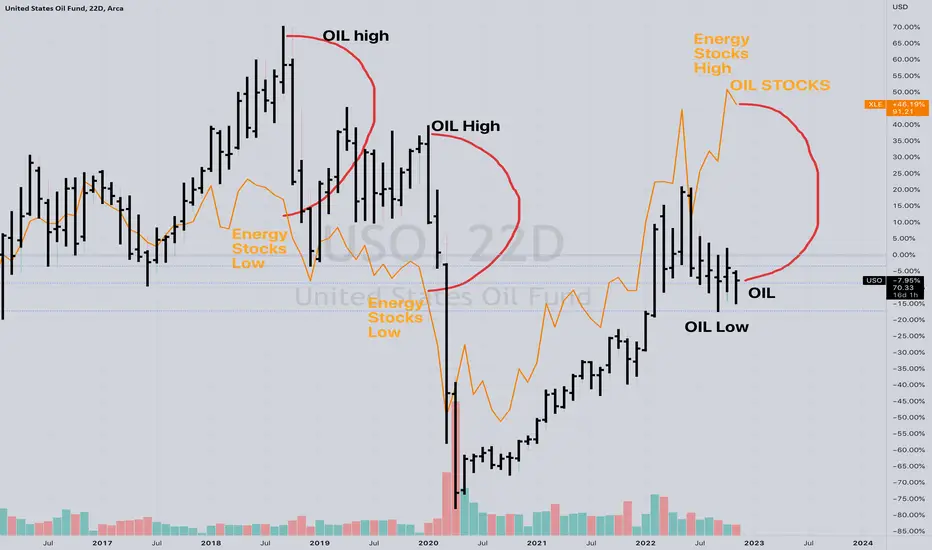
OIL STOCKS leading CRUDE OILWhat do you mean by a spread? A spread is a difference between two similar markets, in this case oil stocks and oil service companies versus the basic commodity that those oil companies trade in, which is crude oil.
There is a substantial trade set up at the moment that presents large returns with a reasonable amount of risk. Shorting Energy Stocks using the $XLE ETF and going long oil with the $USO ETF.
In the last two instances, it was $USO that was leading higher without $XLE to support the advance, and $USO collapsed to close the spread. See chart enclosed above.
Why does this spread exist? We can point to political promises to "end the use of oil" that forced investors to reconsider the long term valuations of oil stocks. Investors don't typically "own oil" through oil futures, rather they own "oil in the ground" by way of oil companies.
Risk $5-$10 in crude oil and 5%-10% in $XLE roughly. If one market moves more than 5% then we can look to increase the position and tighten the stops to break-even.
There is no specific 'catalyst' to drive this pair back together at the moment. If the economy opens back up globally, then oil demand estimates will rise and cause people to buy oil futures. Opening up could also drive energy stocks higher too due to very high margins currently in the processing of crude oil into their refined products.
The only risk in life is taking no risks. Nothing is without risk. Holding cash leaves you to be exposed to inflation and the loss in purchasing power. The rest of the disclaimers are standard legal ones. I have no positions in this trade yet, but will be considering them.
A good way to manage risk is to use options in the form of spreads on both sides of this trade to define a maximum amount of risk in advance. Buying a call spread on $USO and buying a put spread on $XLE would serve to manage risk intelligently. The duration of this trade should be 3 months at maximum.
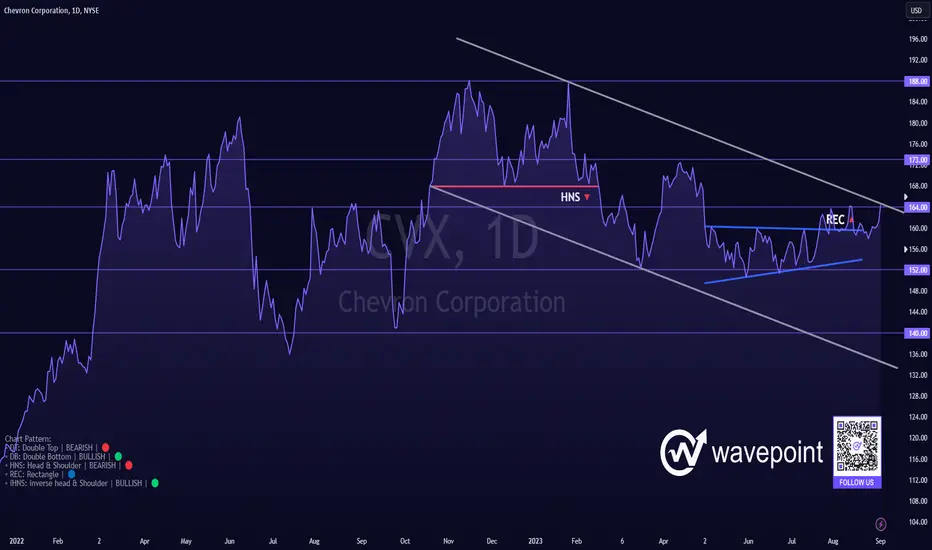
$CVX - Falling Trend Channel [MID-TERM]🔹Rectangle Formation produced a POSITIVE signal at a breakout resistance of 160.
🔹Marginally broken up through resistance at 164, next resistance at 173.
🔹RSI curve indicates a rising trend, indicating an early indication of a possible upward trend reversal for the price.
🔹Technically POSITIVE for the medium long term.
Chart Pattern:
◦ DT: Double Top | BEARISH | 🔴
◦ DB: Double Bottom | BULLISH | 🟢
◦ HNS: Head & Shoulder | BEARISH | 🔴
◦ REC: Rectangle | 🔵
◦ iHNS: inverse head & Shoulder | BULLISH | 🟢
Verify it first and believe later.
WavePoint ❤️
$XLE Ascending Triangle PatternAMEX:XLE Ascending Triangle Pattern, waiting for a breakout.
Key Elements:
Rising Support Line: This trendline connects the higher lows. It indicates that buyers are stepping in at higher prices, suggesting increasing demand and potential accumulation.
Slightly Sloping Resistance Line: This trendline connects the roughly equal highs, forming the upper boundary of the triangle. It represents a level where sellers are currently entering the market.
Interpretation:
The bullish triangle pattern suggests that despite the temporary resistance encountered at the horizontal trendline, buyers are gradually becoming more dominant. As the price gets squeezed into the apex of the triangle, there's a diminishing range between the highs and lows. This compression often signifies a potential breakout to the upside.
Potential Breakout:
Traders closely watch the pattern for a breakout. A breakout occurs when the price moves decisively above the horizontal resistance line. This is often accompanied by an increase in trading volume, indicating a surge in buying interest. The expected price target after a bullish triangle breakout can be estimated by measuring the height of the triangle at its widest point and adding it to the breakout price.
Confirmation:
To confirm the validity of the bullish triangle pattern, traders often look for an increase in volume during the breakout, price movement above the resistance line, and ideally, a retest of the upper trendline as new support.

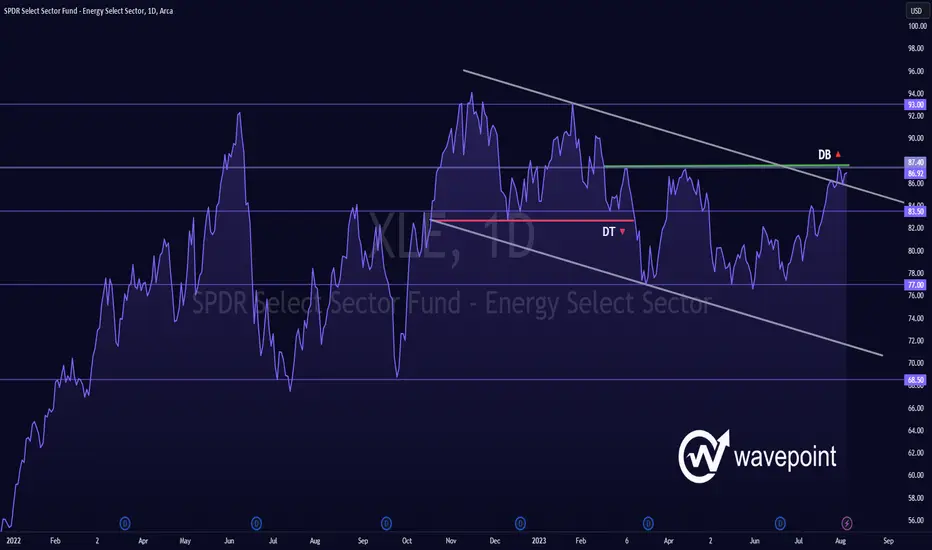
XLE - Falling Trend Channel🔹Breakout Falling Trend Ceiling in medium long term.
🔹Once breakout resistance 87.4 be POSITIVE signal.
🔹Short-term momentum is POSITIVE with RSI above 70.
Chart Pattern;
🔹DT - Double Top | BEARISH | 🔴
🔹DB - Double Bottom | BULLISH | 🟢
🔹HNS - Head & Shoulder | BEARISH | 🔴
🔹REC - Rectangle | 🔵
🔹iHNS - inverse head & Shoulder | BULLISH | 🟢
Verify it first and believe later.
WavePoint ❤️